EPAs EMAP Probability Monitoring Approach More Than Just
? Or Why Do We Need")
EPA’s EMAP Probability Monitoring Approach: More Than Just 305(b)? Or Why Do We Need Both Probability and Targeted Monitoring?
 – Condition • CWA Section")
Why Monitor for Water Quality? • CWA Section 305(b) – Condition • CWA Section 303(d) – Listing of Impaired waters • Congress and the public want to know the effectiveness of protection and restoration programs and policies (>$1 B/y spent on monitoring)

Public’s Questions • What are the current conditions of our ecosystems? • Where are the conditions improving or declining? • What stresses are associated with declines? • Are management programs and policies working?

States conduct Probability Survey with common suite of indicators Describe condition, with known confidence State 305(b) Reports (Intro to Integrated Report) National 305(b), State of the Environment Reports Associated Stressors Point Source Comparison of survey results to known impaired waters Nonpoint source Dose Likelihood Response Criteria Standards 303(d) List Diagnosis Integrated Monitoring and Assessment Equivalent Accept State 303(d) list (Category 4/5 of IR impaired waters) Waterbody has high probability of impairment (Category 4 or 5 should be considered) Inconsistent Apply Predictive Models to assess probability of impairment Waterbody has moderate probability of impairment Waterbody has low probability of impairment (Category 3) Category 1 or 2 of IR TMDL Development Remediation Targeted Monitoring Waterbody impairment confirmed Waterbody not impaired Continue to monitor as part of 5 -year cycle for random survey

EMAP Approach Indicators Designs + Ecoregion Framework Reference Condition Index Regionalization Assessments = Status (Trends) Variance Estimation Analysis Panel Rotation Data Variable Density Approaches Field Sampling Index Calibration Spatial Balance Index Construction Frame Development Population Identification Training Partnerships

EMAP Design • Probabilistic Design Framework – Randomized statistical designs allow interpretation of monitoring data with known uncertainty, extrapolation to the entire population with a small sample size, and statistical aggregation of like data to larger geographic areas • Classification - meaningful groupings within resource types and/or ecosystem types to allow better statistical design and analysis • Biological Indicators - Direct measures of aquatic ecosystem condition, integrates stressors, and more sensitive

Effectiveness of Design • Eutrophication of NE US lakes Sampling costs % Impaired Lakes – 4219 mostly problem lakes sampled by states for 305(b) – 2756 non-random lakes censused (Rohm et al. 1995) – 344 lakes with EMAP probability design (11, 076 lakes total)

EMAP’s National Coastal Assessment • 24 marine coastal states monitoring with core EMAP design and indicators

Comparison of Estuarine Conditions Estuarine Benthic Invertebrate IBI Louisianian Province Virginian Province Degraded 18 ± 8% Degraded 30 ± 6% Undegraded 82 ± 8% Undegraded 70 ± 6% Condition Unknown 10% Habitat 14% Metals 42% Unknown 39% Low Dissolved Oxygen 49% Low D. O. Contaminants 28% Contaminants 10% Toxicity 4% Both 2% Stressors Associated with Degraded Condition

National Coastal Assessment

Statistical Change Detection % area with impaired benthos • Change in Percent Area of Chesapeake Bay with Impaired Benthic Community 50 * 40 30 20 10 0 1991 -93 1997 -98
 Fair")
Stream Conditions in MAHA Potential Stressors Fish IBI Good 25% Sedimentation (Insufficient Data) Fair Riparian Habitat 24% Mine Drainage 14% 11% Acidic Deposition 10% Tissue Contamination Poor 5% Phosphorus Proportion of Stream Length Nitrogen Acid Mine Drainage 0% 5% 1% 10% 20% 40% 30% % of Stream Length 34% Introduced Fish 0% 10% 20% 30% 40%

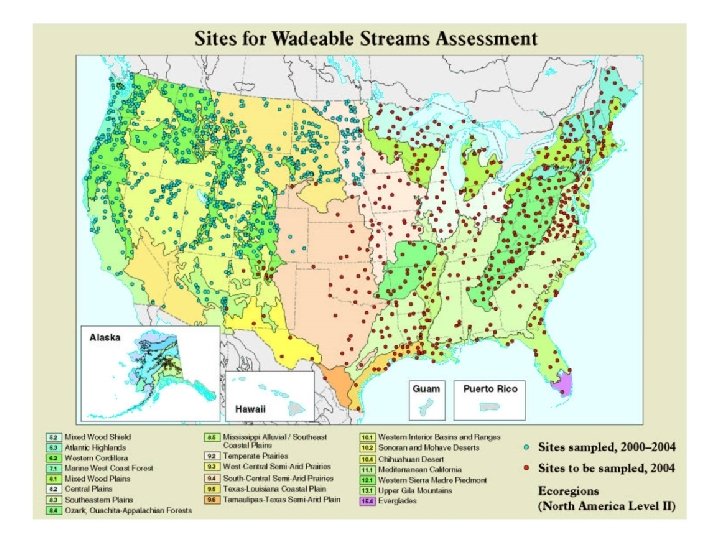
Western EMAP Streams h. Develop the science for a national state-based probabilistic condition assessments of streams 0 Design and analysis 0 Indicators 0 Reference Conditions

States conduct Probability Survey with common suite of indicators Describe condition, with known confidence State 305(b) Reports (Intro to Integrated Report) National 305(b), State of the Environment Reports Associated Stressors Point Source Comparison of survey results to known impaired waters Nonpoint source Dose Likelihood Response Criteria Standards 303(d) List Diagnosis Integrated Monitoring and Assessment Equivalent Accept State 303(d) list (Category 4/5 of IR impaired waters) Waterbody has high probability of impairment (Category 4 or 5 should be considered) Inconsistent Apply Predictive Models to assess probability of impairment Waterbody has moderate probability of impairment Waterbody has low probability of impairment (Category 3) Category 1 or 2 of IR TMDL Development Remediation Targeted Monitoring Waterbody impairment confirmed Waterbody not impaired Continue to monitor as part of 5 -year cycle for random survey

Quantitative Condition Measures • A scientifically-defensible reference conditions as a benchmark 30 Expert Opinion Reference Sites Frequency Reference Probability 20 10 0 0 10 20 Number of EPT Taxa 30

0. 8 0. 6 0. 4 0. 2 Sedimentation Probability Threshold Based on Empirical Data 0. 0 Probability of Benthic Impact in Streams 1. 0 Threshold for Biological Impact 0 20 40 60 Percent Fines (< 2 mm) in Substrate 80 100

States conduct Probability Survey with common suite of indicators Describe condition, with known confidence State 305(b) Reports (Intro to Integrated Report) National 305(b), State of the Environment Reports Associated Stressors Point Source Comparison of survey results to known impaired waters Non-point Source Dose Likelihood Response Criteria Standards 303(d) List Diagnosis Integrated Monitoring and Assessment Equivalent Accept State 303(d) list (Category 4/5 of IR impaired waters) Waterbody has high probability of impairment (Category 4 or 5 should be considered) Inconsistent Apply Predictive Models to assess probability of impairment Waterbody has moderate probability of impairment Waterbody has low probability of impairment (Category 3) Category 1 or 2 of IR TMDL Development Remediation Targeted Monitoring Waterbody impairment confirmed Waterbody not impaired Continue to monitor as part of 5 -year cycle for random survey

Stream Miles Impaired in Maryland 8800 stream miles in MD MD 66% 1 st order and 17% 2 nd order 7304 miles in 1 st and 2 nd order streams 3725 miles of 1 st and 2 nd order streams should be on 303(d) List based on benthic impairment

States conduct Probability Survey with common suite of indicators Describe condition, with known confidence State 305(b) Reports (Intro to Integrated Report) National 305(b), State of the Environment Reports Associated Stressors Point Source Comparison of survey results to known impaired waters Non-point Source Dose Likelihood Response Criteria Standards 303(d) List Diagnosis Integrated Monitoring and Assessment Equivalent Accept State 303(d) list (Category 4/5 of IR impaired waters) Waterbody has high probability of impairment (Category 4 or 5 should be considered) Inconsistent Apply Predictive Models to assess probability of impairment Waterbody has moderate probability of impairment Waterbody has low probability of impairment (Category 3) Category 1 or 2 of IR TMDL Development Remediation Targeted Monitoring Waterbody impairment confirmed Waterbody not impaired Continue to monitor as part of 5 -year cycle for random survey

Probability of Impairment Models Combine condition information with land cover data to predict probability of impairment Agriculture on >3% Slopes Spatial Models for Probability of Impairment Data to Drive Modeling

Probabilistic Monitoring Approaches Can Get You Close – Faster and Cheaper But to Get Here, You Still Need Targeted Sampling!

EMAP • Nationally consistent approach for monitoring streams and estuaries is available • Statistical detection of changes and trends in ecological condition is possible • Developing the science needed for implementing an integrated monitoring approach
- Slides: 24