EOI Review Cells Cell Transport PSCR Cell Cycle


![Cell Transport • Diffusion- movement of molecule from an area of [H] -> [L]](https://slidetodoc.com/presentation_image_h/2c6f7479c7006143a75a4a9cd6c4907f/image-14.jpg "Cell Transport • Diffusion- movement of molecule from an area of [H] -> [L]")
![Cell Transport • Osmosis- movement of H 2 O from an area of [H]](https://slidetodoc.com/presentation_image_h/2c6f7479c7006143a75a4a9cd6c4907f/image-15.jpg "Cell Transport • Osmosis- movement of H 2 O from an area of [H]")


![Cell Transport • Facilitated Diffusion- movement of larger molecules from [H] -> [L] –](https://slidetodoc.com/presentation_image_h/2c6f7479c7006143a75a4a9cd6c4907f/image-19.jpg "Cell Transport • Facilitated Diffusion- movement of larger molecules from [H] -> [L] –")


")


 indicates for the presence of CO 2 – BTB")


")


")

 –")
 combining together")


 is dominant")


?")


 • reflex: involuntary and nearly")


- Slides: 180
EOI Review Cells Cell Transport PS-CR Cell Cycle DNA Genetics Classification Evolution Behavior Ecology
• Prokaryotes: – No nucleus – No membrane bound organelles – Has DNA – Example: bacteria Cells • Eukaryotes: – have a nucleus – have membrane-bound organelles (mitochondria & chloroplast). – Examples: plants & animals.
Cells
Cells Organelle Nucleus Cell membrane Cell wall Cytoplasm Ribosome Mitochondria Chloroplast Lysosome Vacuole Function Controls all activity in the cell Controls what goes into and out of the cell (selectively permeable) Structure and support (plants only) Surrounding around all organelles Makes proteins *powerhouse of cell* Site of Cellular respiration- converts food (chemical energy) into usable energy (ATP) Site of Photosynthesis- converts light energy into chemical energy (glucose- C 6 H 12 O 6) Breaks down worn out cell parts and wastes Stores water & wastes Analogy Brain Security guard Brick wall, police Air Factory Power plant Solar panels Garbage disposal Trash can
• Organism Organization Levels – Organ systems • Organs – Tissue » Cell » The basic unit of life – • Cell (can be broken down further) – Organelles • Molecules – Atoms
7
2. The eukaryotic organism described above should be classified as — A. an animal B. a plant C. a bacterium D. a fungus 8
7. 3 9
9. 4 10
5 A B C D 11
6 12
7 13
Cell Transport • Diffusion- movement of molecule from an area of [H] -> [L] – passive transport: no energy required – Can be liquid or gas
Cell Transport • Osmosis- movement of H 2 O from an area of [H] -> [L] – passive transport: no energy required – water
Cell Transport • Hypertonic – Hyper= more – More solute in the solution than in the cell – Water leaves cell – Cell will shrink
Cell Transport • Hypotonic Solution – Hypo= less – Less solute in the solution than in the cell – Water moves into the cell – Cell could burst
Cell Transport • Isotonic Solution – Iso= same – Equal solute in the solution than in the cell – Water moves into the cell and out of cell equally – Cell is at equilibrium
Cell Transport • Facilitated Diffusion- movement of larger molecules from [H] -> [L] – passive transport: no energy required
Cell Transport • Active transport: is the movement of molecules across a cell membrane in the direction against their concentration gradient, [L] -> [H] – requires ATP (energy) – Modifies protein (changes shape)
8 21
9 22
10 A B C D 23
11 24
Use the information to answer questions 4 -6. A biology student wants to study how animal cells react when places in distilled water and in a salt solution. The student used the following procedure: 1) Place a small sample of cells on a microscope slide and place a cover slip over the sample. Add a few drops of distilled water under the cover slip. 2) Observe the cells in the distilled water solution under a microscope. 3) Place a small sample of cells on a microscope slide and place a cover slip over the sample. Add a few drops of 20% salt solution under the cover slip. 4) Observe the cells in the salt solution under a microscope. 12. What is the dependent variable in this experiment? A the salt concentration B the number of cells in the sample C the type of animal that the cells come from D the movement of water across the cell membrane 25
A B C D 13 26
14 27
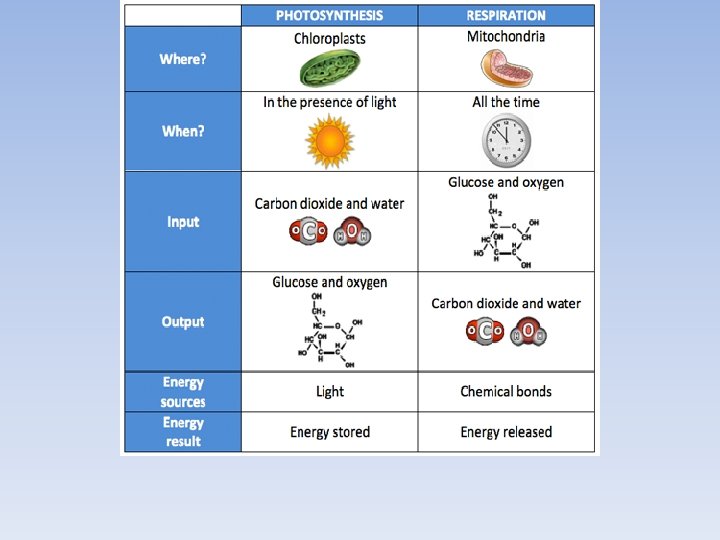
Photosynthesis • What is it? A cell process that converts light energy into chemical energy (glucose) • Who uses it? Plants only • Location – Chloroplast • Purpose - Make glucose that can be used in cellular respiration • Gas Produced - Oxygen • Equation – 6 CO 2 + 6 H 2 O + sunlight C 6 H 12 O 6 + 6 O 2
Cellular Respiration • What is it? A cell process that converts chemical energy (glucose) into ATP • Who uses it? Plants and Animals • Location – Mitochondria • Purpose – Make ATP to use in daily cell functions • Gas Produced – Carbon Dioxide • Equation – C 6 H 12 O 6 + 6 O 2 6 CO 2 +6 H 2 O + ATP
ATP • ATP- energy used in the cell; energy is release when the bond between phosphate groups is broken Adenosine Triphosphate • Energy is stored between the second and third phosphates
PS-CR
PS-CR • Bromothymol Blue (BTB) indicates for the presence of CO 2 – BTB turns yellow in the presence of CO 2 – BTB stays blue in the presence of O 2 – BTB will turn green if there is both CO 2 & O 2
1 34
2 35
3 36
4. Which method should a scientist use to view the site of photosynthesis in a plant cell? A use a magnifying glass to view the chloroplasts B use a magnifying glass to view the mitochondria C use a microscope to view the chloroplasts D use a microscope to view the mitochondria 37
5. A scientist wants to measure how much gas is released by a plant to estimate how fast it is photosynthesizing. Which measurement should the scientist take? A meters of carbon dioxide B milliliters of oxygen C grams of carbon dioxide D centimeters of oxygen 38
A horticulturist hypothesized that if he increases the level of carbon dioxide (CO 2) in the air of his greenhouses, then his plants will absorb carbon more quickly. He collected the following data from an experiment performed on is plants. 6 Which statement is true about the data in the table? A. The data supports the hypothesis because the plants grew more when the level of CO 2 increased. B. The data supports the hypothesis because the plants grew less when the level of CO 2 increased. C. The data contradicts the hypothesis because plants grew less when the level of CO 2 increased. D. The data contradicts the hypothesis because the plants grew more when the level of CO 2 increased.
7 A B C D 40
8 41
9 42
10 43
11. Elodea, a freshwater plant, releases gas bubbles when it is placed in direct light. In an investigation, a student placed a lamp at different distances from an aquarium containing Elodea. The student counted the number of bubbles produced by the Elodea plant. His data are shown in the table below. The bubbles released by Elodea contain mostly A. Oxygen B. Carbon dioxide C. Nitrogen D. Water vapor 44
12
13 A B C D
Cell Cycle • process in a cell leading to its division and duplication (replication) that produces two daughter cells – M phase- period of cell division – G 1 phase- growth of cell – S phase- replication of chromosomes (DNA) – G 2 - preparation for mitosis – (Interphase is G 1, S & G 2 combined)
• Cell division Mitosis – Used for growth , development & repair (asexual reproduction) – Produces 2 daughter cells that are genetically identical – Chromosome numbers are diploid (2 n) – Somatic cells (body cells)
• Cell division Meiosis – Used to create sex cells (sexual reproduction) – Produces 4 daughter cells that are genetically different (genetic variation) – Crossing over – Chromosome numbers are haploid (n) – Gamete cells (sperm & egg)
Fertilization • Fertilization is a process of two gametes (haploid sex cells) combining together and making a zygote (diploid somatic cell). The zygote will go through the process of mitosis and development into a baby. The individual will go through meiosis in their sex organ creating gametes.
1 51
2 52
3 A B C D 53
4 54
5
6
7. Some chemicals help stop a certain disease during cell growth. The diagram shows where in the cell cycle these chemicals affect the disease. Based on the diagram, most of the chemicals affect cells during A. Mitosis B. DNA replication C. The growth stage D. The preparation for division
8 A B C D
9. In the western red lily, Lilium philadelphicum, mitosis produces 24 chromosomes in each daughter cell. How many chromosomes does meiosis produce in each gamete cell of the western red lily? A. 6 B. 12 C. 24 D. 48
10
• Deoxyribonucleic Acid DNA – Double stranded – Contains all genetic info • Blueprint for whole body – In the nucleus – Made up a nucleotide • Sugar: Deoxyribose • Phosphate group • Nitrogen Bases– – Adenine Thymine Cytosine Guanine
Replication • Making a copy of DNA The complementary DNA to the following to TTG-GCA would be AAC-CGT.
• Ribonucleic Acid RNA – Single stranded – Just needed info – Made up a nucleotide • Sugar: Ribose • Phosphate group • Nitrogen Bases– – Adenine Uracil Cytosine Guanine
Transcription • DNA m. RNA – rewriting DNA is too large and wide to leave nucleus so a copy is made of just the section needed (m. RNA) The matching m. RNA strand for the following DNA strand TAT-CGA would be AUA-GCU.
Translation • m. RNA amino acid • Protein Synthesis - On ribosomes in cytoplasm • The protein design (code) comes from the DNA • DNA is too large and wide to leave nucleus so a copy is made (m. RNA)
Protein Synthesis • DNA is like the “whole instruction manual”. • RNA is like “one chapter” in the instruction manual.
Protein Synthesis The order of a protein is determined by the m. RNA sequence. Each codon in the sequence corresponds to a specific amino acid. Codon: 3 RNA = 1 amino acid
Mutations • changes in DNA sequence. • caused by mutagens: radiation, chemicals or infectious agents. • can also occur during replication, transcription or meiosis. • benefit mutations are called adaptations. • If occur in somatic cells (body cells) will not affect potential offspring. • If occur in gamete cells (sex cells) can be passed on to offspring.
Mutations • Point mutation – nitrogen base in DNA sequence replaced with another. – This usually does not affect the protein being made. • Frame shift mutations – nitrogen base is either inserted into or deleted from the DNA sequence. – This usually affects the protein being made.
11 70
12 71
13 The diagram below shows models of nucleic acids. A segment of each model is highlighted. 72
14. Based on the model, which feature is a characteristic of DNA replication? A. The molecule makes chromatin fibers. B. The molecule is in the form of a triple helix. C. Sequence mutations occur in all DNA strands. D. Complementary bases pair together to form new DNA. 73
15. Which of the following would be produced if a messenger RNA strand is coded from the DNA sequence CCCGGAATT? A. CCCGGAAUU B. GGGCCTTAA C. AAATTCCGG D. GGGCCUUAA 74
16. Which amino acid sequence can be coded from the DNA sequence CAG TAG CGA? A. B. C. D. Valine – Isoleucine – Glycine Valine – Aspartic Acid – Alanine Valine – Isoleucine – Alanine Valine – Phenylalanine – Alanine 75
17 76
Genetics Alleles – different forms of the same gene Example: Some alleles for the eye color gene are • B – Brown eyes • b – blue eyes
Traits • Dominant Trait – Written as a capital letter to show that it is overpowering • Recessive Trait – Written as a lowercase letter to show that it can be covered up
• Genotype – The actual allele combination – Example: • AA, Aa, or aa • Phenotype – The physical appearance which expresses the genetic trait. – Example: – brown eyes or blue eyes
• Homozygous – When the two alleles are the same – BB or bb • Heterozygous – When the two alleles are different – Bb
Punnett Squares • Predict possible genotypes of offspring – A= red color – a= blue color • AA x aa • 100% of offspring will have a genotype of Aa which will express as a red phenotype
Karyotypes • Determines the genes of an individual. • Able to identify genetic disorders • Trisomy – 3 chromosomes instead of 2
Pedigree • Tool to look at the passing of certain genetic traits on to offspring based of generations
DNA fingerprint • Electrophoresis • technique used to identify a person’s individual DNA • used in paternity testing and criminal investigation
DNA fingerprint • Can also be used to determine how closely related two organisms are
Determining Pedigree type • Autosomal- Traits on • Sex-linked- trait is passed on somatic passed on the X cell chromosome
Incomplete Dominance • Neither trait wants to be dominates over the other • Phenotypes are blended • Red x White = Pink
Co-dominance • Both traits want to dominant • Both phenotypes are expressed • Red x Blue = Red & Blue
Blood types • Follows the law of dominance and codominance • • Type A= IAIA or IAi Type B = IBIB or Ibi Type AB = = IAIB Type O= ii
1 A B C D 90
91
3 92
4. In a certain group of lab mice black fur is dominant and brown fur is recessive. If two heterozygous mice mate and produce 16 offspring, how many of the offspring will probably have brown fur? A. 0 B. 4 C. 8 D. 12 93
5. Robert is conducting breeding experiments with mice. He crossed two brown mice and found that 25% of their offspring were white. Which conclusion from this experiment is most logical? A. White color is dominant over brown color B. One of the parent mice is homozygous for the dominant allele C. All of the offspring carry two copies of the recessive allele D. The white offspring are homozygous for the recessive allele 94
6. This diagram shows a pedigree for a recessive genetic disorder. 95
7. 96
8. In a species of fly, the allele for red eyes (R) is dominant to the allele for brown eyes (r). Red eye color in the flies is not sex-linked. Students crossed male and female flies that had red eyes and recorded the eye color of their offspring. Their data are shown below. Using the data in the table, what is the approximate ratio of red-eyed offspring to brown-eyed offspring? A. 1: 1 B. 2: 1 C. 3: 1 D. 4: 1
9
10
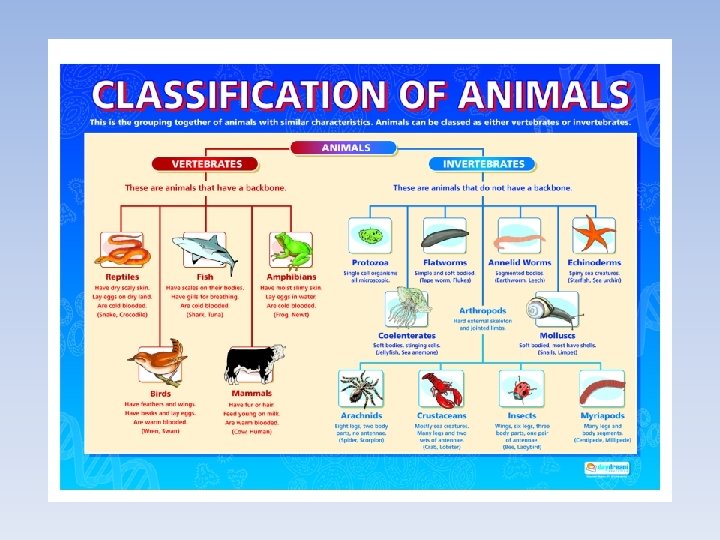
Classification • groups of organisms on the basis of shared characteristics and giving names to those groups Broad- includes many individuals Specific- very small amount of individuals
Classification • Cladogram- shows relationship between organisms
Classification • Dichotomous Key- used to identify unknown individuals based on specific characteristics
1 105
2 Which organism in the table is most similar to a tiger (Panthera tigris)? A. Coyote B. Grey wolf C. Blue whale D. Lion
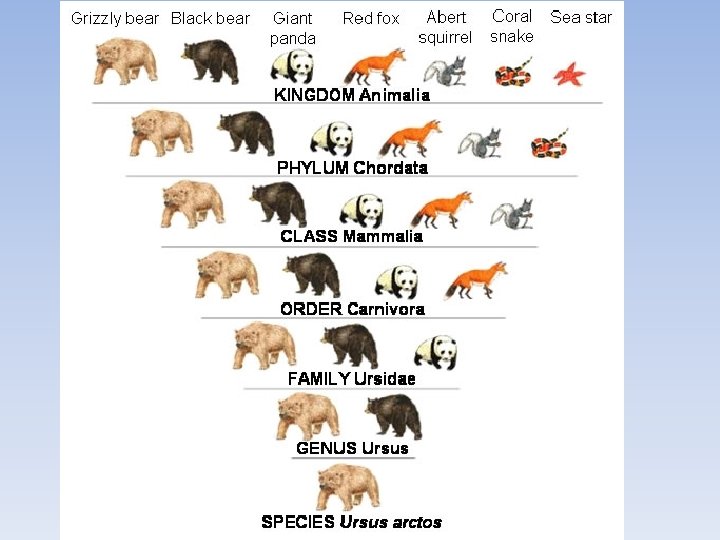
3. The Linnean classification system places organisms in groups based on how closely they are related. The kingdom is the classification level containing organisms that are most distantly related while the species level contains organisms that are most closely related. The Linnean classification of the largemouth bass is shown below. Classification of Largemouth Bass Kingdom Animalia Phylum Chordata Class Actinopterygii Order Perciformes Family Centrarchidae Genus Micropterus Species salmoides Which of these levels of classification contains organisms that are more distantly related than those in the order of Perciformes? A. Actinopterygii B. Micropterus C. Centrarchidae D. salmoides
4. Which of the following lists the levels of cell organization from least to most complex? A. Organs, cells, organ systems, tissues B. Cells, tissues, organ systems C. Tissues, organ systems, cells D. Cells, organ systems, tissues
Evolution • Adaptation- a mutation that benefits an individual to survive a certain environment • Examples – Blending in with surroundings – Different beak structures depending on food source
Evolution • Adaptations must happen in the DNA- cannot development because of a need • Instead those that have the adaption survive passing on the trait to their offspirng Wrong Natural Selection
Evolution • Natural Selection- organisms better suited to a particular environment survive and produce more offspring than those organisms less fit. – Green beetles more visible. More are eaten – Brown beetle more suited for environment- reproduce more.
Evidences of Evolution • Fossil records – see bones of organism once living that are similar to those living today • Embryology – see similarities in developing embryos
Evidences of Evolution • Homologous Structures – have the same structure but not necessary the same function • DNA analysis – Best indicator for determining are closely related two individuals are.
5. A B C D 114
6 115
7 116
8 117
9 118
10 119
11 A B C D 120
Behavior • Plant behaviors- – Phototropism: the growth of a plant toward light. Can be positive (towards sun) or negative (away from sun); – Gravitropism: plant growth in response to gravity. Roots grow down into the soil to anchor.
Behavior • Animal behaviors– Innate: behavior born with (hard-wiring) • reflex: involuntary and nearly instantaneous movement in response to a stimulus (knee jerking when hit at doctors appt) • instinct: performed without being based upon prior experience (sea turtles returning to sea) • courtship: performed by male and female before mating (mating dance, flashing patterns, songs/calls) • migration: seasonal movement of animals (birds/butterfly) • hibernation/estivation: reduced metabolism during cold/hot periods (bears/frogs)
Behavior • Animal behaviors– Learned: behavior that has been modified based on experience; • Imprinting: forms a social attachment to another object (hatchlings imprint to mother) • Trial and error: It is characterized by repeated, varied attempts which are continued until success (nest building, riding a bike) • Conditioning: learning by association (Pavlov’s dog) • Insight: learning which animals use previous experiences to respond to new situations (problem solving)
12 124
13. Joshua is studying the mating behavior of hanging flies. Female hanging flies typically require their male mates to bring them a gift, such as a moth to eat. Joshua raised a group of female and male hanging fly larvae in isolation from adult hanging flies. When these larvae became adults, the females also required a gift from their mates. Which explanation is the best for this behavior? A the behavior is acquired randomly B the behavior is learned through imprinting C the behavior is learned through experience D the behavior is inherited through genes 125
14 126
15 127
16 128
Ecology • Interactions of organisms and their environment
Species • Individuals that are able to reproduce and produce fertile offspring
Variation with a species • Niche – a role a species plays in an area – What type of food the organism eats, where it lives, how it interacts with other species.
Environmental Factors • Abiotic Factors- nonliving factors in the environment (sunlight, soil, water, temperature, oxygen, CO 2, nitrogen • Biotic Factora- living factors in the environment (Humans, Animals, dead things, trees)
Symbiosis • The relationship between two different species living closely together – Predation (one benefitsone dies) – Mutualism (both benefit) – Parasitism (one benefits- one is harmed) – Commensalism (one benefits- other unaffected)
Predation One organism hunts and feeds on another organism
Mutualism both species benefit from the relationship Clownfish live within sea anemones, which normally sting other fish. The fish gets protection, and the anemone benefits because the clownfish keep it clean of bacteria.
Parasitism one organism gains benefits at the other’s expense Leech sucks the blood of a human
Commensalism one species benefits and the other is not hurt nor helped Epiphytes are plants that grow on other plants without harming them. They never set root in the ground!
Biogeochemical Cycles • Water cycle • Carbon cycle • Nitrogen cycle
Water Cycle
Water Cycle Processes • Evaporation – Water entering into the atmosphere • Precipitation – Water falling from the atmosphere • Condensation – Change from water vapor to liquid which usually forms clouds or fog • Transpiration – Change from liquid to water vapor usually in plants for movement of water from roots to leaves.
Carbon Cycle
Carbon Cycle Processes • Photosynthesis – Takes in carbon as carbon dioxide – Releases carbon as glucose • Cellular Respiration – Releases carbon as carbon dioxide • Burning of Fossil Fuels – Releases carbon as carbon dioxide • Decomposition – Releases carbon as carbon dioxide
Nitrogen Cycle
Nitrogen Cycle Processes • Ammonification – decomposers releasing nitrogen to the soil • Nitrification – Bacteria changing ammonia into nitrates • Denitrification – releasing nitrogen to the atmosphere from nitrates in the soil • Nitrogen-fixation – plants taking nitrogen directly from the atmosphere and making ammonia
Autotrophs vs Heterotrophs • HETEROTROPHS • AUTOTROPHS • AKA consumers • Two types: • 1. Photoautotrophs use • Organisms that eat other consumers. sunlight to convert energy into glucose • 2. Chemoautotrophs use the compounds around them to survive. • AKA producers
Diet Types • Herbivores – organisms that only eat producers, plants or autotrophs. • Carnivores – organisms that eat other consumers • Omnivores – organisms that eat both plants and animals
Food Chain • Simple passage way of energy and nutrients in an ecosystem
Food Web • Food web - interconnected food chain to show species are related in an ecosystem
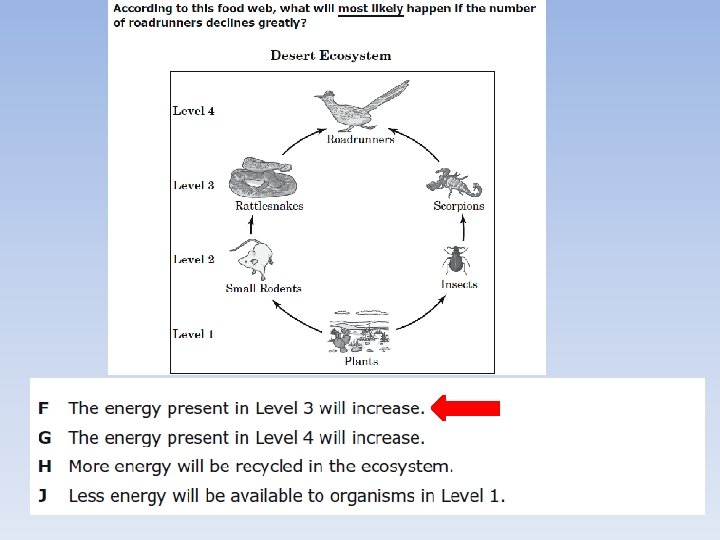
Ecological Pyramids • Energy Pyramid: the producers are at the bottom with the total amount of sun energy captured. • Each trophic level that the energy flows into only receives 10% of the energy from the previous level. • The other 90% is lost as heat
Pyramid of Numbers • Population decreases at each level
Pyramid of Biomass • Biomass – amount of living matter
• Natality – Birth rate of organisms in an area • Mortality – death rate of organims in an area
• Immigration – movement of individuals into an area • Emigration – movement of individuals out of an area
• Biomass – the amount of living matter in an area • Population Density – the number of individuals in an area
• Carrying Capacity – The maximum number of species in an area • Limiting Factors – The factor that restricts the growth of an organism • Ex: water, food, space
156
157
An experiment is designed to clear an oak-hickory forest and replant the area with pines. Which of the following species would be most threatened by this experiment? 1. Cardinal 2. Hooded warbler 3. Field sparrow 4. Summer tanager 158
26. 159
160
This graph shows the sizes of lynx and hare populations between the years of 1845 and 1940. If a predator of the lynx enters the food chain, you might expect the number of — 1. lynx and hares to become equal 2. lynx to increase 3. hares to increase 4. hares and lynx to decrease 161
162
163
164
In the graph below, what is the population of deer at the carrying capacity of the environment? 1. 30 2. 10 3. 50 4. 70 165
This graph suggests that from 1840 to 1920, the carrying capacity for sheep in Tasmania was approximately — 1. 0. 75 million 2. 1. 00 million 3. 1. 75 million 4. 2. 25 million 166
167
168
169
170
171
A mushroom and a humpback whale are alike because both are — 1. motile 2. prokaryotic 3. unicellular 4. heterotrophic 172
53. 174
175
37. 176
177
178
54. 179
180