Envision Jun Wang Abhishek Agrawal Anil Bazaz Supriya

Envision Jun Wang Abhishek Agrawal Anil Bazaz Supriya Angle

Problems q Based on old Java version of Envision q Connect it to MARIAN backend q Show me the overview!! q Show me the insight of data!!!

Show Me the Overview Blank Screen Panics User!! Where is my data? ?
")
Trade-off Overview + Detail Focus + Context -Large Overview - Small Overview (Remove Scrollbar) (Context) - Showing icons inside cluster - - Showing detail in result window - Maintaining Link Relations Zooming

Hammer / Chainsaw a t a D Screen Data Screen

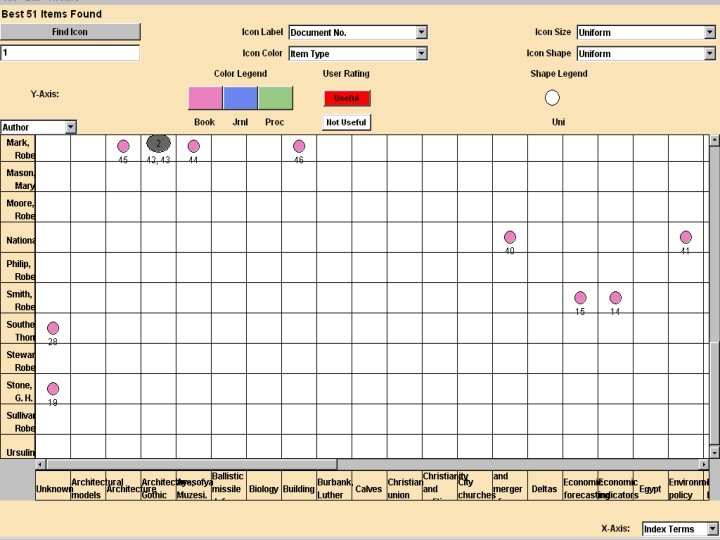
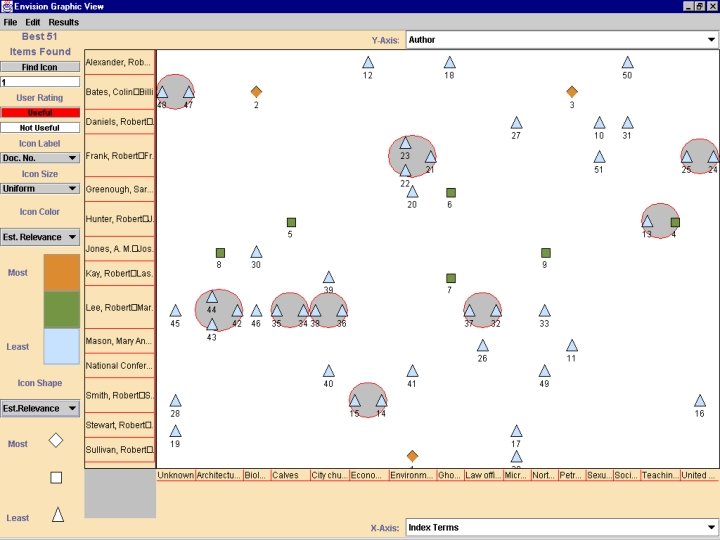
Show me the DATA !!! Cluster “indicating” 34 document Cluster “SHOWING” 34 documents

Showing Icons in Cluster ®A nice algorithm has been developed to provide the function we need…. ® Scales pretty well… a small icon can contain 100+ documents inside… ® This number can be even raised. ® Each icon has its own attributes: color, shape, document, selection, everything.

Show Icon Algorithm 11 layers, 433 small icons can be drawn inside an ellipse of radius (191, 188). 3 layers, 51 icons inside (80, 50)

Variable-Width Algorithm ® To use screen space more efficiently ® Final algorithm decides width, based on how many documents are inside the largest icon in certain column/row ® Icon areas are proportional to the number of documents ® All boundary conditions are carefully considered

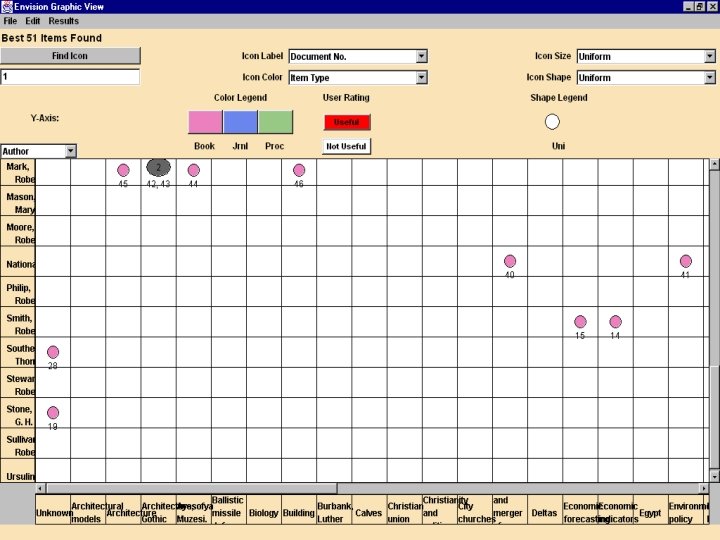
Table on Axis Several attribute values Aggregate single value How can we present this information beautifully to facilitate user? ® Table with tooltip over cells ® Plain Text vs. Combobox

Remove Grid Line ® Real “people” don’t like grid on the matrix… ® Remove them totally from our way!!

Work Is NEVER Ending…

Future Work ® Connect to multiple backend servers. - Z 39. 50 protocol, OAI protocol & other general protocols… ® When scale is too high, zooming is necessary. Then we need context too to guide users. ® Mouse hover icon to show icon details. ® Interface is not well refined.

Questions? Suggestions?
- Slides: 17