Environmental Sampling Plan Development Joan B Rose rosejomsu

Environmental Sampling Plan Development Joan B. Rose rosejo@msu. edu

The QMRA Framework
 • Emergency or")
What are the Environmental Monitoring Goals? • Compliance monitoring (Drinking Water) • Emergency or biohazard assessment • Identify sources of pollution • Exposure assessment • Evaluation of treatment technology • Specific assessments: eg Impact of climate and extreme precipitation on water quality
 • Bioaersol sampling plans")
Presentation Frameworks for establishing monitoring plans (Locations, Methods and Response) • Bioaersol sampling plans • Water quality sampling plans • Case study using microbial source tracking • Predictive microbiology • Evaluation of treatment technology

Bio. Watch Program

Bio. Watch Program Model Framework: Sampling, Analysis and Control Goal: Bioterrorist agents, Air Dispersion < 36 hrs

Background ØRising concerns • Terrorists could aerosolize biological agents in the air • Potentially causing thousands of causalities • Without early detection, the magnitude of the problem might only be revealed as people arrived at hospitals with symptoms ØEarly-warning system • Department of Homeland Security • Tested at the winter Olympic, Salt Lake City in 2002 • Bio. Watcat Program in 2003
 • Environmental Protection Agency (EPA)")
Agencies & Responsibilities • Department of Homeland Security (DHS) • Environmental Protection Agency (EPA) • Center for Disease Control and Prevention (CDC) • Department of Energy (DOE) • Department of Defense (DOD) DHS Funding, Oversight, Coordination DOE and DOD Site selection, Sampler unit, Tech support EPA Field coordination, Site maintenance, Sampling operation CDC Sample analysis & data management, Consequence management strategy

Sampling Locations & Methods • Outdoor • Pre-existing EPA air quality station • Manually collect samples 24 -hr intervals, 7 days/week, 365 days/year • Potable sampling unit (PSU) • Dry filter unit (DFU) • Distributed sampling unit • Deliver samples daily to CDC-operated facilities • Indoor (enhancing & developing the protocols) • Suggested methods • HEPA socks? • Swabs for areas where water pools? • Swipes for surfaces, e. g. computer screens, air intake vents?

Analysis & Responses • CDC-operated Bio. Watch facility • Federal, State, or local public health laboratories • Primary analysis • Polymerase chain reaction (PCR) • If a biological agent is detected, perform 2 ndary test • Secondary analysis • PCR-verified positive • existence of a biological material in the air due to either an intentional or a natural • Notification by local level with health authorities • Low enforcement by Federal Bureau Investigation (FBI)
")
Evaluations of the Program • EPA concerns • Quality assurance and quality control (QAQC) • Protocols and response systems

WATER QUALITY FRAMEWORKS Exposure Estimation Water Quality Data E. coli; Enterococci & coliphage levels Hazard Identification Sewage and Microbial Source Tracking Fecal Loading Prevention & Treatment Environmental Strategies Survival Transport : Runoff Surface Water/ Ground Water Concentrations Parasite testing Virus testing Risk Estimation Dose Response

CLEAN WATER ACT in the US governs ambient waters including recreational and impaired waters. • Fishable/ Swimmable • Biological/chemical/Physical Integrity • NPDES Discharge permitting system (wastewater and stormwater) • BEACH ACT • Total Maximum Daily Load (TMDL) • Concentrated Animal Feeding Operations (CAFO) • Water Quality Protection Plans

Environmental Sampling: Source Tracking Water quality and muck at Saginaw Bay Parks and Beaches, Huron Co. – August 2007 �Problem: evaluating health impacts of muck for beach-goers �Understand if human sewage was impacting the area �Samples: Muck (6), shallow water (6) �Toolbox: fecal indicators (E. coli, enterococci, C. perfringens, coliphage) and MST markers (human and bovine Bacteroides markers and Enterococcus Surface Protein (esp), human adenovirus)

The toolbox approach • Combining multiple MST methods improves the quality of data for a specific waterbody or watershed • By targeting more than one host specific marker, the strength of association can increase e. g. multiple host-specific markers for multiple organisms for each water sample tested • This is complemented by representative sampling of the waterbody, environmental surveys, spatial investigations (GIS), statistical analyses • Extend to nutrient and non-water testing (e. g. sediment, sand, algae mats)
")
Water & non-water testing Photograph courtesy of Marc P. Verhougstraete (MSU)
 Port")
Sampling locations in Saginaw Bay Bird Creek Co. Park (M 1, W 1) Port Crescent State Park – Day use (M 5, W 5) Sleeper State Park (M 6, W 6) Caseville Co. Park (M 2, W 2) Oak Beach Co. Park (M 3, W 3) Port Crescent State Park – Camping area (M 4, W 4)
 Bacteroides (bovine) Adenovirus (copies/L)")
MST results for Saginaw Bay sites Sample ID esp (human) Bacteroides (bovine) Adenovirus (copies/L) W 1 + + - <22. 39 W 2 + - - <71. 43 W 3 + - - <32. 29 W 4 - + - 99. 05 W 5 - - + <29. 18 W 6 + - - <29. 18 M 1 + + - NT M 2 + - - NT M 3 + - - NT M 4 - - - NT M 5 - - + NT M 6 + - - NT NT: Not tested for adenovirus

Needs Microbial source. Research tracking tools research needs USEPA has considered it as one of the top priorities Ø Conduct microbial fate and transport studies Ø Determine relationships between traditional and new fecal indicators, and priority pathogens in treated effluents and in downstream recreational waters to compare and validate their applicability for specific criteria uses. Ø Understand the concentrations of these host specific Bacteroides markers are in different sources of fecal contamination Ø Address fate during waste treatment processes.

B. thetaiotaomicron Geometric mean 5. 1 log CE 100 ml-1 • Secondary treatment effluent: 4. 2 log CE 100 ml-1 (Srinivasan et al. 2011) All samples above detection limit (2. 9 log copies 100 ml-1) Correlations • Septic system count (r = 0. 634, p < 0. 001) • River discharge (r = 0. 346, p = 0. 005) Verghougstraete et al. 2011 B. Thetaiotaomicron log concentration 100 ml-1

Related to diffuse sources at low flow Address State Sanitary Program To Correct Septic Tank Pollution in MI Verghougstraete et al. 2011

Predictive Risk Assessment Through EXPOSURE ASSESSMENT, MODELING & QMRA Silver Beach EPA studies on Lake Michigan Beaches; showed increase risk of gastrointeritis. Washington Park Sewage sources identified as part of the land use impacts. Virus monitoring Undertaken. Wong et al. 2008 Water Research

Adenoviruses by q. PCR

• Modeling Virus appearance

Example: Recreational Predictive Risk Tool Washington Park Beach, Michigan City, IN Silver Beach, St. Joseph, MI ^ ^ 24 October 2021 Courtesy of maps. google. com 25

Example: Recreational Predictive Risk Tool Wong et al 2008. Evaluation of public health risks at recreational beaches in Lake Michigan via detection of enteric viruses and a human-specific bacteriological marker. Water Res. 43 (2009) 1137– 1149. Transport Model Environmental Variables • W = Wind Speed • k = Wind Direction Code • P 24= 24 Hour Precipitation • T= Water Temperature • I = Solar Insolation • N = Number of Swimmers* • τ = Turbidity* *Variables That Require User Inputs 24 October 2021 26
 = 1 – exp(-k ∙")
Example: Recreational Predictive Risk Tool dose = C∙Vi P(risk) = 1 – exp(-k ∙ dose) 24 October 2021 27

Opening Page Screen Internet Update Initiated by This Button

Internet Results Are Filled in to Each Variable

User Input Stage User Inputs are Added Here User Touches this Button to Advance to the Risk Analysis

Risk Analysis Transport Model Pathogen Concentration Results dose = C ∙ Vi Risk Assessment

Example: Recreational Predictive Risk Tool 32

Toledo Pathogen Study In response to a request by the United States EPA, the City of Toledo is comparing pathogen removal efficiencies during extreme wet weather conditions at a Toledo wastewater treatment plant. The rapid treatment process was designed to accommodate the increase in volume during these wet weather events.

Samples AS A 1 AS A 2 AS A 3 AS B 1 AS B 2 AS B 3 Conventional Biological Treatment AS A Influent AS B Effluent Densadeg Chemical Treatment HRC A Densadeg Influent HRC B Densadeg Effluent HRC A 1 HRC A 2 HRC A 3 HRC B 1 HRC B 2 HRC B 3 AS C 1 AS C HRC C 1 AS C 2 Disinfected Effluent Disinfected Densadeg Effluent HRC C 2 AS C 3 HRC C 3
 Method EPA Method 600/4 -84013 (N 14);")
Analytes Parameter Adenoviruses Number of Samples 6(composite) Method EPA Method 600/4 -84013 (N 14); cell culture, q. PCR Campylobacter 18 Centrifugation, Enrichment, Isolation, PCR Coliphage: somatic and F+ specific 18 EPA Method 1602 Enterococcus 18 ASTM D 6503 -99 (2005) Enterolert method Salmonella 6 (composite) EPA Method 1682 Cryptosporidium and Giardia 6 (composite) EPA Method 1623
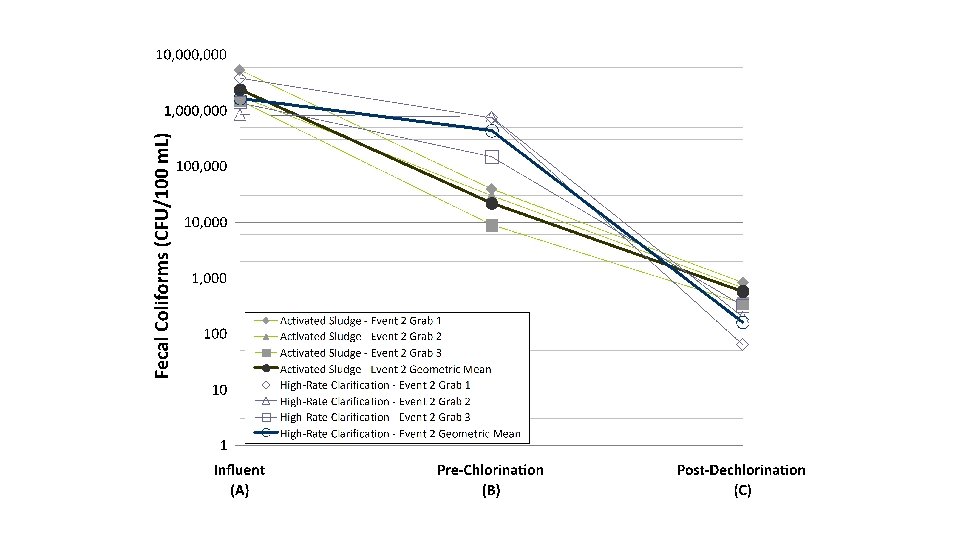
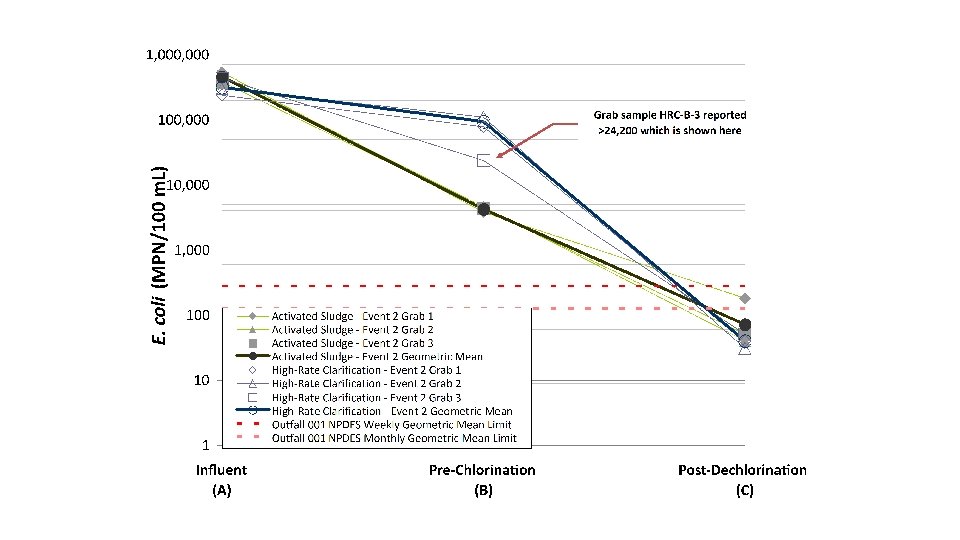
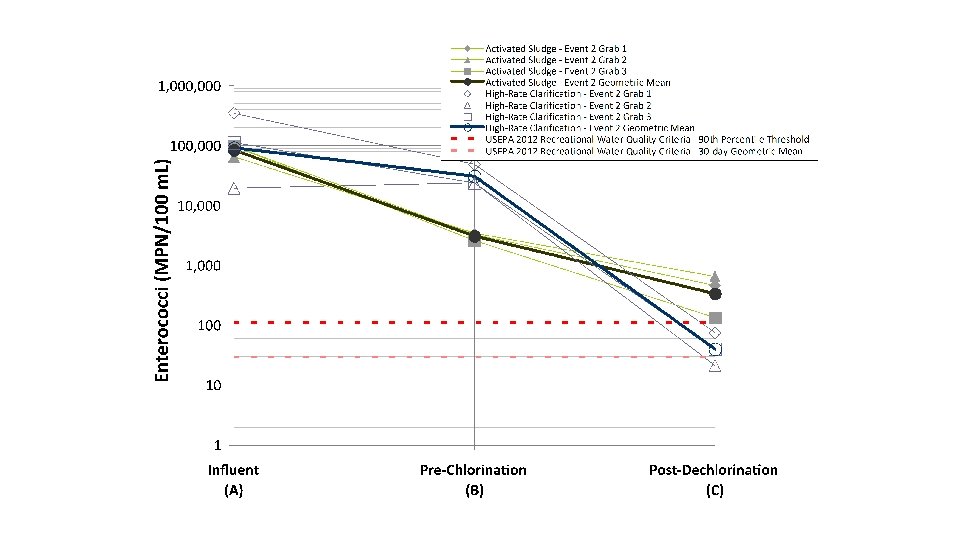
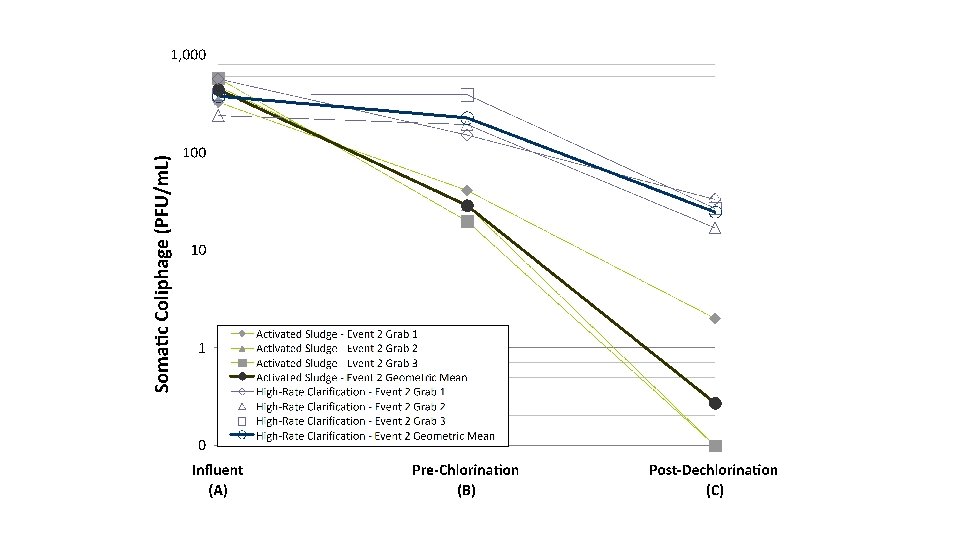
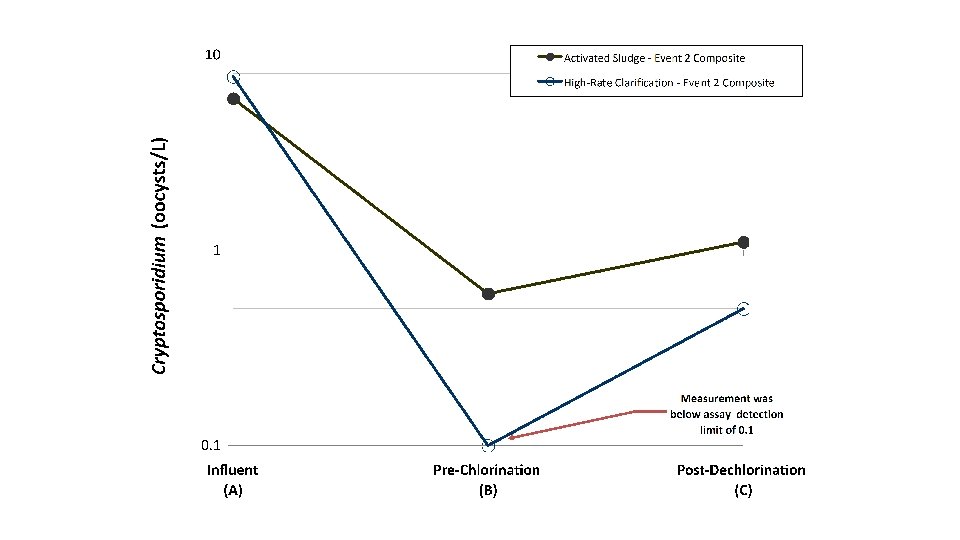
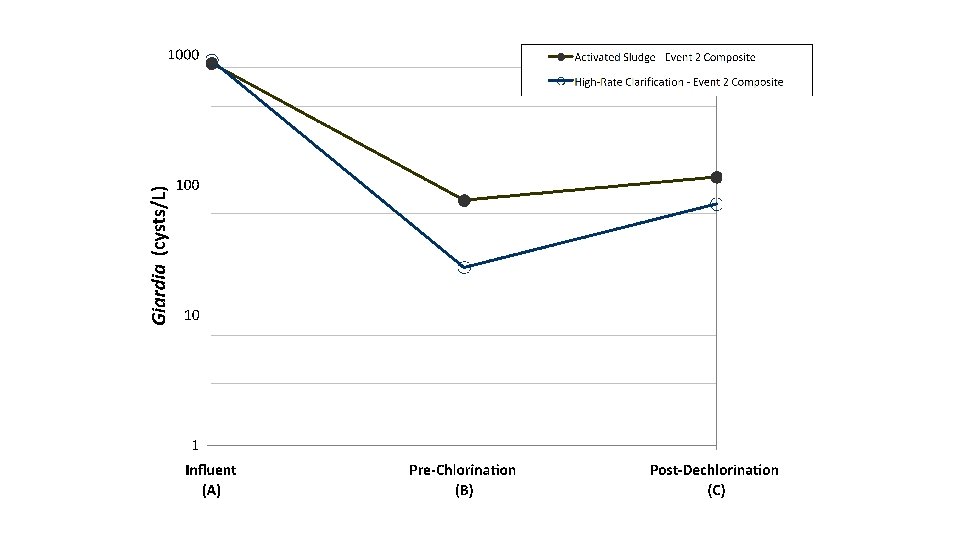
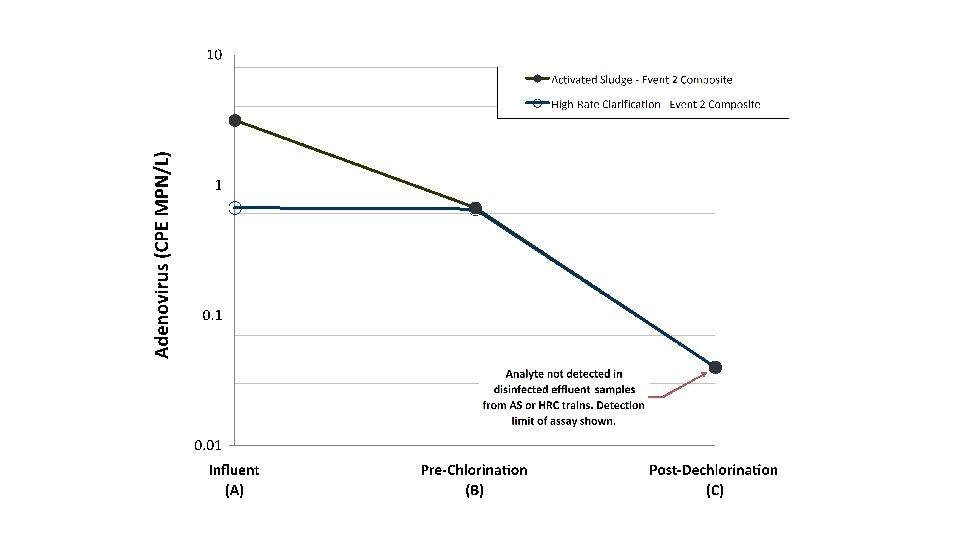

Analyte Lower concentration value in effluent Higher Logarithm 10 reduction Conventional Treatment HRC Treatment Somatic phage (PFU per ml) X X Male-specific phage (PFU per ml) X X HRC Treatment Enterococci (MPN per 100 ml) X X Campylobacter (MPN per 100 ml) X X Salmonella (MPN per 100 ml) Cryptosporidium (oocysts per L) ≈ ≈ Giardia (cysts per L) Total cultivable virus q. PCR Confirmed Adenovirus ≈ X X X ≈ ≈ X X

Toledo Pathogen Study The rapid treatment process provided equivalent removal Compared to the conventional treatment during these wet weather events.

Environmental Sampling is directed at Public Health Assessment and Protection. The study of fecal contamination of water and the spread of disease to humans due to recreational and drinking water contamination. Study the microbes Study their occurrence in water Study their survival Study their transport Study outbreaks Study their control

www. camra. msu. edu THANK YOU 46
- Slides: 46