Environmental Results Program Measurement Update NEWMOA Board of

Environmental Results Program Measurement Update NEWMOA Board of Directors’ Meeting June 7, 2007

ISSUES FOR REGULATORS • How do you effectively and efficiently regulate large groups of facilities or activities with limited resources? • How do you know that your compliance assurance efforts (permits, inspections, compliance assistance, enforcement, etc. ) are yielding environmental performance improvements?

ERP LINKS Traditional tools: - Regulations - Inspections Tool 2: Selfcertification 2 a. Sector standards 2 b. Applicability statements 2 c. Self-certification forms 2 d. Return to compliance plans Tool 1: Compliance Assistance 1 a. Compliance assistance workbooks 1 b. Compliance assistance workshops MA DEP Environmental Results Program Tool 3: Perf. Measurement 3 a. Environmental Business Practice Indicators 3 b. Statistical analysis 3 c. Use of outcomes to target actions 3 d. Reporting Results

ERP MEASUREMENT METHODOLOGY • • Identify Universe EBPI’s Baseline and Year 1 Random Inspections Score – Industry-wide – Indicator-specific – Facility-specific • Statistics

EBPI’s for ERP Printers Regulatory Indicators: * Are the fountain solutions used on offset web-fed lithographic presses alcohol-free? (air) * Printer meeting 2 ppm or hauling? (water) * Is the facility in compliance with quantity and time limits for HW storage? (waste) Beyond Compliance Indicators: * Does printer have a sign prohibiting discharge of process chemicals over sinks in work areas? (P 2) * Does printer recycle aluminum printing plates? (P 2)

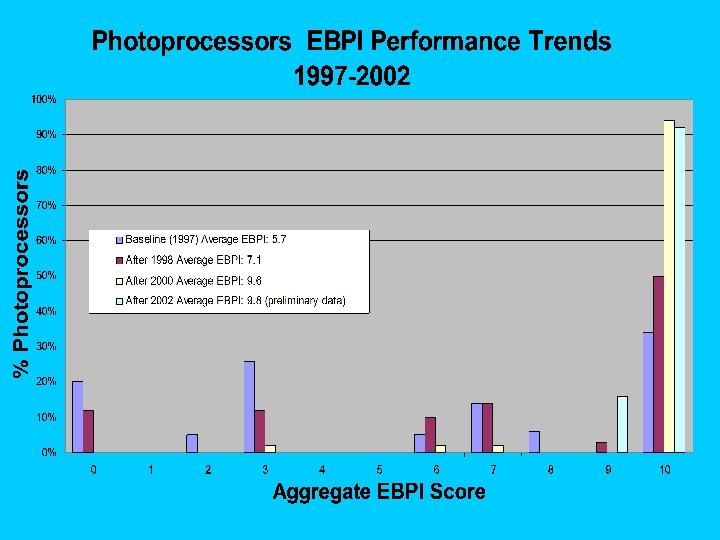
Percentage of Printers PRINTER’S PARTNERSHIP Aggregate EBPI Analysis Aggregate EBPI Score

EBPI PERFORMANCE RESULTS EBPI: Facility Has Emergency Procedures in Place Performance for dry cleaners increased from 25% at baseline in 1997 to 80% in 1998. Apply this change to the entire universe: 358 more facilities with emergency procedures in place. EBPI: Containers in Good Cond. & Kept Closed Performance decreased by 3% from baseline (or roughly 20 more dry cleaners have inadequate container management). EBPI: Meeting 2 ppm Silver Discharge Performance increased from 60% at baseline to 98% in 1998. MA DEP can account for 98% of all silver generated from photoprocessors in Massachusetts.

Select Environmental Outcomes • Question: “Are you in compliance with the press cleanup solution requirement? ” Results: Performance increased from 77% at baseline in 1998 to 85% in 1999. Apply this to entire universe, this is equivalent to 4. 0 tons VOC reduction • Question: “Is leak detection performed weekly, following workbook protocol and using proper leak detection equipment? ” Result: Performance increased from 33% at baseline in 1997 to 66% in 2000. Based on avg. perc use per facility, applied to entire universe, this is equivalent to 22. 5 ton reduction of perc emissions.

Dry Cleaner Accuracy Analysis Self-Certifications vs. Inspections 76% 4% 1% 1997

Common Measures Project Overview Project States: CA, CO, CT, ME, MA, NH, NJ, NY, RI, VT What is the future vision of this project? • The use of ERP-type performance measurement is used broadly and routinely to make environmental program priority and resource allocation decisions. • The use of ERP-type measurement is used to look within and beyond Massachusetts to identify and adopt the most effective and efficient environmental performance improvement strategies for the groups we are responsible for regulating (or influencing).

PROJECT OUTCOMES • States have selected two groups to measure: SQGs and Auto Body • Sates have developed a set of common environmental performance indicators for SQGs (auto body indicators under development) • States will collect and report data on those indicators (CO, CT, ME, MA, NH, NY, RI, VT) • An environmental performance index score will be established in each state for each group (comparisons of individual indicators also) • The compliance assurance and performance enhancement strategies will be reported and compared to the index scores

What States Learn Under the Project • How to make choices about groups, – e. g. , single medium vs. multi-media, existing vs. new sector, known universe, common definitions, problem sector • How to identify data quality issues, – e. g. , bias, precision, sensitivity, representativeness, new data versus old data • How to select indicators – e. g. , regulatory, beyond compliance (P 2), outcome based • How to select an effective sample size, – e. g. , minimum number of inspections per universe size within an agreed upon confidence level • How to collect data, – e. g. , inspectors asking and answering questions the same way • How to use statistics to interpret and report data results

ERP Results Analyzer Demonstration on how to pick an effective sample size based on: – Different confidence levels – Margin of error – Population size ERP Results Analyzer can be found at EPA’s website http: //www. epa. gov/erp/roadmap/matllist. htm

Anticipated Project Results • Illuminate the nature, scope and seriousness of problems within each selected group • Quantify environmental performance in the selected groups • Create baseline to allow measurement of group environmental performance changes over time • Facilitate general comparisons of the effectiveness and efficiency of different state compliance assurance strategies within the same group • Enable states to better focus their limited resources on specific problem areas to achieve the greatest environmental results.

At the Conclusion of the Project, What Next? • Will we continue to use ERP-type measurement across our collective states? • Should we evaluate the same groups (SQGs and Auto body) at a point in the future to measure change across the states over time? • Will we measure other groups beyond SQGs and Auto body? • Will individual states adopt this approach to benchmark performance of various groups within their own state?
 556 -1120")
For More Information on ERP Contact: Steve De. Gabriele, MA DEP (617) 556 -1120 or steven. degabriele@state. ma. us, Tara Acker, NEWMOA (413) 296 -4005 or taraacker@gmail. com, Or Visit the Common Measures Website: http: //www. newmoa. org/hazardouswaste/measures/
- Slides: 17