
Environmental Monitoring Ivan Greti Konstantin Ilijevi Jovana Orli

- Slides: 40
Environmental Monitoring Ivan Gržetić, Konstantin Ilijević, Jovana Orlić
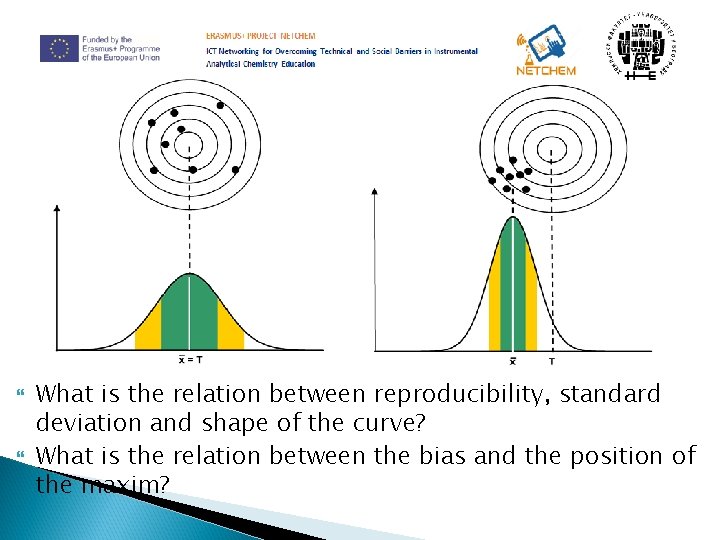
Reproducibility
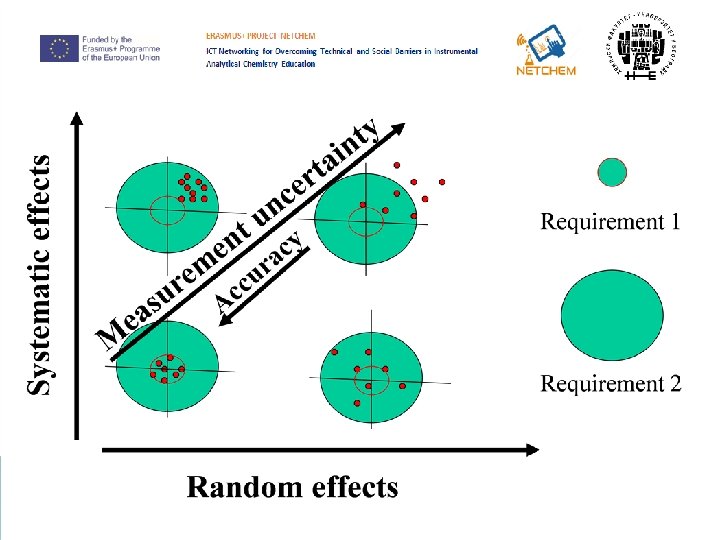
How can you divide the effects affecting the errors of your analysis?
Bias (system error)?
The bias exists when the results always tend to be greater or less than the reference value.
What are the sources of bias? What are the sources of random error? Can they be totally eliminated? How are random errors distributed? What is the normal distribution?
What are reproducibility and reproducibility? What is the difference?
What is the relation between reproducibility, standard deviation and shape of the curve? What is the relation between the bias and the position of the maxim?
Deviations (random and systemic) from the reference value of the analytical result can be tracked at different levels: Repeatability - a random effect occurring between repeated determinations in a short period of time; Non-homogeneity of the sample is one of the important factors that affect repeatability Variations during different days - a combination of random and systematic effects, dependent among other factors and the effects of weather Laboratory bias - systemic effect (for each individual laboratory) Method bias - a systematic effect dependent on the method used
Quality requirement What is too high and what is a low quality? Who defines the correct quality? Laboratory responsibilities in terms of assessment and statement of the required quality?
How would you convince a potential user of your laboratory services that the quality of your analysis is: 1. At a high level of accuracy; 2. Constant for a long period of time; 3. How can you check if a system error develops over time in your analysis?
What are the control charts What can they show? for?
X-control charts How will you draw control charts? What limits will they possess? How and on what basis do you define these limits?
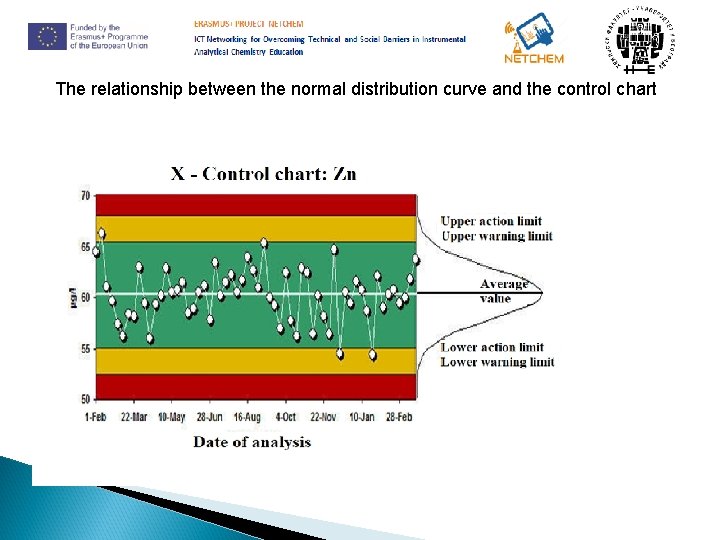
The central line (CL) is the arithmetic mean of the control values or the certified value; Warning limits(CL ± 2 s) Action limits(CL ± 3 s). With normal distribution: 95% results ie. 99. 7% of the result Target control limits and statistical control limits.
The control limits / X-charts Statistical control limits The control limits have been adjusted based on the analytical characteristics of the control sample. For a longer period, for example, the year, the standard deviation, s, is calculated from the control values. The warning limits will be +2 s and -2 s Target control limits The control limits have been set according to the requirement for analytical quality.
The relationship between the normal distribution curve and the control chart
• • • Towards the end of the analytical series, the control values are plotted on the control chart It is recommended that, when reporting control values: Give one significant digit more than the usual routine analysis; Report values below the limit of quantification (LOQ); Report negative values.
Control samples: Certified reference materials – matrix CRM Reference materials, standard solutions or laboratory materials Samples of the blank Test (everyday, routine) samples
Types of X-cards: With analyte concetrations; Control charts of blanks (CL is 0 or arithmetic mean); Recovery control charts (CL 100%).
Can you create X-charts for control samples that are not stable? How would you control hydrogen sulphide analysis?
Range control chart (R ili r%) The primary purpose of the range control charts relates to the control of repeatability range - the difference between the highest and the lowest individual result for two or more divided samples r% - control vaule displayed as the relative range
Control limits/ R-charts Statistical control limits The arithmetic mean of the range is calculated from the data obtained over a longer period of time. For repeat (n = 2) = the value of the arithmetic mean of the range / 1, 128. The cental line is the arithmetic mean of the range. Upper warning limit will be +2, 83 s Upper action limit will be+3, 69 s s
Daily interpretation of quality control Record all information that may be relevant to the interpretation of the control data. What information could this be?
Method is under contorl If the control value is within the warning limit. If the control value is between the warning limits and the action limits, but under the condition that in the previous two determinations the control value was within the warning limit.
How would you know that the method is not under control?
Method is under control, but of statistical control Seven consecutive control values have a gradual tendency of growth or decline; 10 out of 11 consecutive control values lie on the same side of the central line; Maximum one of the last three control values can be between the alert limits and the action limits.
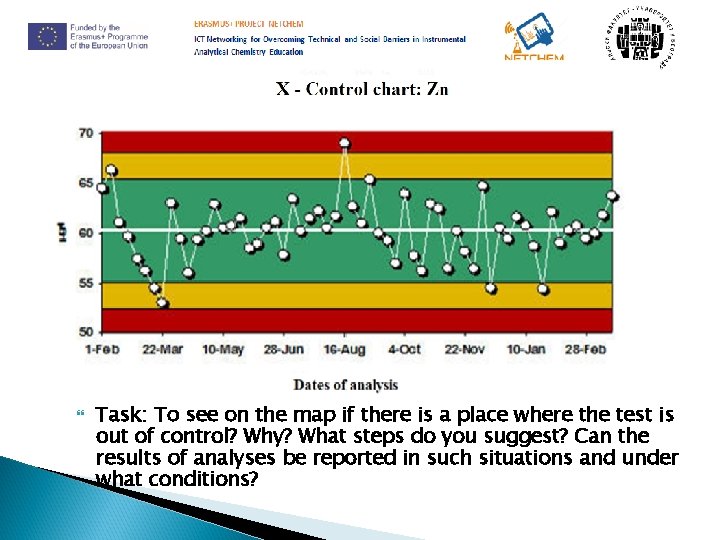
Method is out of control If the control value is beyond the action limit; If the control value is between the warning limits and the action limits, and that one of the two preceding two measured values was also between the warning limit and the action limits - the principle: two of the three values.
Do a few more (at least two), control analyses. If the control values are obtained in this way within the warning limits, routine samples are allowed to be reanalysed. Correction steps? all analyses made after the last acceptable control value must be repeated.
Task: To see on the map if there is a place where the test is out of control? Why? What steps do you suggest? Can the results of analyses be reported in such situations and under what conditions?
According to the request for analytical results, the analyst makes a control program: Type of control samples; Type of control charts; Control limits– warning and action limits; Frequency of control.
The preliminary control limits and the central line can be estimated based on about 25 control values. Fixed control limits and central line - one year period, ie at least 60 control values.
Long-term evaluation of quality control data After what time will you evaluate the control charts? What values should be evaluated?
How many points do you expect beyond the warning limit? What will you do if you have more value beyond the warning limits than the expected number, and what if you have less?
Recommended once a year, a review of the last 60 data on the control chart must have a minimum of 20 new points since the last evaluation. Count cases where results are beyond warning limits. If this number is greater than 6, or less than 1, (based on an analysis of 60 data) there has been a change in the distribution of analytical results.
Compare the arithmetic mean of the last 60 results with the previous arithmetic mean. If the difference between these two values is greater than 0. 35 s, the arithmetic mean value has changed. During analysis of the limits and CL it is advisable to exclude all data exceeding the 4 standard deviation value from the central line.
Reference Internal Quality Con. TROLL, Handbook for chemical laboratories, 4 th Edition, Nordtest Report TR 569, 2012 Miller, J. N. , & Miller, J. C. (2005). Statistics and chemometrics for analytical chemistry. Harlow, England: Pearson/Prentice Hall.
This project has been funded with support from the European Commission. This publication reflects the views only of the authors and the Commission cannot be held responsible for any use which may be made of the information contained therein.
Author, Editor and Referee References This remote access laboratory was created thanks to work done primarily at University of Belgrade. Contributors to this material were: Ivan Gržetić, Konstantin Ilijević, Jovana Orlić Date of creation: July, 2018. Refereeing of this material was done by: __________ Editing into NETCHEM Format and onto NETCHEM platform was completed by: __________
References and Supplemental Material The NETCHEM platform was established at the University of Nis in 2016 -2019 through the Erasmus Programme. Please contact a NETCHEM representatives at your institution or visit our website for an expanded contact list. The work included had been led by the NETCHEM staff at your institution.