ENVIRONMENTAL GOODS Evaluation of the APEC EGs initiative
 initiative: A Dominant Supplier Approach GEORGE MANZANO")


 – Predominant supplier approach due to Wonnacott")
 in each good is computed as the share")

 in 54 APEC EGs, by EG Category")

 in 2013,")
 in")


- Slides: 14
ENVIRONMENTAL GOODS Evaluation of the APEC (EGs) initiative: A Dominant Supplier Approach GEORGE MANZANO AND SHANTI AUBREN PRADO University of Asia and the Pacific (UA&P) 13 th National Convention on Statistics Oct 3, 2016, EDSA Shangri-la Hotel
introduction Trade policies as a useful tool in EGs • • Lack of capacity of developing countries to produce Reducing trade barriers facilitate access and costeffective adoption of EGS.
APEC is reducing 5% or less on a list of 54 environmental goods by 2015.
Purpose: To provide concrete inputs to the review of the APEC EGs list. Objective of the study: To identify what is the optimal mix of environmental goods to liberalize for APEC as a whole and for individual member-economies.
Issues to consider: 1. Free-rider problem (APEC-level) – Predominant supplier approach due to Wonnacott [1994] 2. Significance of trade in APEC EGs (national level) – Analysis of comparative advantage and potential gains from liberalization for each individual membereconomy
Indicator: The APEC Supply Predominance (ASP) in each good is computed as the share of APEC exports in world exports of the good excluding intra. EU trade: Higher ASP indicates less free riding.
Distribution of 54 APEC EGs, by 2013 APEC Supply Predominance
2013 APEC Supply Predominance (%) in 54 APEC EGs, by EG Category
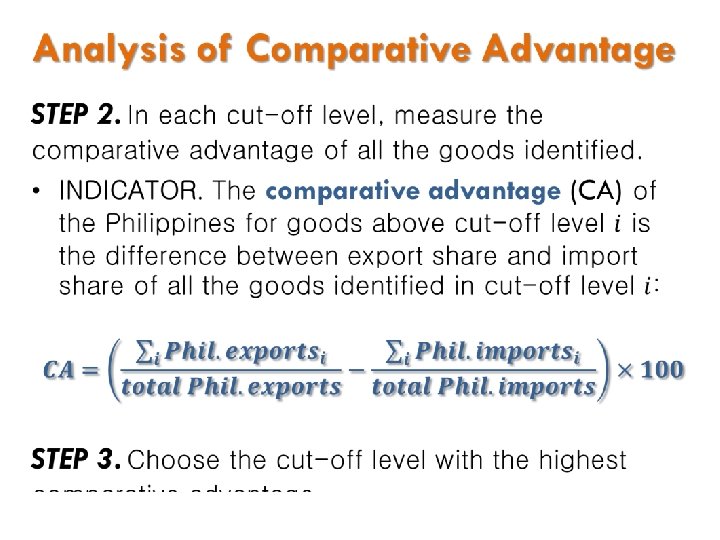
Analysis of Comparative Advantage STEP 1. Cluster the goods according to various cut-off levels of APEC Supply Predominance. • The higher the cut-off level, the less no. of Cut-off 25% 30% 35% 40% 45% 50% 55% 60% 65% 70% 75% 80% 85% 90% goods No. of 54 APEC EGs 52 51 48 42 35 21 16 12 9 6 6 4 3
Comparative advantage of APEC in 54 APEC EGs APEC trade shares (%) in 2013, by cut-off level 16 APEC EGs: 0. 31% CA (2. 16 % of exports and 1. 86 % of
Comparative advantage of the Philippines in 54 APEC EGs APEC trade shares (%) in 2013, by cut-off level 16 APEC EGs: 2. 32% CA (3. 61% of exports and 1. 29 % of
Findings: Which goods to liberalize? 1. 16 APEC EGs for which APEC supplies 60% of world exports 2. 15 APEC EGs under renewable energy and clean technology production
Thanks!