Environmental Engineering Water Pollution Outline Water pollution categories


 Physical Characteristics Suspended solid – measured in mg/L Sources: (i)")

 Sources:")

 Inorganic compounds such as minerals, metals,")
 Effect from")

 Chemical Characteristics Note: Total Dissolved Solid (TDS) Recommended TDS Sources:")
 Alkalinity Definition: the quantity of ions in water to neutralize acid")

 Hardness Definition: a measure of “multivalent” cations in water such as")

 Metals – non toxic and toxic Non Toxic • Dangerous for")
 Metals – non toxic and toxic Note: For Domestic Water Supply")


- Slides: 34
Environmental Engineering Water Pollution
Outline Water pollution categories Causes of water pollution Measurement of water pollution
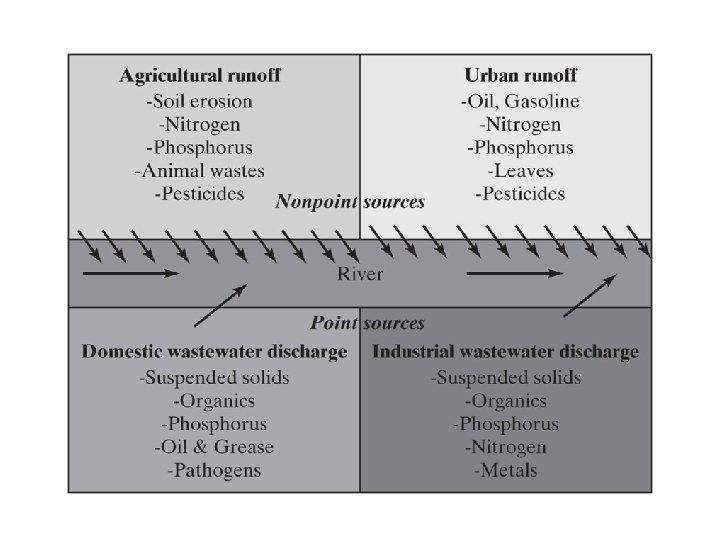
Water pollution categories Sources of surface water pollution are generally grouped into two categories based on their origin. Point source pollution is a single identifiable localized source of air, water, thermal, noise or light pollution. The sources are called point sources because in mathematical modelling, they can be approximated as a mathematical point to simplify analysis. Pollution point sources are identical to other physics, engineering, optics and chemistry point sources.
Water pollution categories Non-point source pollution refers to diffuse contamination that does not originate from a single discrete source. NPS pollution is often accumulative effect of small amounts of contaminants gathered from a large area. NPS Examples such as: discharges from vehicle emissions, construction site, Urban Runoff, forestry etc.
Causes of water pollution The specific contaminants leading to pollution in water include chemicals, pathogens, and physical or sensory changes such as elevated temperature and discoloration. Three main sources causing water pollution are: - Pathogens - Thermal pollution
Causes of water pollution • Pathogens • The most important biological organisms in water are pathogen • These organisms are capable of infecting and transmitting diseases to human • Pathogens are not native to aquatic system and usually require an animal host for growth and reproduction. • Major groups of pathogens of interest in water supply and treatment are bacteria, viruses, protozoa, fungus and algae.
Causes of water pollution • Pathogen Indicator • The presence of pathogenic microorganisms is shown by indicator organisms. • Their presence shows that pollution has occurred and suggests the nature, type and level of pollution. • • Indicator micro-organisms properties; Ø Ø Can be used for all type of waters, Always present when pathogen is absent, Easily experimented and give reliable results, Not be a pathogen itself
Causes of water pollution Thermal pollution is the rise or fall in the temperature of a natural body of water caused by human influence. A common cause of thermal pollution is the use of water as a coolant by power plants and industrial manufacturers.
Causes of water pollution Thermal pollution can also be caused by the release of very cold water from the base of reservoirs into warmer rivers. Elevated water temperatures decreases oxygen levels (which can kill fish).
Water Quality • Water quality is a neutral term that relates to the composition of water as affected by natural processes and human activities. • The quality of water also is related to its specific use, and usually measured in terms of the concentration of its constituents. • Water quality measurements include chemical, and biological parameters. physical,
Water Quality Parameters • Physical Parameters • Chemical Parameters
Water Quality • Physical Parameters • Physical parameters define those characteristics of water that respond to the sense of sight, touch, taste, or smell. • The six most commonly considered physical characteristics are suspended solid, temperature, taste and odour, colour
Water Quality • a) Physical Characteristics Suspended solid – measured in mg/L Sources: (i) Inorganic compounds such as clay, silt, sand (ii) Organic compounds such as fine organic matter, human waste Effect: (i) Aesthetic (affect turbidity and transparency of water (ii) Health aspect (iii) Adsorption point/centre for chemicals and microorganisms
Water Quality
Water Quality b. Turbidity – measured in NTU/FTU (nephelometric / Formazin turbidity units) Sources: (i) Inorganic compounds such as clay, sand (ii) Organic compounds such as plant fiber, human waste Effect: (i) Aesthetic (ii) Health aspect (iii) Adsorption point/centre for chemicals and microorganisms
Water Quality Turbidity – measured in NTU/FTU
Water Quality c. Odour and Taste Sources: (i) Inorganic compounds such as minerals, metals, salts (all of them give taste to water but no odour) (ii) Organic compounds from petroleum and/or degradation of organic matters (odour and taste) Effect: (i) Aesthetic (ii) Health problem
Water Quality d. Temperature – measured in ˚C or ˚F Sources: (i) Effect from ambience (ii) Industrial activities such as cooling system Effect: (i) Disturb biological activities such as microorganism and aquatic life (ii) Chemical properties such as the degree of gas solubility, density and viscosity
Water Quality • Chemical Parameters • The chemical characteristics of water are numerous. • Every substance that dissolves in water can be called a chemical water quality characteristic. • Chemical parameters are includes total dissolved solid, alkalinity, hardness, metals, organic compounds, and nutrients.
Water Quality • a) Chemical Characteristics Note: Total Dissolved Solid (TDS) Recommended TDS Sources: concentration for drinking water supply is (i) Inorganic compounds such 500 mg/L minerals, metal and gases (ii) Organic compounds such as product from degradation of organic matter or organic gas Effect: (i) cause taste, colour and odour problem (ii) Health aspect (iii) small amount of TDS – water become corrosive
Water Quality b) Alkalinity Definition: the quantity of ions in water to neutralize acid or measure of water strength to neutralize acid - Main constituents are bicarbonate (HCO 3 - ), carbonate (CO 32 - ) and hydroxide (OH- ) ions. Sources: (i) Mineral dissolved in water and air (ii) Human activities such as fertilizers, detergent, pesticide etc. Effect: (i) Non pleasant taste (ii) Reaction between alkaline constituent and cation (positive ion) produces precipitation in pipe.
Water Quality Fertilizer Agriculture pesticide
Water Quality c) Hardness Definition: a measure of “multivalent” cations in water such as Ca 2+, Mg 2+, Fe 2+, Mn 3+ Note: Sources: (i) Natural mineral on earth Recommended Iron concentration in Water Supply is 0. 3 mg/L Desirable concentration of Mn in Drinking water is 0. 01 – 0. 05 mg/L Effect: (i) Excessive soap usage (ii) Precipitate form on hardware (iii) Precipitate in pipe – temperature and p. H increased
Water Quality Effects on water supply Iron deposit on valve pipe
Water Quality d) Metals – non toxic and toxic Non Toxic • Dangerous for health if the concentration is high • Example: Ca 2+, Mn 2+, Fe 2+, Zn 2+, Al 3+, + etc. Source: (i) Mineral, readily available from nature Effect: (i) Colour, odour, taste and turbidity (ii) Deteriorate health (at high concentration)
Water Quality d) Metals – non toxic and toxic Note: For Domestic Water Supply Metals level should be: Toxic Pb < 0. 05 mg/L • Stored up in food chain Hg < 0. 02 mg/L Cd < 0. 01 mg/L • Example: Pb 2+, Hg 2+, Cd 2+ etc. Source: (i) Human activities such as mining and industries Effect: (i) Dangerous diseases such as cancer, abortion and deformation in new born baby
Environmental Engineering Water Use and Population Forecasting
WATER DEMAND Factors Affecting Water Use Many factors affect the amount and timing of water use: population size and character: climate; the types of water uses in the region; the cost of water; public commitment to environmental protection and restoration; public attitude toward conservation and wastewater reuse; water management practices; federal, state, local government laws and ordinances; and tourism. Population. The amount of water used in a locality is directly related to the size, distribution, and composition of the local population. Forecasts of future water use depend, in part, on population forecasts as well. Climate. The amount of water used in a locality is influenced by its climate. Lawn irrigation, gardening, bathing, irrigation, cooling, and many other water uses are directly affected.
WATER DEMAND Types of Water Uses. The type and scale of residential, commercial, industrial, and agricultural development in an area define the levels and timing of water uses. Economic Conditions. Economic health is reflected in all aspects of resource management and development. Inflation and other economic trends influence the availability of funds for water supply, wastewater treatment, and environmental and other programs, and they affect the attitudes of individuals as well. Environmental Protection. Social attitudes toward environmental protection and enhancement strongly affect water allocation and use. Water use forecasts must take into account the amount of water that is to be dedicated to environmental protection and restoration. This quantity can be substantial.
WATER DEMAND Conservation. Attractive alternatives to developing new water supplies are conservation practices and the reuse of wastewater and storm water. These approaches, although not a panacea, can at least delay the need for additional water supplies and/or the development of new facilities. Management Practices. water management practices, including interbasin transfers, saline water conversion, water reclamation and reuse, and many other practices influence water use trends. The impact of technological change on water use can be significant. Tourism. Some states, have annual tourist populations that significantly exceed their resident populations. The impacts of such occurrences must be recognized when forecasting future water demands.
WATER DEMAND Example 1 A reservoir has a capacity of 340 x 103 hectare meter. How many years would this supply a city of 100, 000 ? Assume a use rate of 680 Lpcd. Solution
WATER DEMAND Example 2 If the minimum flow of a stream having a 51, 800 hectares watershed is 0. 38 m 3/d. hectare what population could be supplied continuously from the stream? the water use rate is 662 Lpcd. Solution
WATER DEMAND Example 3 The population of a state was 7 million in 2000. Consider that by 2015, it is expected to increase to 9 million. Consider that the amount of freshwater withdrawn in 2000 was 9. 5 x 10⁹ LPd. Estimate the amount of freshwater that might be withdrawal in 2015. Assume 15% reduction in per capita use Solution