Entrainment and nonuniform transport of finesediment in coarsebedded

Entrainment and non-uniform transport of fine-sediment in coarse-bedded rivers Paul E. Grams & Peter R. Wilcock, Johns Hopkins University Stephen M. Wiele, US Geological Survey

Acknowledgements • USGS – Grand Canyon Monitoring and Research Center • National Center for Earth-Surface Dynamics • University of Minnesota – St Anthony Falls Laboratory

Fine sediment transport in rivers with coarse bed material

Sand entrainment from a coarse bed: Two aspects of the problem 1. What happens to entrainment as the sand-bed elevation drops?

Sand entrainment – coarse bed

Sand entrainment – coarse bed

Sand entrainment – coarse bed

Sand entrainment – coarse bed

Sand entrainment from a coarse bed: Two aspects of the problem 1. What happens to entrainment as the sand-bed elevation drops? 2. What is the effect of spatial variability in bed condition?

Outline • Framework of the entrainment formulation • Describe main channel experiments • Bed condition and simplified model to represent bed condition • Non-uniform routing model • Comparison between predicted and observed bed
 entrainment relation for mixed-size sediment")
Garcia and Parker (1991) entrainment relation for mixed-size sediment

Sand elevation correction function = sand elevation correction function = observed dimensionless entrainment rate = dimensionless entrainment rate for a full sand bed (i. e. Garcia and Parker model)

Sand elevation correction function = sand elevation correction function = observed dimensionless entrainment rate = dimensionless entrainment rate for a full sand bed (i. e. Garcia and Parker model)

Experiments in main channel at SAFL Non-uniform transport to test coupled sand entrainment and sand routing model. • • • 2. 74 x 84 m flume (40 m test section) 60 cm flow depth Bed roughness: D = 15 cm Feed sediment grain size: ~ 0. 13 mm 5 experimental runs (2 -11 hr duration)

Experiments in main channel at SAFL Non-uniform transport to test coupled sand entrainment and sand routing model. • • Constant Q: 29 l/s Qs: 2. 3 tons/hr for 90 min. Initial bed: bare (no fine sediment) Four segments – – 1: 90 min. sediment feed 2: 60 min. 3: 145 min. 4: 365 min. • 662 min. (11 hr) cumulative run time

Experiments in main channel at SAFL Non-uniform transport to test coupled sand entrainment and sand routing model. • Bed topography: measured at the end of each run segment, and sampled for grain size • Suspended sediment concentration: Three siphon rakes positioned across channel, analyzed for concentration and grain size

Main channel bed 91 min. 152 min. 297 min. 2. 7 m 662 min. 40 m

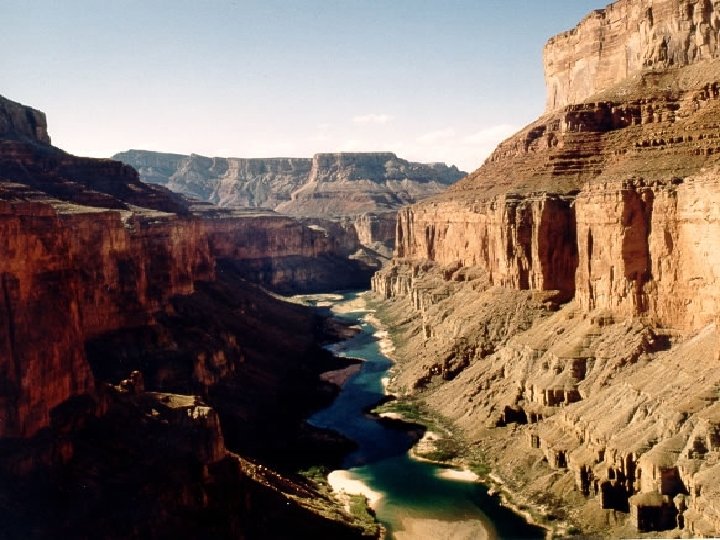
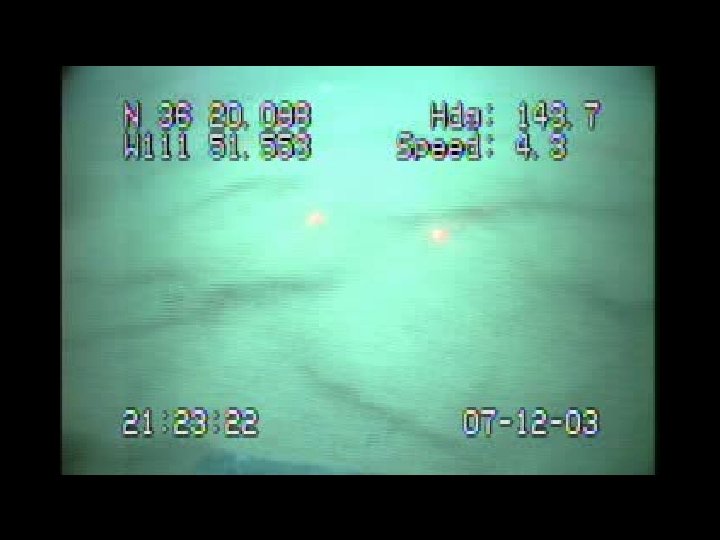
Bed of Colorado River in Grand Canyon

Bimodal bed – Stripe or Bare bare stripe

Distribution of sand bed elevations and storage Orange = n for indicated depth Blue = volume at indicated depth

Sand elevation correction function from bed morphology “linear relation for the fraction of the bed that is covered by sand stripes based on modal stripe and nonstripe elevations”

Sand elevation correction function from bed morphology = Spatially-averaged sand elevation correction = Spatially-averaged entrainment rate for a full sand bed

Non-uniform morphodynamic sediment routing model • Steady, uniform flow • Mixed-size entrainment (Garcia and Parker, 1991) • Sand elevation correction function • Non-uniform suspended sediment concentration profiles – Velocity and eddy viscosity from measured u profiles • Sediment continuity – q. T = qs (ignoring transport by bedload) – Active layer ~ bed D 50 (fully-mixed) • Boundary conditions – Zero flux at water surface – Flux at bed (entrainment rate) – Sediment feed at upstream end

Non-uniform morphodynamic sediment routing model • Steady, uniform flow • Mixed-size entrainment (Garcia and Parker, 1991) • Sand elevation correction function • Non-uniform suspended sediment concentration profiles – Velocity and eddy viscosity from measured u profiles • Sediment continuity – q. T = qs (ignoring transport by bedload) – Active layer ~ bed D 50 (fully-mixed) • Boundary conditions – Zero flux at water surface – Flux at bed (entrainment rate) – Sediment feed at upstream end

Non-uniform morphodynamic sediment routing model • Steady, uniform flow • Mixed-size entrainment (Garcia and Parker, 1991) • Sand elevation correction function • Non-uniform suspended sediment concentration profiles – Velocity and eddy viscosity from measured u profiles • Sediment continuity – q. T = qs (ignoring transport by bedload) – Active layer ~ bed D 50 (fully-mixed) • Boundary conditions – Zero flux at water surface – Flux at bed (entrainment rate) – Sediment feed at upstream end

Non-uniform morphodynamic sediment routing model • Steady, uniform flow • Mixed-size entrainment (Garcia and Parker, 1991) • Sand elevation correction function • Non-uniform suspended sediment concentration profiles – Velocity and eddy viscosity from measured u profiles • Sediment continuity – q. T = qs (ignoring transport by bedload) – Active layer ~ bed D 50 (fully-mixed) • Boundary conditions – Zero flux at water surface – Flux at bed (entrainment rate) – Sediment feed at upstream end

Non-uniform morphodynamic sediment routing model • Steady, uniform flow • Mixed-size entrainment (Garcia and Parker, 1991) • Sand elevation correction function • Non-uniform suspended sediment concentration profiles – Velocity and eddy viscosity from measured u profiles • Sediment continuity – q. T = qs (ignoring transport by bedload) – Active layer ~ bed D 50 (fully-mixed) • Boundary conditions – Zero flux at water surface – Flux at bed (entrainment rate) – Sediment feed at upstream end

No SEC

SEC from 2002 lab data

Theoretical SEC

SEC calibrated to main channel bed elevations

Comparison between observed and predicted mean bed elevations * all values in meters

Concentration profiles Simulated vs. observed
 Simulated vs. observed")
Bed grain size (D 50) Simulated vs. observed

Sand elevation correction function Yes or No? Which to choose? • Blue – 2002 data – Bed evacuates too rapidly • Orange – theoretical – Decent prediction • Yellow – Calibrated – Best fit to observed

Sand elevation correction function Yes! Don’t know! • Blue – 2002 data – Bed evacuates too rapidly • Orange – theoretical – Decent prediction • Yellow – Calibrated – Best fit to observed

Conclusions • In these conditions of fine sediment transport over a coarse immobile bed, sand stripes developed and persisted as the fine sediment was evacuated. • This bed condition can serve as the basis for a spatiallyaveraged sand elevation correction function. • This function implemented in a non-uniform routing model successfully predicts average bed elevation, concentration profiles, and bed grain size. • Predicted bed elevations are not very sensitive to the exact shape of the correction function. Calibrating the function produces only slightly better results.

What does the local sand elevation correction function look like? • Theoretical approach: • Observations from detailed experiments using PIV
- Slides: 41