Enter your location in the chat window lower
 1")


 What")

 ¡SCSEP is unique in the fields of")


 ¡The QPR is designed to report performance on each of")


 Answer")


; Q 6 (getting")


")

")


")

")


 51")


- Slides: 53
Enter your location in the chat window (lower left of screen) 1
December 13, 2018
Two. Tech, Inc. Older Workers Unit 3
The Charter Oak Group, LLC Older Workers Unit 4
Knowledge Check 1 Choose the answer that best reflects you (or your organization) What percentage of unsubsidized placements were… (provide answer to all 3 questions) 1. with host agencies? 2. made by the participants without any direct service to employer by SCSEP? 3. self-employment? 5
ANSWERS 1. Percentage of unsubsidized placements that were with host agencies: Ø Answer: 31% 2. Percentage of placements made by the participant without any substantial services to the employer by the program: Ø Answer: 79% 3. Percentage of placements that were selfemployment: Ø Answer: 4% 6
What is the Service Delivery Model (SDM) ¡SCSEP is unique in the fields of employment and training and services for older adults ØOnly employment and training exclusively for older adults ØFocuses on the hardest to serve with the least connection to the labor market ØIndividualized service plans (IEP) based on regular assessments ØEmploys universal subsidized community service as primary means to remove barriers to employment and impart essential soft skills ØProvides supportive services and an array of additional paid training to give participants a leg up 7
SCSEP Core Measures ¡Balanced array of measures recognizes SCSEP’s dual goals ¡Three measures of service to participants ØService level ØCommunity service ØMost-in-need ¡Customer Satisfaction/Effectiveness ¡Three employment outcome measures ØQ 2 Employment ØMedian Earnings ØQ 4 Employment 8
How Program Elements Relate to Performance Measures ¡The measures required by Congress support the two main goals of the program and relate to critical program elements ¡Simplified flow chart on next slide identifies major program activity clusters and the performance measures that relate to them ¡The measures are also related to each other; increased performance on one measure will enhance performance on another measure 9
SL, Mi. N E 2 E, CSS SL, CS CS, E 2 E, CSS E 2 E, E 4 E, ME, CSS
Quarterly Progress Report (QPR) ¡The QPR is designed to report performance on each of the performance measures in Sections E. ¡The QPR also contains critically important information in the other sections: ØSection B shows customer flow and placement activity ØSection C reports on community service performed ØSection D presents participant demographics and characteristics ¡If you know how to read the QPR, it is an effective tool for both forecasting and diagnosing performance (not part of today’s presentation) ¡The next slides show you which QPR elements are related to which measures. 11
CS, SL SL, MIN CS, SL, MIN Q 2 E, CSS ME Q 2 E, CSS Q 2 E, Q 4 E, ME ME ME Q 2 E CS, CSS SL CS, CSS CS SL = Service Level (E 1) CS = Community Service (E 2) MIN = Most-in-Need (E 3) Q 2 E = Q 2 Employment (E 4) Q 4 E = Q 4 Employment (E 5) ME = Median Earnings (E 6) CSS = Customer Satisfaction (E 7) 12
MIN priority of service MIN waiver factor 13
The Core of the SDM Community Service Assignment ¡CSA is designed to remove barriers to employment and develop soft skills ¡Critical components: ØAssessment, re-assessment, and IEPs ØAppropriate host agency job and rotation • Collaborative process: participant’s interests and needs; having a say in assignment and training received at CSA • Fit with host agency: capacity to meet participant’s needs; understanding of host agency’s business needs; some choice in the assignment; sufficient information about participants assigned ØWhat to do when there is no appropriate CSA 14
A Top Down View Understanding the Participant Pool ¡Why this matters: ØTrack changing demographics ØRefining service delivery model • Understanding that participants with different characteristics can have very different needs • Providing the same training and services to all participants may lead to poor outcomes for some ØRecruitment priorities and strategies ØMarketing to CBOs, host agencies, and employers ØTargeting your resources 15
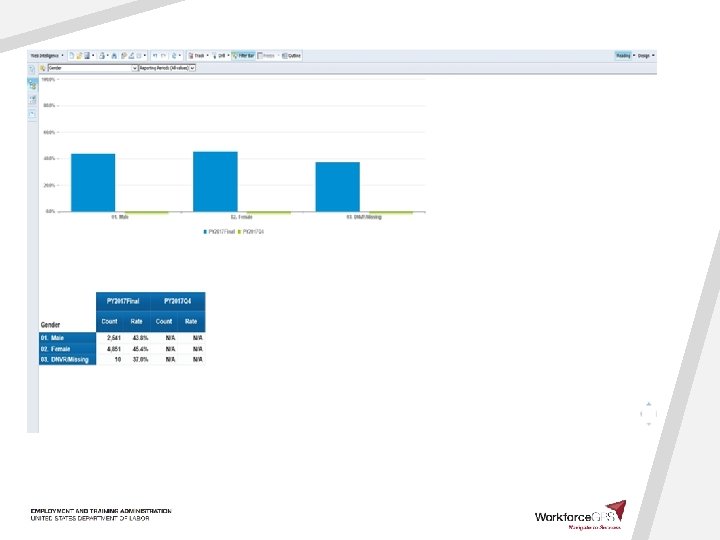
Using Info. SPACE to Analyze Participant Pool by Characteristics ¡Participants by Dimension shows participants by one of 40 dimensions (same as Section D of QPR) ¡Also shows participants by gender, age, education, or race crossed with one other dimension ¡Available at all levels: nationwide, all national grantees, all state grantees, grantee, sub-grantee, state, region, national grantees by state 16
17
18
19
Knowledge Check 2 Choose the answer that best reflects you (or your organization) Answer the three questions below: 1. Percentage of host agencies that have asked to remove a participant? 2. Percentage of host agencies reporting no increase in the amount of services they provide to the community as result of participating in SCSEP? 3. Percentage of host agencies that would have liked participants to come with more basic computer knowledge? 20
ANSWERS 1. Percentage of host agencies that have asked the program to remove a participant Ø Answer: 41% 2. Percentage of host agencies reporting no increase in the amount of services they provide to the community as result of participating in SCSEP Ø Answer: 41% 3. Percentage of host agencies that would have liked participants to come with more basic computer knowledge: Ø Answer: 30% 21
¡Two assessments every 12 months; should lead to job rotation and new assignment if necessary, as well as additional services ¡Participant survey: Q 4 (expectations: why enrolled in SCSEP), Q 6 (our understanding their employment interests and needs), Q 10 (receiving training needed for the assignment), Q 11 (having a say in the skills to be gained), Q 12 (receiving appropriate computer training), Q 7 (getting needed supportive services) 22
¡Host agency survey: Q 5 (our understanding of their business needs); Q 6 (getting sufficient information); Q 11 (our staying in touch); Q 7 (having some choice in the assignment); Q 9 (participants’ preparation for CSA); Q 8 (having a good match); Q 12 (participants’ need for supportive services); Q 13/Q 14 (removal from CSA) ¡Two management reports on host agencies provide number of active and inactive host agencies, host agency tenure in SCSEP, average length of assignment, and average number of assignments by host agency 23
24
25
Participant Profiles ¡Profiles identify the clusters of characteristics that make up a significant portion of the participant pool ¡They can also be used to show which clusters of characteristics are associated with better and worse employment outcomes ¡Planned for a future release of Info. SPACE 26
¡What tools have you found most useful for analyzing your participate pool and understanding their needs? ¡What additional tools would you like? ¡What tools have you found most useful for analyzing your host agency pool and understanding their needs? ¡What additional tools would you like? 27
Good Outcomes for All Self-Sufficiency Is Not Always a Job ¡Unsubsidized employment is a major goal of SCSEP ¡Regulations assume that all participants want and can achieve employment; first IEP must reflect this ¡Regulations also recognize that employment is not feasible for everyone (in PY 2017, only about 37% of exited participants had a placement); subsequent IEPs must reflect other forms of selfsufficiency if placement is not feasible, e. g. , income supports, social engagement, volunteering 28
Top Down and Bottom Up Triaging the Participant Pool ¡Use both the profiles and dimensional analyses to get a comprehensive view of the participant pool and your knowledge of individual participants through their assessments and IEPs ¡Triaging the participant pool will enable you to identify three groups of participants: 1. Those most motivated and prepared for employment; these will need the least additional preparation from you and should be the easiest to place 2. Those interested in employment but needing significant support to become job-ready and secure a job 3. Those for whom employment is probably not feasible and for whom other forms of self-sufficiency should be explored 29
Knowledge Check 3 A Choose the answer that best reflects you (or your organization) Answer the four questions below in the chat: 1. On a scale of 1 -10, what score did participants give the program for providing them needed help to prepare for the workforce? 2. On a scale of 1 -10, what score did participants give the program for helping them find a job? 3. What percentage of participants said that the computer training they received was appropriate for their needs? 4. What percentage of participants said that the program did not help them obtain needed social services? 3 0
ANSWERS 1. Score for preparing participants for the workforce ØAnswer: 7. 9 out of 10 2. Score for helping participants find a job ØAnswer: 7. 2 out of 19; lowest score in survey 3. Percentage that said computer training was appropriate for their needs ØAnswer: 65% 4. Percentage that said the program did not help them obtain needed supportive services ØAnswer: 25% 31
Knowledge Check 3 B Choose the answer that best reflects you (or your organization) What percentage of employers would like participants to be better prepared in each of these areas: 1. Computer Knowledge 2. Knowledge of what the job requires 3. How to behave with co-workers and customers 4. Basic employability skills 32
ANSWERS 1. Computer Knowledge ØAnswer: 25% 2. Knowledge of what the job requires Ø Answer: 19% 3. How to behave with co-workers and customers Ø Answer: 18% 4. Basic employability skills Ø Answer: 17% 33
¡CSA is the primary vehicle for removing barriers to employment, developing soft skills, and providing work experience through initial host agency job and job rotation ¡ Additional paid training should supplement and complement that provided by the CSA; it is provided by the standard grant funds (Other Participant Costs) and ATSS 10% funding ¡Because dollars are limited, additional paid training should be used where it makes a difference Ø Participant is willing and able to take full advantage Ø Training will contribute to a placement at a better job 34
Tools for Assessing the Placement Process ¡Participant survey: Q 20 (preparation for employment by sector); Q 18 (preparation for success in the workforce; Q 12 (appropriate computer training); Q 19 (help in finding employment) ¡Employer Survey: Q 4 (understanding of business need); Q 7 (program stayed in touch); Q 5 (participants had necessary skills to start the job); Q 6 (participants’ need for better preparation); Q 11 (attractiveness of SCSEP); Q 8 (participants’ need for supportive services) 35
¡New surveys are being developed for all employer placements and for host agencies that hire participants after the CSA ¡Two management reports on employers provide number of active and inactive employers, employers’ tenure with SCSEP, average number of participants by employer, and employment outcome achieved by placement. The details also show OJEs and job codes 36
37
38
Knowledge Check 4 A Choose the answer that best reflects you (or your organization) For each question below, indicate which group achieved the higher rate of entered employment in PY 2016 (please answer in the chat) 1. Hispanics, non-Hispanics, or neither 2. Homeless, not homeless, or neither 3. LEP, not LEP, or neither 4. Low literacy skills, not low literacy skills, or neither 3 9
4 A - ANSWERS 1. Hispanics, non-Hispanics, or neither 2. Homeless, not homeless, or neither 3. LEP, not LEP, or neither 4. Low literacy skills, not low literacy skills, or neither 40
Knowledge Check 4 B Choose the answer that best reflects you (or your organization) For each question below, indicate which group achieved higher average earnings (please answer in the chat) 1. Hispanics, non-Hispanics, or neither 2. Homeless, not homeless, or neither 3. LEP, not LEP, or neither 4. Low literacy skills, not low literacy skills, or neither 4 1
4 B - ANSWERS 1. Hispanics, non-Hispanics, or neither 2. Homeless, not homeless, or neither 3. LEP, not LEP, or neither 4. Low literacy skills, not low literacy skills, or neither 42
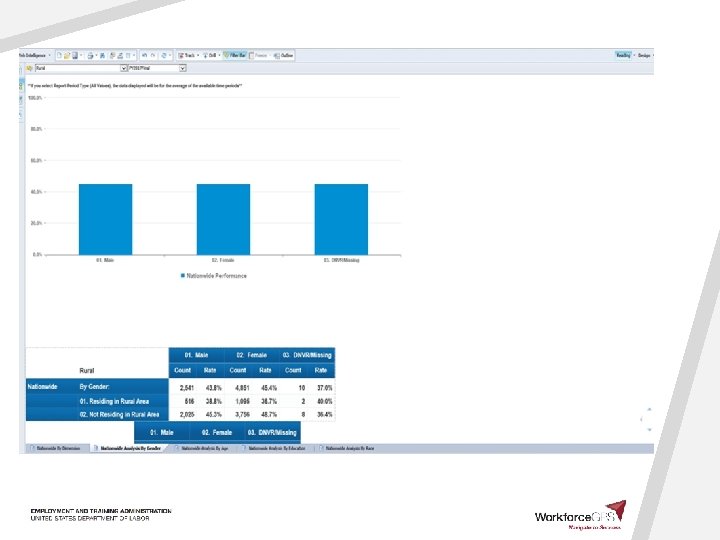
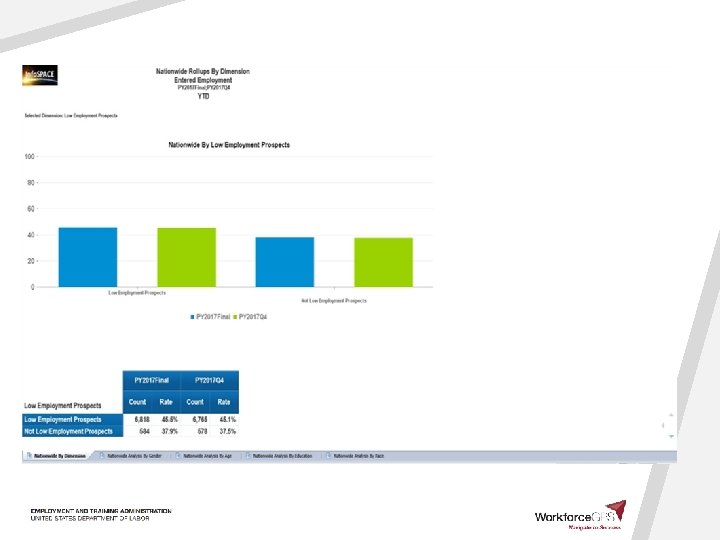
Using Info. SPACE to Analyze Employment Outcomes by Characteristics ¡Dimensional Analysis shows the differing rates of employment outcomes by all participants with the same one or two characteristics in as Participants by Dimension 43
Participant Profiles ¡You can use Info. SPACE to approximate the effects of multiple characteristics by looking for participants who have two or more of the individual barriers to employment that negatively affect entered employment; you can also do your own cross-tabs with gender, age, education, and race for the three outcome measures ¡Participant profiles can be used to show which clusters of characteristics make up a significant portion of the participant pool and which clusters are associated with better or worse employment outcomes 47
Some Preliminary Profile Findings About Employment Outcomes ¡ Age has persistent effects on entered employment; with few exceptions, it is a straight line decrease. This effect persists even when other powerful characteristics, like public assistance and education, are added ¡ High school degree seems to have a powerful effect (strong argument for adult ed and GEDs), but age still trumps education. Across all educational levels, the youngest age band enters employment 30 points more than the oldest age band ¡ For most characteristics, rurality reduces likelihood of entered employment; e. g. , rural participants on public assistance do far worse than urban participants on public assistance. ¡ Disability is a surprising exception to the effect of rurality: Disability has almost no negative effect on rural participants; for urban participants, however, entered employment is 9 points lower for those with a disability than without disability. Rural veterans also do somewhat better than urban veterans, although both still lag non-covered persons ¡ Increasing education from less than HS to high school deceases the effect of rurality from 9 points to 6. 5 points; an associate’s degree entirely removes the effect (but this degree does not always yield higher entered employment 48
What Else We Know About Placements ¡Substantial service: 21. 4% of all placements were due to a substantial service provided to the employer by the grantee ØQuestion about SCSEP staff helping participants find employment received the lowest score in the participant survey ¡Placements with host agencies: 31. 3% of all placements in PY 2017 were with host agencies ¡Self-employment: 4. 4% of all placements were for self-employment 49
¡What tools have you found most useful for analyzing your employer pool and understanding their needs? ¡What additional tools would you like? ¡What tools have you found most useful for understanding the employment needs of your participants? ¡What additional tools would you like? 50
Enter your questions in the chat window (lower left of screen) 51
Bennett Pudlin Charter Oak Group, LLC bpudlin@charteroakgroup. com
53