Ensemble forecast and its applications Yuejian Zhu Environmental

Ensemble forecast and its applications Yuejian Zhu Environmental Modeling Center NCEP/NWS/NOAA Shanghai, China October 6 th 2006 http: //wwwt. emc. ncep. noaa. gov/gmb/ens/ http: //wwwt. emc. ncep. noaa. gov/gmb/yzhu/ Acknowledgements: Z. Toth and S. Lord (NCEP) R. Buizza (ECMWF) and P. L. Houtekamer(MSC)

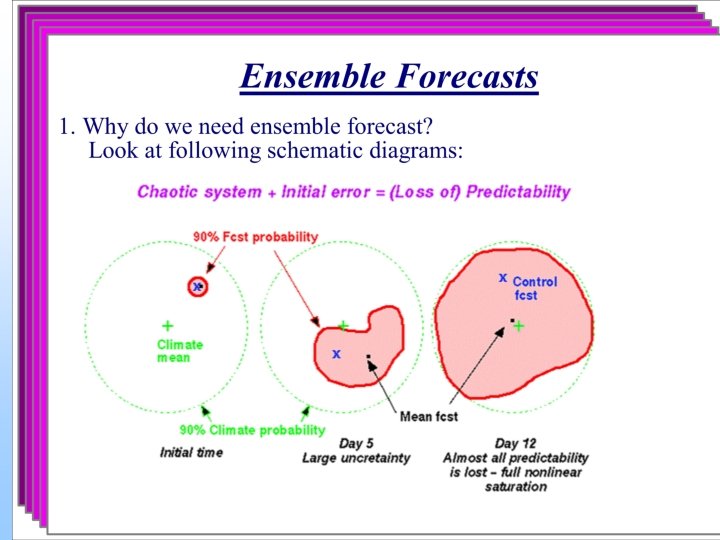
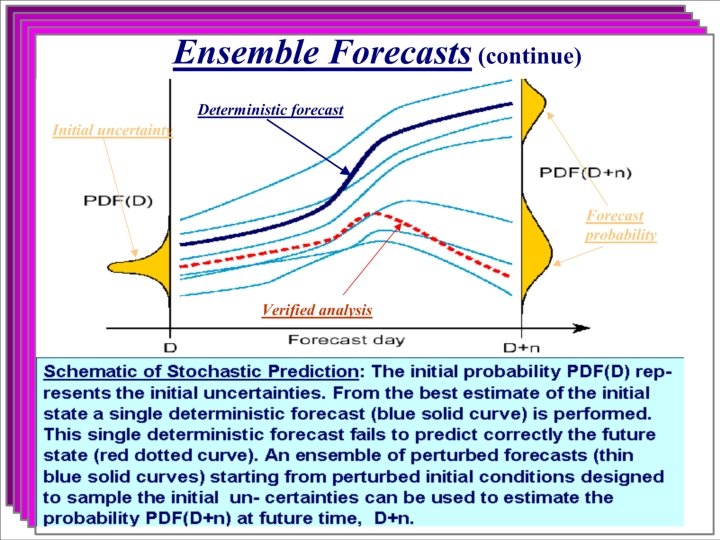
Contents • • • Introduction and useful references Why do we need ensemble forecast Methodologies of ensemble model forecast Review of statistical ensemble forecast The skill of ensemble model forecast Examples of high predictable system The application of ensemble forecast International research projects Discussion and conclusions

Introduction • Background and ensemble concept – A few decades ago • Early application by lag ensemble – Due to lack of computation resource (long-term) • Required by extended range forecast – Especially for week-2 forecast • Improved data analysis and model physics – Less room to improve the skills? • Improved observation system • More understand of forecast errors

References 1. 2. 3. 4. 5. 6. 7. 8. 9. Zhu, 2005: “Ensemble forecast: A new approach to uncertainty and predictability” AAS Toth, Talagrand, and Zhu, 2006: “The attributes of forecast system” book chapter. Cambridge University Press Toth, Talagrand, Candille and Zhu, 2003: "Probability and ensemble forecasts" book chapter. Zhu, 2004: “Probabilistic forecasts and evaluations based on a global ensemble prediction system” In book of Observation, theory and modeling of atmospheric variability, Zhu, Iyenger, Toth, Tracton and Marchok, 1996: "Objective evaluation of the NCEP global ensemble forecasting system" AMS conference proceeding. Toth, Zhu and Marchok, 2001: "The use of ensembles to identify forecasts with small and large uncertainty". Weather and Forecasting Zhu, Toth, Wobus, Rechardson and Mylne, 2002: “The economic value of ensemble-based weather forecasts” BAMS Buizza, Houtekamer, Toth, Pellerin, Wei and Zhu, 2005: “Assessment of the status of global ensemble prediction” MWR + more related articles

Deterministic or Probabilistic ? Any prediction for the future is uncertainty Is fore-cast! No deterministic answer! Must be probabilistic!

Clear sky, no precipitation
 Precipitation 2 mm/24 hrs (30%)")
20 mm/24 hrs (0%) Precipitation 2 mm/24 hrs (30%)

Current Hurricane Forecast
 • Wind sheer damages the airplane – Un-protect")
Example of cost-loss analysis (economic values) • Wind sheer damages the airplane – Un-protect airplane (loss) • 2 -million dollars for each airplane – Protect airplane (cost) • 20, 000 dollars for each airplane – For decision makers !!! • 1: 100 cost-loss ratio for this case • Probabilistic forecast and forecast reliability • Typhoon Mai-sha affected Beijing City – Un-protect (may loss) • Flooding, traffic and others. – Protect (definitely cost) • Activities will be cancelled • Labors cost • Others – Scientific decision ? ? ? • Anyone counts this ratio?
: $150 K Loss (if")
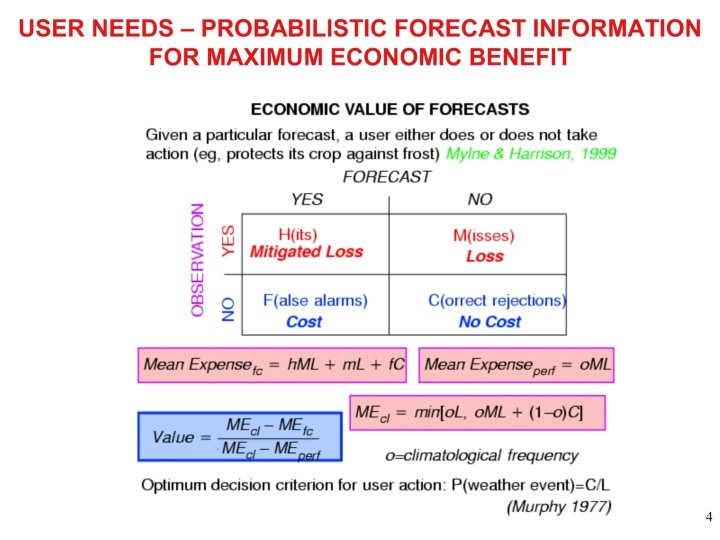
Critical Event: sfc winds > 50 kt Cost (of protecting): $150 K Loss (if damage ): $1 M Observed? Decision Theory Example YES NO Forecast? YES NO Hit $150 K False Alarm $150 K Miss $1000 K Correct Rejection $0 K Optimal Threshold = 15%
 Based on hit rate (HR) and false alarm (FA) analysis.")
Prob. Evaluation (cost-loss analysis) Based on hit rate (HR) and false alarm (FA) analysis. . Economic Value (EV) of forecasts Ensemble forecast Average 2 -day advantage Deterministic forecast
 . . . Small and large uncertainty. 1 day (large")
Prob. Evaluation (useful tools) . . . Small and large uncertainty. 1 day (large uncertainty) = 4 days (control) = 10 -13 days (small uncertainty)

The skill of global ensemble • Simple measurements – Ensemble mean ( like deterministic forecast) – PAC, RMS and spread • Distributions – Talagrand distribution – Outliers • Probabilistic evaluations – Brier skill scores (BSS) • In terms of resolution and reliability – Ranked probability skill scores (RPSS) – Relative operational characteristics (ROC) • In terms of hitting rate and false alarm rate – Economic values (EV)

GEFS configurations Current New Model GFS Initial uncertainty BV ETBV Model uncertainty None Tropical storm Relocation same Daily frequency 00, 06, 12 and 18 UTC same Hi-re control (GFS) T 382 L 64 (d 0 -d 7. 5) T 190 L 64 (d 7. 5 -d 16) same Low-re control (ensemble control) T 126 L 28 (d 0 -d 16) 00 UTC only T 126 L 28 (d 0 -d 16) 00, 06, 12 and 18 UTC Perturbed members 10 for each cycle 14 (20) for each cycle Forecast length 16 days (384 hours) same Implementation August 17 th 2005 May 30 th 2006

Northern Hemisphere 500 h. Pa geopotential height Pattern Anomaly Correlation Root Mean Square Simple Measurement For Ensemble mean

One day advantage Due to model imperfection

Outlier – from Talagrand distribution Spread is too small/bias Negative Spread is too big

ROC area May-July 2002

Brier Skill Scores and decomposition Resolution Reliability

NCEP ensemble mean performance for past 5 -year

Ranked probabilistic skill scores NCEP ensemble probabilistic performance for past 5 -year Economic values for 1: 10 cost/loss ratio
 Location")
High predictable heavy precipitation event GFS February 12 -13 1997 (Southern Louisiana flooding) Location and intensity GFS made a very good forecast, But Ensemble made a excellent forecast. ENS
")
HIGHLY PREDICTABLE HEAVY PRECIPITATION EVENT (20010313)
 Ensemble-based precipitation forecasts gave relatively high probability values")
High Predictable Heavy Precipitation Events (20010113) Ensemble-based precipitation forecasts gave relatively high probability values for the half and one inch thresholds for the 24 -hr period ending 031312 for the Gulf states with 1 through 8 days lead time. The corresponding observed precipitation amounts indicate that the forecasts were rather successful. The high predictability in precipitation was associated with high confidence (and well verifying) forecasts for 500 h. Pa height. The cut-off low over the SW US that allowed Pacific air to reach the Gulf of Maxico at low latitudes (over and south of Baja CA) was well predicted, with high confidence, at various lead times (see, for example, at 4, 7, and even at 10 days). Red colors in these charts over the cut-off low correspond to an area associated with high predictability.

RMOP

DETERMINSTIC/PROBABILISTIC FORECAST QPF. vs. PQPF • Northern California State Christmas-New Year flooding. • Winter storm last more than 10 days. • Total precipitation amount exceeding 660 mm over the huge area. • The homes of 100, 000 residents who has been evacuated. • Some stranded residents has to be rescued by helicopter. • Caused a lot of damages include road, bridge and resident houses. Photo from Washington Post

24 hours observation GFS ENS

Ensemble based Probabilistic Products • • • Spaghatti diagram for uncertainty Standard/normalized spread, mean Relative measure of predictability (RMOP) Probabilistic quantitative precipitation forecast (PQPF) Probabilistic precipitation types Calibrated PQPF Hurricane tracks/strike probability Anomaly forecasts User specified …… Calibration !!!
 By Bill Bua")
Ensemble Forecast for Uncertainty (1) By Bill Bua
 By Bill Bua")
Ensemble Forecast for Uncertainty (2) By Bill Bua
 By Bill Bua")
Ensemble Forecast for Uncertainty (3) By Bill Bua
")
Ensemble Forecast for Uncertainty (4)
 2.")
1. By using equal climatological bins (e. g. 10 bins, each grid points) 2. Counts of ensemble members agree with ensemble mean, (same bin) 3. Construct n+1 probabilities for n ensemble members from (2). 3. Regional (NH, weighted) Normalized Accumulated Probabilities (n+1) 4. Calculate RMOP based on (3), but 30 -d decaying average. 5. Verification information (blue numbers): historical average (reliability)

Ensemble mean 10 Climatological equally likely bins Example of 1 grid point 10 ensemble forecasts The value of ensemble members agree to ensemble mean is 4/10 or 40% (probability) There are 10512 points ( values ) for global at 2. 5 * 2. 5 degree resolution 10 ensemble members could construct 11 probabilities categories, such as 0/10 (0%), 1/10(10%), 2/10(20%), 3/10(30%), 4/10(40%), 5/10(50%), 6/10(60%), 7/10(70%), 8/10(80%), 9/10(90%), 10/10(100%) Sum of each grid point for above 11 probabilistic categories by area weighted and normalized for global or specified region Get: 0/10 1/10 2/10 3/10 4/10 5/10 6/10 7/10 8/10 9/10 10/10 . 029 . 047 . 077 . 085 . 100 . 135 . 116 . 089 . 081 . 070 . 177 2. 9% 7. 6% 15. 3% 23. 8% 33. 8% 47. 3% 58. 9% 67. 8% 75. 9% 82. 9% 100% sum of these = 1. 0 (1. 007 here) accumulated values There is 30 -day decaying average of above values ( last line ) in the data-base and updated everyday. Assume these are 30 -day decaying average values In this case, point value is 4/10, RMOP value of this point is 33. 8%

China

General public for past 8 years

Specific request


 Frances (08/28)")
Ensemble Based Hurricane Track Plots Karl (09/18) Frances (08/28)

Example of probabilistic forecast in terms of climatology
 & 90 -PERCENTILE FORECAST VALUES (BLACK CONTOURS) AND")
ENSEMBLE 10 -, 50 - (MEDIAN) & 90 -PERCENTILE FORECAST VALUES (BLACK CONTOURS) AND CORRESPONDING CLIMATE PERCENTILES (SHADES OF COLOR)

The pre-NWP forecast accuracy A schematic illustration of the increase of RMSE with forecast time. The pre-NWP forecaster started from a persistence forecast which he skillfully extrapolated into the future, converging towards climate for longer ranges A 2 persistence A meteorologist • The time unit can be anything from hours to days depending on the parameter (hours for clouds, days for temperature)

NWP more accurate - but also less persistence A 2 A good NWP model is able to simulate all atmospheric scales throughout the forecast. It has the same variance as the observations and the persistence forecasts, which yields an error saturation level 41% above the climate world’s best NWP A meteorologist

The art of good forecasting The way out of the dilemma: Combine the high accuracy of NWP in the short range with a filtering of the non -predictable scales for longer ranges This can be done both with and without the EPS A 2 world’s best NWP A persistence meteorologist modified NWP forecast

Thank You!!!
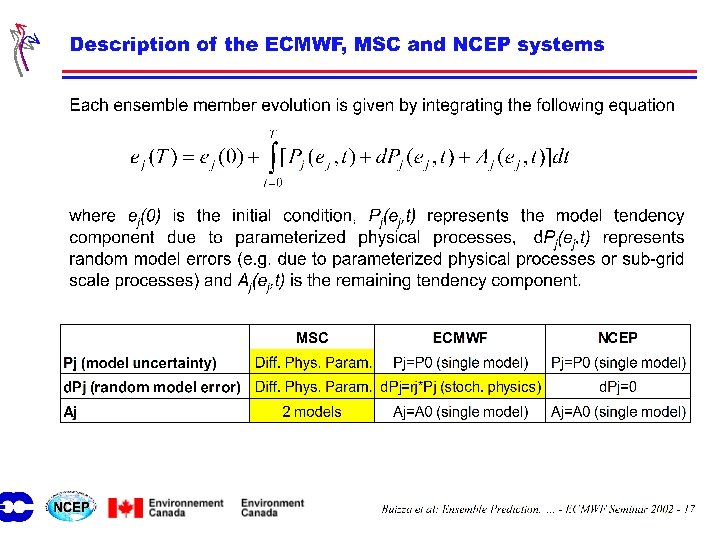
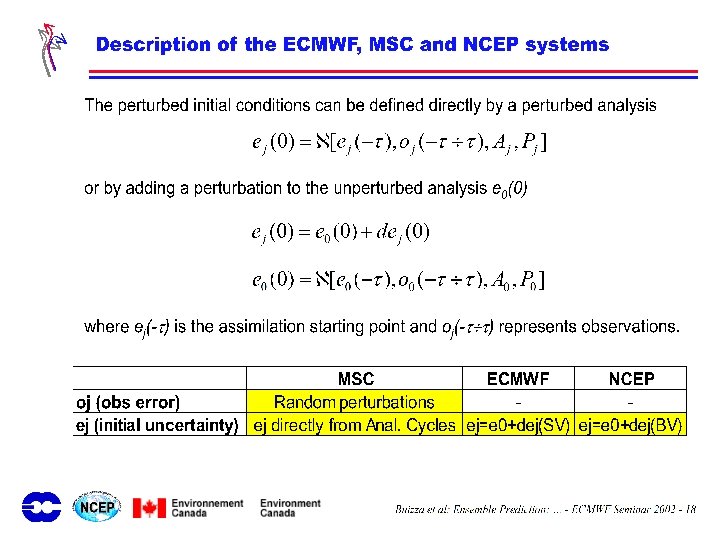
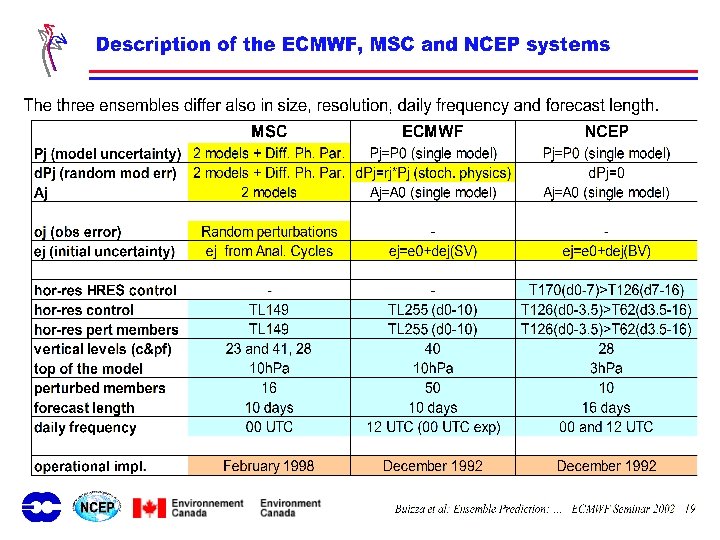
- Slides: 55