
Engineering of Biological Processes Lecture 5 Control of
Engineering of Biological Processes Lecture 5: Control of metabolism Mark Riley, Associate Professor Department of Ag and Biosystems Engineering The University of Arizona, Tucson, AZ 2007
Objectives: Lecture 5 • Understand how metabolism is controlled • Model these reactions to shift carbon and resources down certain paths
Control of overall rate of metabolism • Highly regulated process • Controlled by – – – feedback mechanisms on enzymes inhibited by products stimulated by reactants energy charge oxygen concentration environmental factors • temperature, CO, some antibiotics
Metabolic processes are controlled by • The flow of metabolism is determined primarily by the amount and activities of enzymes – substrate amounts have a smaller effect • Covalent modification – regulatory enzymes are turned on or off by phosphorylation (PO 3) – small triggering signals have a large effect on overall rates • Reversible reactions are potential control sites • Compartmentation – glycolysis, fatty acid metabolism, and pentose phosphate pathway in cytosol – fatty acid oxidation, citric acid cycle, and oxidative phosphorylation take place in mitochondria
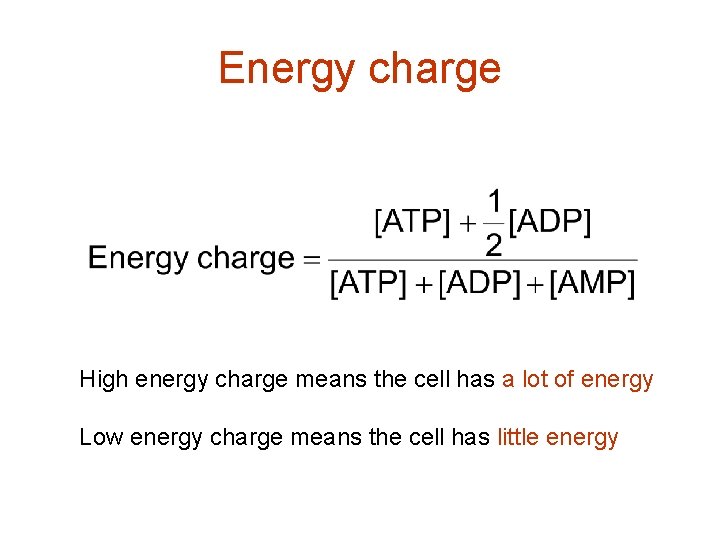
Energy charge High energy charge means the cell has a lot of energy Low energy charge means the cell has little energy

Control points identification of enzymes • Enzymes – present at low enzymatic activity • either low concentration or low intrinsic activity – catalyze reactions that are not at equilibrium (under normal conditions) – usually catalyze slow reactions (rate-determining) – often found at major branch points • downstream end – entryway into reaction that has the highest flux
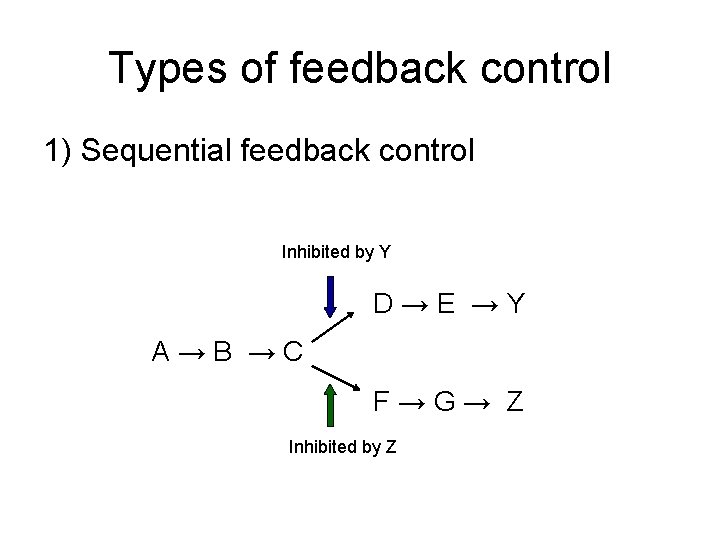
Types of feedback control 1) Sequential feedback control Inhibited by Y D→E →Y A→B →C F→G→ Z Inhibited by Z

Types of feedback control 2) Enzyme multiplicity Inhibited by Y D→E →Y Inhibited by Y A B →C Inhibited by Z F→G→ Z Inhibited by Z
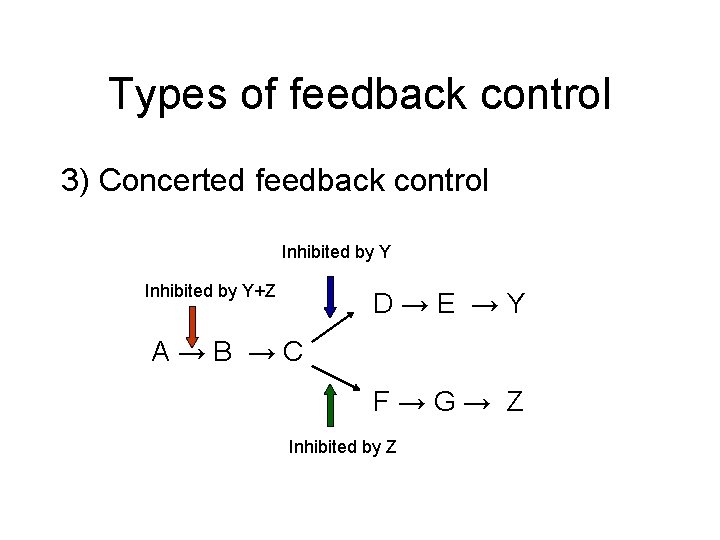
Types of feedback control 3) Concerted feedback control Inhibited by Y+Z D→E →Y A→B →C F→G→ Z Inhibited by Z
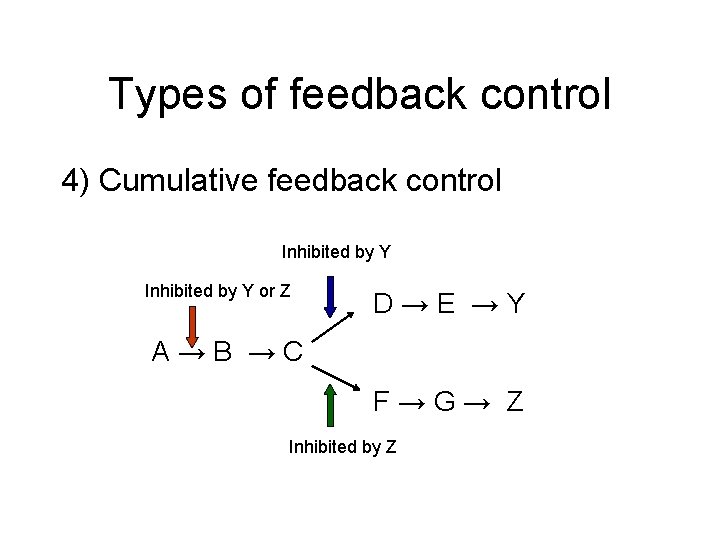
Types of feedback control 4) Cumulative feedback control Inhibited by Y or Z D→E →Y A→B →C F→G→ Z Inhibited by Z
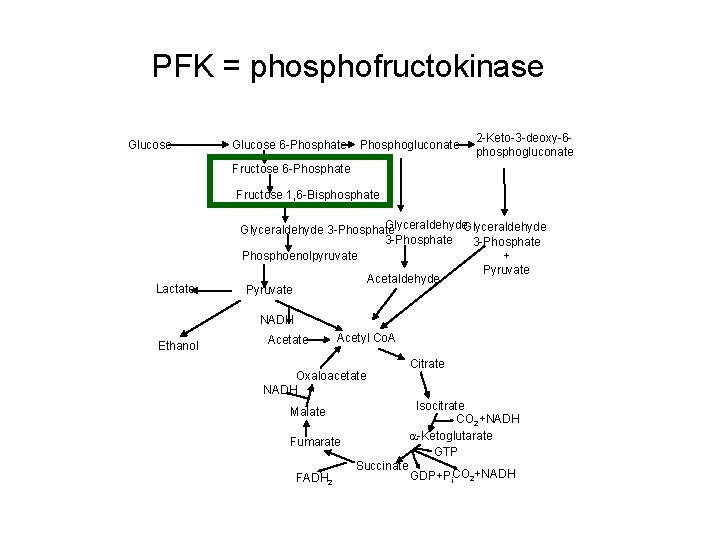
PFK = phosphofructokinase Glucose 6 -Phosphate Phosphogluconate 2 -Keto-3 -deoxy-6 phosphogluconate Fructose 6 -Phosphate Fructose 1, 6 -Bisphosphate Lactate Glyceraldehyde 3 -Phosphate Phosphoenolpyruvate + Pyruvate Acetaldehyde Pyruvate NADH Ethanol Acetate Acetyl Co. A Oxaloacetate NADH Isocitrate CO 2+NADH a-Ketoglutarate GTP Malate Fumarate FADH 2 Citrate Succinate GDP+Pi. CO 2+NADH

PFK = phosphofructokinase Fructose 6 -Phosphate + ATP Fructose 1, 6 -Bisphosphate + ADP + Pi Phosphofructokinase (PFK) allosteric enzyme activated by ADP and Pi, but inhibited by ATP. When [ATP] is high, PFK is turned off, effectively shutting down glycolysis. Allosteric = binding of one compound impacts the binding of other compounds Michaelis-Menten kinetics do not readily apply
Pasteur effect • Rate of glycolysis under anaerobic (low O 2) conditions is higher then under aerobic (high O 2). • Carbohydrate consumption is 7 x higher under anaerobic conditions. • Caused by inhibition of PFK by citrate and ATP
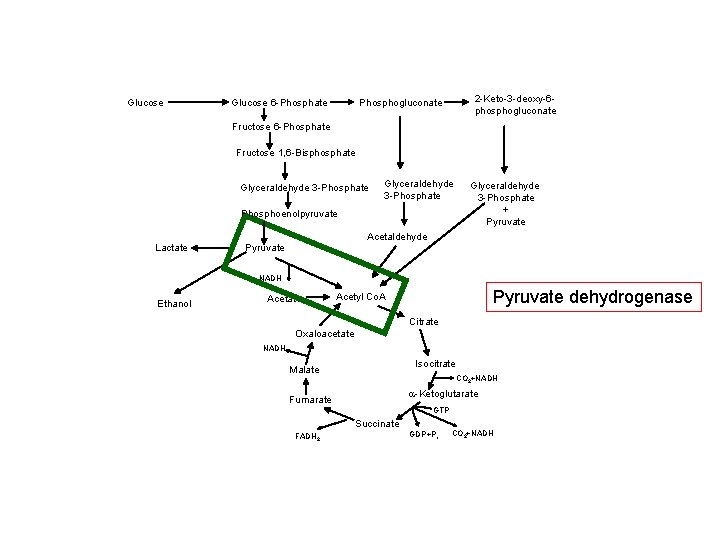
Glucose 6 -Phosphate 2 -Keto-3 -deoxy-6 phosphogluconate Phosphogluconate Fructose 6 -Phosphate Fructose 1, 6 -Bisphosphate Glyceraldehyde 3 -Phosphate Phosphoenolpyruvate Lactate Glyceraldehyde 3 -Phosphate + Pyruvate Acetaldehyde Pyruvate NADH Ethanol Acetate Pyruvate dehydrogenase Acetyl Co. A Citrate Oxaloacetate NADH Isocitrate Malate CO 2+NADH a-Ketoglutarate Fumarate GTP Succinate FADH 2 GDP+Pi CO 2+NADH
Pyruvate dehydrogenase Pyruvate + NAD+ + Co. A Acetyl Co. A + CO 2 + NADH Pyruvate dehydrogenase (PDH) assemblage of 3 enzymes that each catalyze one step in the overall reaction above. PDH is inhibited by products (acetyl Co. A, NADH), feedback regulation by nucleotides (ATP, GTP) reversible phosphorylation (a PO 3 - is added to a serine residue). phosphorylation is enhanced by a high energy charge. Activated by AMP, ADP, NAD+
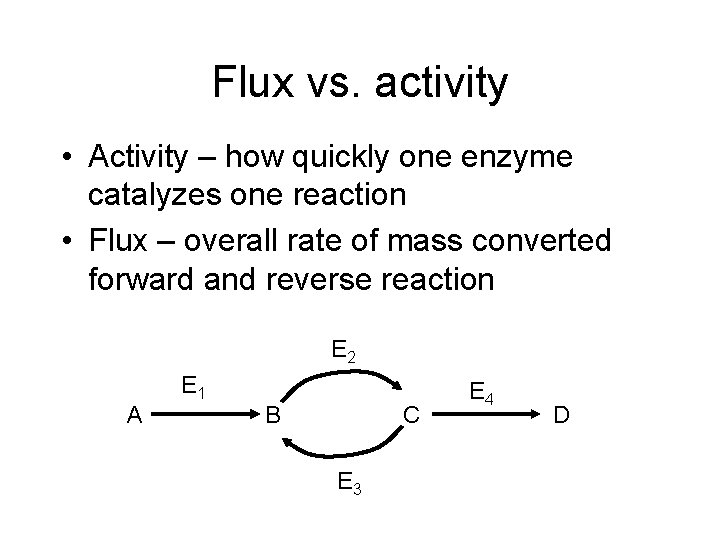
Flux vs. activity • Activity – how quickly one enzyme catalyzes one reaction • Flux – overall rate of mass converted forward and reverse reaction E 2 A E 1 B C E 3 E 4 D
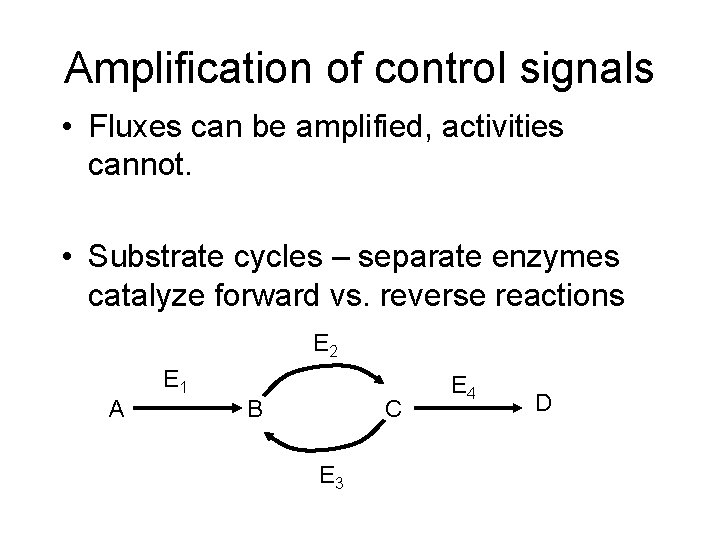
Amplification of control signals • Fluxes can be amplified, activities cannot. • Substrate cycles – separate enzymes catalyze forward vs. reverse reactions E 2 A E 1 B C E 3 E 4 D
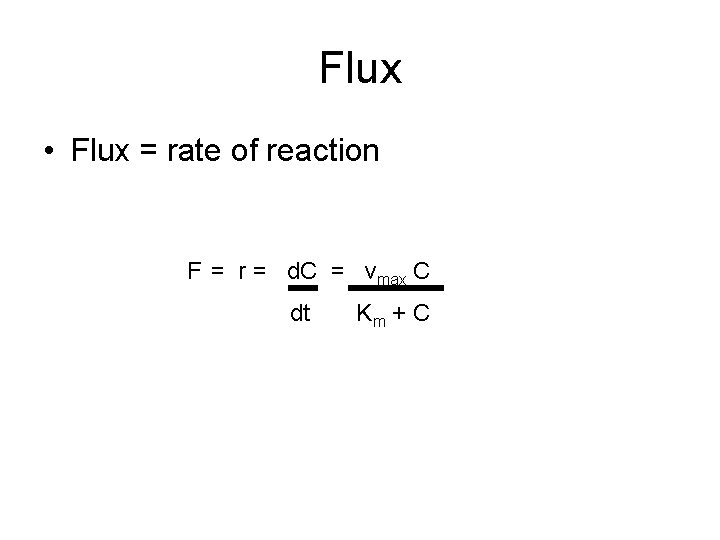
Flux • Flux = rate of reaction F = r = d. C = vmax C dt Km + C
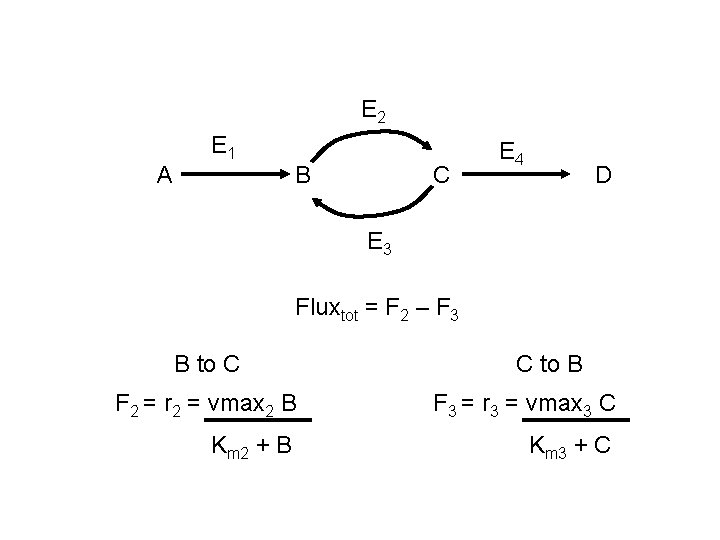
E 2 A E 1 B C E 4 D E 3 Fluxtot = F 2 – F 3 B to C C to B F 2 = r 2 = vmax 2 B F 3 = r 3 = vmax 3 C Km 2 + B Km 3 + C
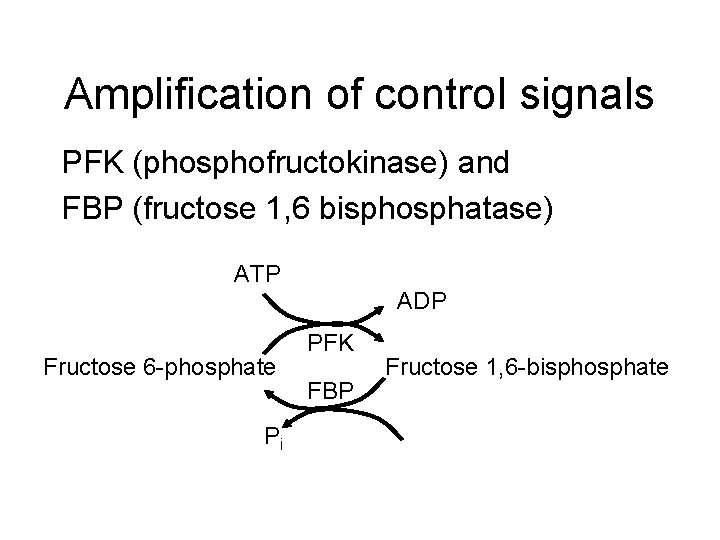
Amplification of control signals PFK (phosphofructokinase) and FBP (fructose 1, 6 bisphosphatase) ATP ADP Fructose 6 -phosphate Pi PFK FBP Fructose 1, 6 -bisphosphate
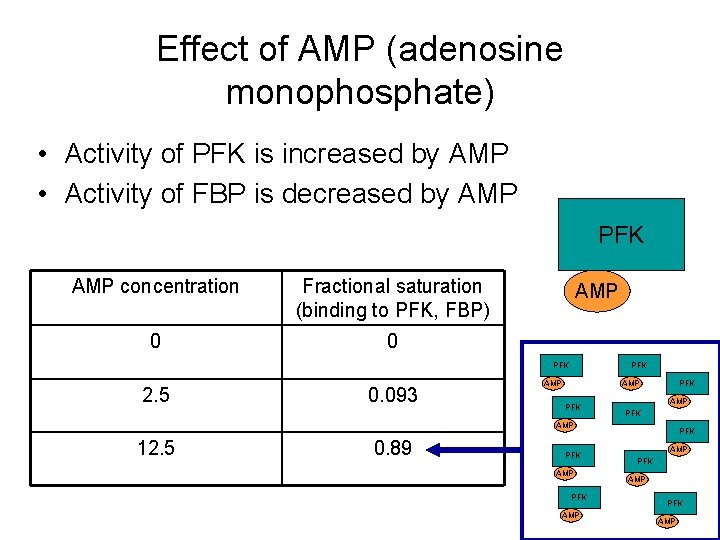
Effect of AMP (adenosine monophosphate) • Activity of PFK is increased by AMP • Activity of FBP is decreased by AMP PFK AMP concentration Fractional saturation (binding to PFK, FBP) 0 0 AMP PFK 2. 5 0. 093 PFK AMP 12. 5 0. 89 PFK AMP PFK AMP
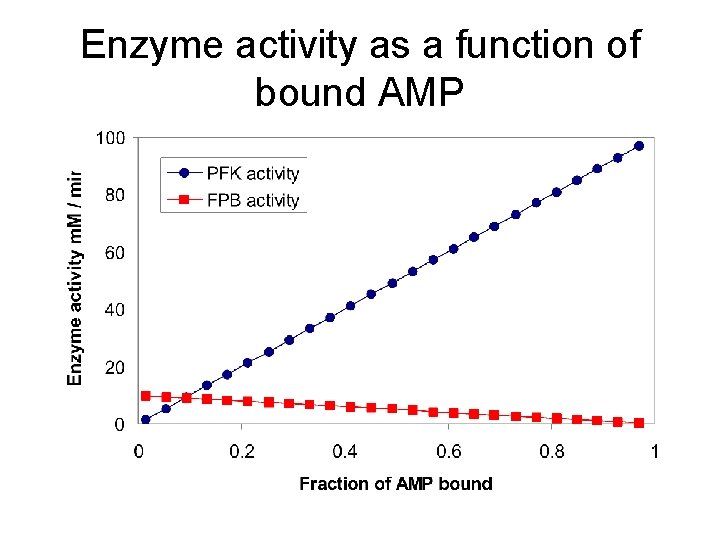
Enzyme activity as a function of bound AMP
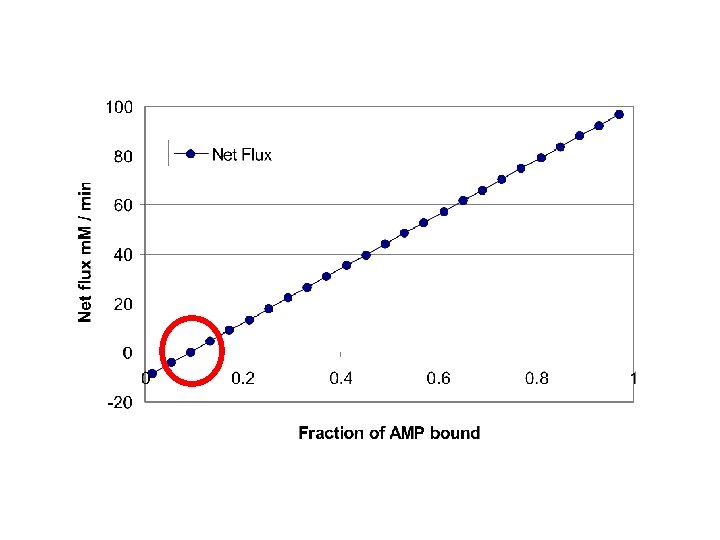
Effect of the substrate cycle A 440 -fold increase in flux (87. 9 / 0. 2) results from a 5 -fold change in [AMP] (12. 5 / 2. 5). This corresponds to 0. 9 / 0. 1 bound.
Design of an optimal catalyst • • Which pathways are active? Which is the slow step? Which steps are highly regulated? How do we funnel resources toward the desired product?
Steps in metabolic analyses • 1) Develop a model of metabolism – Observe pathways – Measure flux through key reactions – Identify slow steps • 2) Introduce perturbations – Alter enzyme activity • Changing substrate • Vary concentrations of substrate • Other activators / inhibitors – Determine fluxes after relaxation • New steady state • 3) Analyze flux perturbation results – Are branches rigid? – Do changes in upstream flux impact split ratio or flux?

Basis of metabolic control • Pacemaker Enzymes – Regulation is accomplished by altering the activity of at least one pacemaker enzyme (or rate-determining step) of the pathway. • Identification of a Pacemaker Enzyme – Normally it has a low activity overall, – Is subject to control by metabolites other than its substrates, – Often positioned as the first committed step of a pathway, directly after major branch points, or at the last step of a “multiinput” pathway. – Needs confirmation of the in vivo concentrations of the enzyme’s substrate(s) and product(s).
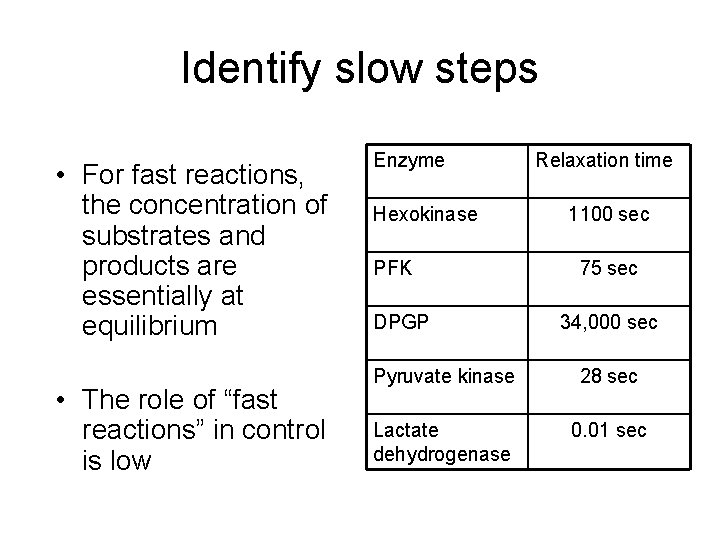
Identify slow steps • For fast reactions, the concentration of substrates and products are essentially at equilibrium • The role of “fast reactions” in control is low Enzyme Hexokinase PFK DPGP Relaxation time 1100 sec 75 sec 34, 000 sec Pyruvate kinase 28 sec Lactate dehydrogenase 0. 01 sec
Change enzymes • Inhibit (destroy) a native enzyme – Knockout • Enhance the concentration of a native enzyme • Introduce a new enzyme – Different species – Used to permit utilization of new substrates • C sources (5 -ring sugars vs. 6 -ring sugars)
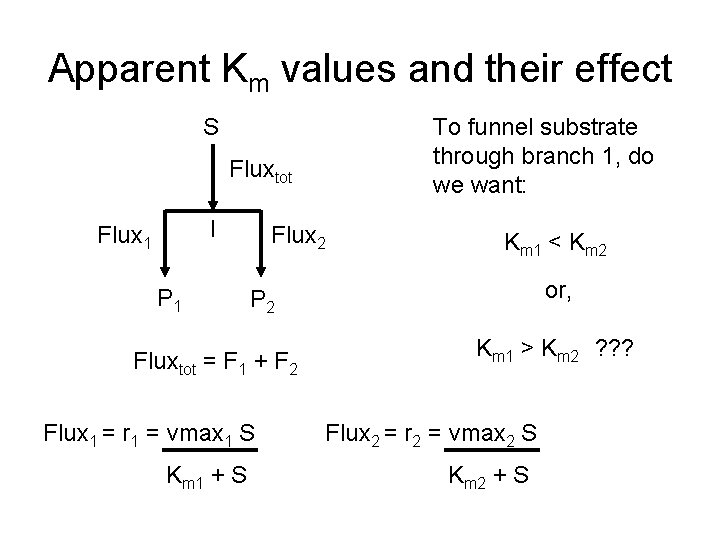
Apparent Km values and their effect S To funnel substrate through branch 1, do we want: Fluxtot I Flux 1 P 1 Flux 2 or, P 2 Fluxtot = F 1 + F 2 Flux 1 = r 1 = vmax 1 S Km 1 + S Km 1 < Km 2 Km 1 > Km 2 ? ? ? Flux 2 = r 2 = vmax 2 S Km 2 + S
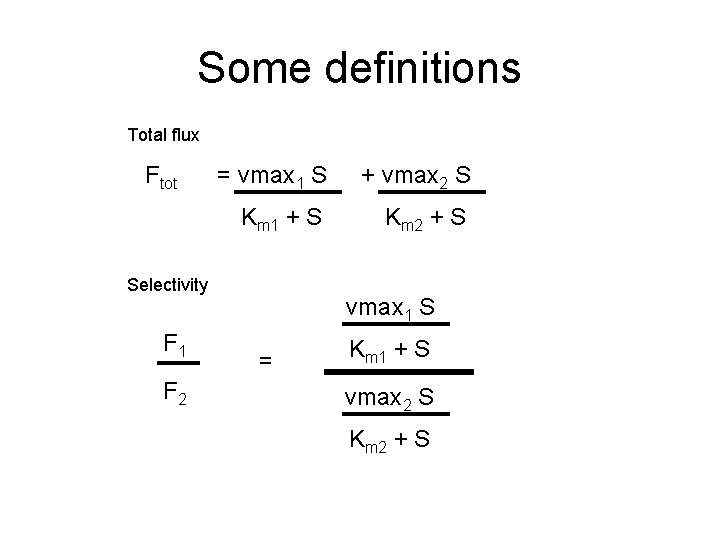
Some definitions Total flux Ftot = vmax 1 S + vmax 2 S Km 1 + S Km 2 + S Selectivity F 1 F 2 vmax 1 S = Km 1 + S vmax 2 S Km 2 + S
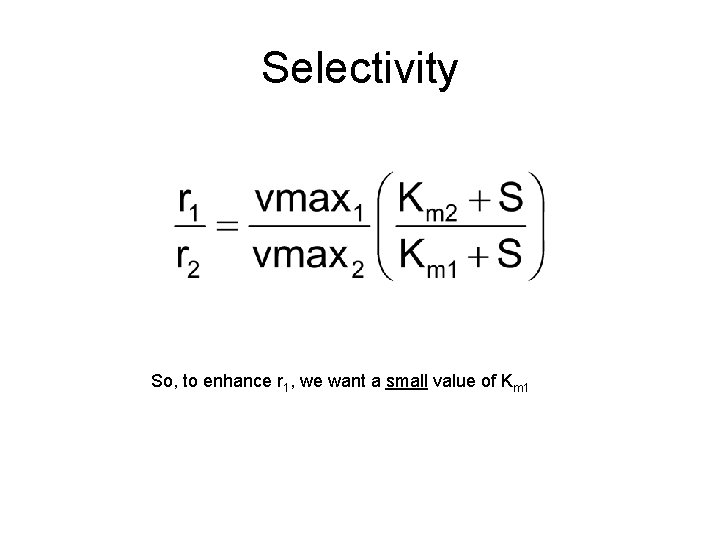
Selectivity So, to enhance r 1, we want a small value of Km 1
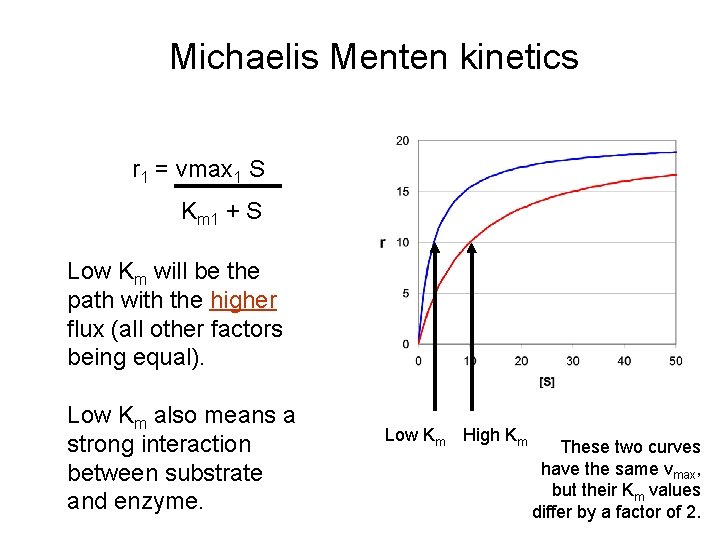
Michaelis Menten kinetics r 1 = vmax 1 S Km 1 + S Low Km will be the path with the higher flux (all other factors being equal). Low Km also means a strong interaction between substrate and enzyme. Low Km High Km These two curves have the same vmax, but their Km values differ by a factor of 2.
- Slides: 33