ENGINEERING MATERIALS The substances which are useful in

ENGINEERING MATERIALS The substances which are useful in the field of engineering are called Engineering materials. A particular material is selected is on the basis of following considerations 1. Properties of material Mechanical properties - strength, ductility, toughness, hardness, strength to weight ratio etc. Physical properties - density, specific heat, thermal expansion, conductivity , melting point etc. Chemical properties - oxidation , corrosion, flammability, toxicity etc. Manufacturing properties - formed, casting, machined, welding
")
2. Cost of material 3. Availability of material (desired shape and size and quantity) & reliability of supply. 4. Service in life of material Dimensional stability of material wear, corrosion etc. , shorten life 5. Appearance of material Color Surface texture etc.

CLASSIFICATION OF ENGINEERING MATERIALS


• A number of things are apparent: properties always cover a range, whether we are considering a whole class of materials (polymers), or a specific Al alloy (6082 -T 6); the numeric range of a property for all materials spans several orders of magnitude (factors of 10); there are many levels of detail at which designers will wish to consider data • how do metals compare with polymers? • how do carbon steels compare with Al alloys? • how do the Al alloys compare with one another? • Material property charts are designed to handle all of these issues.

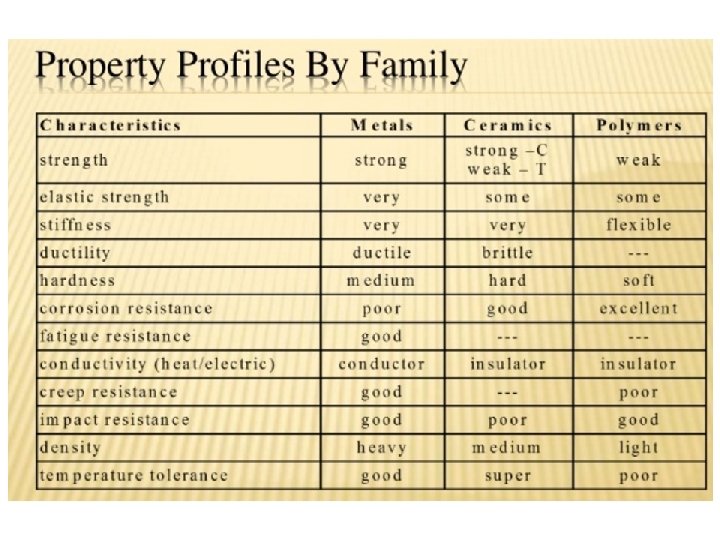
• The properties of engineering materials have a characteristic span of values. • The span can be large: many properties have values that range over five or more decades. • One way of displaying this is as a bar-chart like that of Figure for thermal conductivity. • Each bar represents a single material. • The length of the bar shows the range of conductivity exhibited by that material in its various forms. • The materials are segregated by class. • Each class shows a characteristic range: metals, have high conductivities; polymers have low; ceramics have a wide range, from low to high.

A bar-chart showing thermal conductivity for families of solid. Each bar shows the range of conductivity offered by a material, some of which are labeled.

• Much more information is displayed by an alternative way of plotting properties, illustrated in the schematic of Figure 2. Here, one property (the modulus, E, in this case) is plotted against another (the density) on logarithmic scales. • The range of the axes is chosen to include all materials, from the lightest, flimsiest foams to the stiffest, heaviest metals. • It is then found that data for a given family of materials (e. g. polymers) cluster together on the chart; the sub-range associated with one material family is, in all cases, much smaller than the full range of that property. • Data for one family can be enclosed in a property-envelope, as Figure 2 shows. Within it lie bubbles enclosing classes and sub-classes.

• All this is simple enough—just a helpful way of plotting data. • But by choosing the axes and scales appropriately, more can be added. • The speed of sound in a solid depends on E and ; the longitudinal wave speed v, for instance,
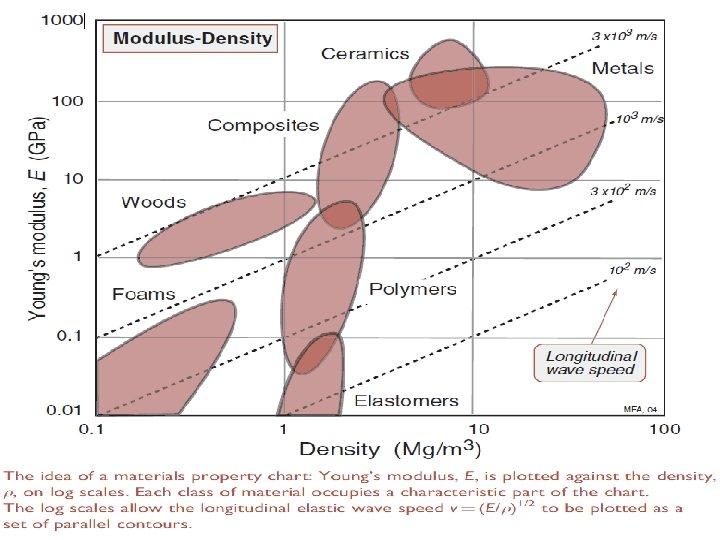

• For a fixed value of v, this equation plots as a straight line of slope 1 on Figure 2. • This allows us to add contours of constant wave velocity to the chart: they are the family of parallel diagonal lines, linking materials in which longitudinal waves travel with the same speed. • All the charts allow additional fundamental relationships of this sort to be displayed. • And there is more: design-optimizing parameters called material indices also plot as contours on to the charts https: //www. youtube. com/watch? v=7 JXLLv. Dqvl 0 http: //www. mie. uth. gr/ekp_yliko/2_materialscharts-2009. pdf
- Slides: 13