Engineering Hydrology Prof Rajesh Bhagat Asst Professor CED

Engineering Hydrology Prof. Rajesh Bhagat Asst. Professor, CED, YCCE, Nagpur B. E. (Civil Engg. ) GCOE, Amravati M. Tech. (Enviro. Engg. ) VNIT, Nagpur Experience & Achievement: Selected Scientist, NEERI-CSIR, Govt. of India. GATE Qualified Three Times. Selected Junior Engineer, ZP Washim. Three Times Selected as UGC Approved Assistant Professor, PCE, Nagpur. Assistant Professor, Cummins College of Engg. For Women (MKSSS, Nagpur) Mobile No. : - 8483002277 / 8483003474 Email ID : - rajeysh 7 bhagat@gmail. com Website: - www. rajeysh 7 bhagat. wordpress. com
 Runoff: Runoff, sources and component, classification of streams, factors affecting runoff, Estimation")
Unit-III 1) Runoff: Runoff, sources and component, classification of streams, factors affecting runoff, Estimation Methods. Measurement of discharge of a stream by Area -slope and Area-velocity methods. 2) Hydrograph: Flood hydrographs and its components, Base flow & Base flow separation, S-Curve technique, unit hydrograph, synthetic hydrograph. Instantaneous Unit hydrograph. 2

Runoff: Ø Flowing off of precipitation from catchment area through a surface channel. Ø It is normally expressed as volume per unit time. Ø It is defined as that portion of precipitation which is not absorbed by the deep strata but find its way into the stream after meeting the demands of losses. Ø Types of runoff: - (Based on time delay between precipitation and runoff) 1) Direct runoff: part of runoff, which enters the stream immediately after the precipitation. Includes surface runoff, prompt interflow and precipitation on channels surface. Also called storm runoff. 2) Interflow: the delayed flow that reaches a stream essentially as ground water flow. Includes ground water flow & delayed interflow. 3

Runoff: Ø Runoff may be referred to as a stream flow, river discharge or catchment yield. Ø Types of runoff: 1) Surface runoff: the flow of water over land or surface before joining open channel. Open channel finally reaches the catchment outlet. Laminar & turbulent regime. 2) Interflow: part of precipitation that infiltrates and moves laterally through upper crust of the soil or above GWT and returns to the surface at some location. Through flow or storm seepage or subsurface flow or quick return flow. 3) Ground water flow: part of precipitation that undergo deep percolation, reaches the ground after some time (usually delayed flow) 4

Sources of runoff or stream flow
 The infiltrated water which percolates deeply and reaches the ground water storage in")
1) The infiltrated water which percolates deeply and reaches the ground water storage in the soil which follows a complicated and long path of travel and ultimately reaches the surface is called ground water run-off. 2) The ground water movement is very slow. 3) Based on the time delayed, runoff is classified as direct runoff and base flow. 4) Base flow consists of delayed interflow & ground water runoff. 6

Transpiration Evaporation Soil water Overland flow Interflow Groundwater accreditation Evapotranspiration Direct runoff

Water Flow Runoff Processes: Horton overland flow Subsurface storm flow, Return flow Groundwater flow

Time of Concentration is the time required by the water to reach the outlet from the most remote point of the drainage area Water balance of drainage basins
 Type of precipitation: rain contributes directly")
Factors affecting distribution of runoff in time: 1) Type of precipitation: rain contributes directly to runoff. Hail & sleet takes time to melt. 2) Rainfall intensity: heavy rainfall contribute directly & rapidly towards stream than lower intensity rainfall 3) Rainfall duration: if rainfall duration is equal to or greater than time of concentration, runoff will be more. Also at the starting infiltration capacity is more. 4) Rainfall distribution: a uniformly distributed rainfall volume may lead to delayed runoff. 5) Catchment factors: shape, roughness, storage, topography & soil type. 6) Slope: if slope is more, water moves faster. 7) Geology: fined grained compacted soil will yield more surface water. 8) Vegetation: vegetation slow down the movement of water. 9) Drainage network: closely spaced stream allow efficient drainage of precipitated water. 10
 Perennial stream: always carries some flow, ground water flow occurs")
Types of Streams: 1) Perennial stream: always carries some flow, ground water flow occurs during non precipitation period. 2) Intermittent: streams remain dry for most of dry month, limited contribution from the ground water. 3) Ephemeral: does not have any base flow contribution, streams becomes dry soon after the end of storm flow. Annual hydrograph shows series of short duration spikes marking flash flow. 11

12

16

17
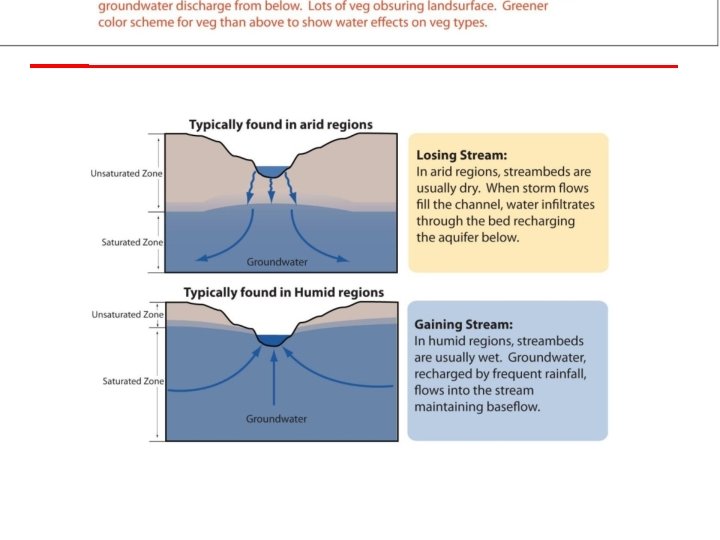
 Influent stream : If the ground water below the bed")
Types of Streams: 1) Influent stream : If the ground water below the bed of stream, the seepage from the stream feeds the ground water such a streams are called influent streams. Ephemeral streams. 2) Effluent stream : When GWT is above the water surface elevation in the stream , ground water feeds the streams such a stream is called effluent stream. Perennial streams. 15

19

20
 If due to previous rain, soil is already saturated, runoff will")
Antecedent Precipitation: 1) If due to previous rain, soil is already saturated, runoff will be more due to next rainfall. The previous rainfall is called Antecedent precipitation. 2) Antecedent Precipitation Index (API) is taken as a measure of the soil moisture conditions existing on the day of storm under consideration. It = K x I t-1 + Pt It = API of any Day t. K = constant known as Recession Factor. I t-1 =API of the day (t-1). Pt = the precipitation of t th day. 19

20
 Using Empirical Formulae such as Lacey, Inglis, Khosla, etc.")
Determination of Runoff : 1) Using Empirical Formulae such as Lacey, Inglis, Khosla, etc. 2) Using Curves & Tables. 3) Using Runoff Coefficient Method. 4) Using Infiltration Curves. 5) Using Water Shed Simulation Method. 6) Using Rainfall Runoff Correlation. 21
 In hydrological analysis & design, it is necessary to develop")
Rainfall Runoff Relationship: 1) In hydrological analysis & design, it is necessary to develop relations between precipitation & runoff. 2) Such relations are important & useful for extrapolation or interpolation of runoff records from the precipitation records which are generally available for longer periods. 3) These relations may estimates runoff of ungauged catchments. The equation between runoff & precipitation is R=ax. P+b The values of coefficient a & b are given by a = ( N ( ∑ P x R ) - ( ∑ P ) ( ∑ R ) ) / ( N ( ∑ P 2 ) - ( ∑ P 2 )) b=((∑R)-(ax∑P))/ N N = number of observation sets for R & P 22

Rainfall Runoff Relationship: The equation between runoff & precipitation is R=ax. P+b The values of coefficient a & b are given by a = ( N ( ∑ P x R ) - ( ∑ P ) ( ∑ R ) ) / ( N ( ∑ P 2 ) - ( ∑ P)2 ) b=((∑R)-(ax∑P))/ N N = number of observation sets for R & P The coefficient of correlation ‘r’ can be calculated by r = ( N ( ∑ P x R ) - ( ∑ P ) ( ∑ R ) ) / √((( N ( ∑ P 2 )) - ( ∑ P)2 ) x ( N ( ∑ R 2 ) – ( ∑R)2)) 23

24

25
 Binnie’s Percentages: developed for small catchment")
Empirical Equation: Ø Empirical runoff estimation formulae: 1) Binnie’s Percentages: developed for small catchment near to Nagpur. 2) Barlow’s Tables: developed for small catchment in UP. 3) Strange’s Table : developed for border areas of maharashtra and karnataka. 4) Inglis’s formula : developed for western India. 5) Khosla’s formula: developed for time period of the month. Khosla’s relationship for runoff estimation is given by Rm = Pm – Lm Lm = 0. 48 Tm ( Tm > 4. 5 OC ) Rm = monthly runoff in cm Pm = monthly rainfall in cm Lm = monthly losses in cm Tm = monthly temp. of catchment Annual runoff coefficient = annual runoff / annual rainfall. 26
 Khosla’s formula: developed for time period of the month. Khosla’s relationship")
Empirical Equation: 1) Khosla’s formula: developed for time period of the month. Khosla’s relationship for runoff estimation is given by Rm = Pm – Lm Lm = 0. 48 Tm ( Tm > 4. 5 OC ) Rm = monthly runoff in cm Pm = monthly rainfall in cm Lm = monthly losses in cm Tm = monthly temp. of catchment Annual runoff coefficient = annual runoff / annual rainfall. If Tm < 4. 5 OC TOC 4. 5 -1 -6. 5 -12 -18 Lm (cm) 2. 17 1. 78 1. 52 1. 25 1. 0 27
 For a catchment in UP, India, the monthly rainfall and temperature are given.")
1) For a catchment in UP, India, the monthly rainfall and temperature are given. Calculate the annual runoff coefficient by Khosla’s Formula. Month Temp. OC Rainfall in cm January 12 4 February 16 4 March 21 2 April 27 0 May 31 2 June 34 12 July 31 32 August 29 29 September 28 16 October 29 2 November 19 1 December 14 2 28

the annual runoff coefficient by Khosla’s Formula. Rm = Pm – Lm & Lm = 0. 48 Tm ( Tm > 4. 5 OC ) If the loss Lm is higher than Pm then Rm will be zero. Month Temp. OC (Tm) Rainfall (Pm) in cm Monthly Loss (Lm) in cm Runoff (Rm) in cm January 12 4 5. 76 0 February 16 4 7. 68 0 March 21 2 10. 08 0 April 27 0 12. 96 0 May 31 2 14. 88 0 June 34 12 16. 32 0 July 31 32 14. 88 17. 1 August 29 29 13. 92 15. 1 September 28 16 13. 44 2. 6 October 29 2 13. 92 0 November 19 1 9. 12 0 December 14 2 6. 72 0 29
 Rainfall (Pm) in cm Monthly Loss (Lm) in cm Runoff")
Month Temp. OC (Tm) Rainfall (Pm) in cm Monthly Loss (Lm) in cm Runoff (Rm) in cm January 12 4 5. 76 0 February 16 4 7. 68 0 March 21 2 10. 08 0 April 27 0 12. 96 0 May 31 2 14. 88 0 June 34 12 16. 32 0 July 31 32 14. 88 17. 1 August 29 29 13. 92 15. 1 September 28 16 13. 44 2. 6 October 29 2 13. 92 0 November 19 1 9. 12 0 December 14 2 6. 72 0 ∑ 106 34. 8 Annual Runoff coefficient = (annual runoff / annual rainfall) = 34. 8 / 106. 0 = 0. 328 30

Runoff Coefficients for the Rational Method Type Of Drainage Area Runoff Coefficient, C Steep, bare rock 0. 90 Rock, steep but wooded 0. 80 Plateaus lightly covered, ordinary ground bare 0. 70 Densely built up areas of cities with metal led roads & paths 0. 70 -0. 90 Residential areas not densely built up, with metal led roads 0. 50 -0. 70 Residential areas not densely built up, with unmetalled roads 0. 20 -0. 50 Clayey soils, stiff and bare 0. 60 Clayey soils lightly covered 0. 50 Loam, lightly cultivated or covered 0. 40 Loam, lightly, largely cultivated 0. 30 Suburbs with gardens, lawns and macadamized roads 0. 30 Sandy soil, light growth 0. 20 31

Area Velocity Method of Flood Measurement in River: Ø Most accurate method to measure discharge. Q=Ax. V A = Cross sectional are of flow & V = Average velocity of flow. Ø Involves obtaining information at a number of points over the cross section. Ø Points selected in a such way that the measurement are completed within reasonable quick time. Ø Dividing the flow area into a number of strips by means of verticals selected along the width of the river & measuring the depths at these verticals. Ø The velocities are also measured at one or more points on the verticals to obtain the mean velocity for any vertical. Ø The velocity at any point in the river is measured by inserting the current meter at that point facing the flow. Current Meter: - Cup type current meter & Propeller type current meter Ø Principle involved in meter is that the water flowing past the rotating element of the meter makes it revolve due to the unbalanced drag force acting on it and the speed of the rotating elements is directly proportional to the velocity of water. 32

Catchment: Ø Quantitative assessment of hydrological parameters like precipitation, evaporation, infiltration, runoff & their use in water balance studies or in problems of design and forecasting will be rational only when they are applied to an area with well defined boundaries. Ø Drainage basin or drainage area or catchment or watershed or river basin. Ø The area enclosed by the boundaries of the surface runoff system. Ø The line which divides the surface runoff between two adjacent river basins is called the topographic water divide or the watershed divide or simply the divide. Ø Based on area the watershed are classified as small, medium & large. Ø Small watershed is less than 250 km 2, Medium = 250 to 2500 km 2 & Large watershed exceeds 2500 km 2. Ø Depending on the land use the watershed may be referred as urban, agricultural, mountainous, forest, desert, coastal or marsh watershed or combination of two or more of them. 33
- Slides: 33