Engineering Hydrology ECIV 4323 CHAPTER TWO PRECIPITATION Instructor
 CHAPTER TWO PRECIPITATION Instructor: Dr. Yunes Mogheir 2015 -1")

 the atmosphere must have moisture, (ii) there must be")


 The probability of an event of exceedence probability")

 T is a characteristic time period")
/N Weibull")
 -46")


 1 16. 0 0. 043 23. 00 12 9. 0 0.")


 for Gaza City 24 h 18 h Return Period: 2 years")

 for Gaza City -54")
 where = mean of annual maximum rainfall series, σ =")
- Slides: 55
Engineering Hydrology (ECIV 4323) CHAPTER TWO PRECIPITATION Instructor: Dr. Yunes Mogheir 2015 -1
Precipitation The term precipitation denotes all forms of water that reach the earth from the atmosphere. The usual forms are rainfall, snowfall, hail, frost and dew -2
For precipitation to form (i) the atmosphere must have moisture, (ii) there must be sufficient nucleii present to aid condensation, (iii) weather conditions must be good for condensation of water vapour to take place, and (iv) the products of condensation must reach the earth -3
FORMS OF PRECIPITATION Rain The term rainfall is used to describe precipitations in the form of water drops of sizes larger than 0. 5 mm. The maximum size of a raindrop is about 6 mm -4
FORMS OF PRECIPITATION Snow is another important form of precipitation. Snow consists of ice crystals which usually combine to form flakes. When new, snow has an initial density varying from 0. 06 to 0. 15 g/cm 3 and it is usual to assume an average density of 0. 1 g/cm 3. -5
FORMS OF PRECIPITATION Drizzle A fine sprinkle of numerous water droplets of size less than 0. 5 mm and intensity less than 1 mm/h is known as drizzle. In this the drops are so small that they appear to float in the air. -6
FORMS OF PRECIPITATION Glaze When rain or drizzle comes in contact with cold ground at around 00 C, the water drops freeze to form an ice coating called glaze or freezing rain. -7
FORMS OF PRECIPITATION Sleet It is frozen raindrops of transparent grains which form when rain falls through air at subfreezing temperature. In Britain, sleet denotes precipitation of snow and rain simultaneously. -8
FORMS OF PRECIPITATION Hail It is a showery precipitation in the form of irregular pellets or lumps of ice of size more than 8 mm. Hails occur in violent thunderstorms in which vertical currents are very strong. -9
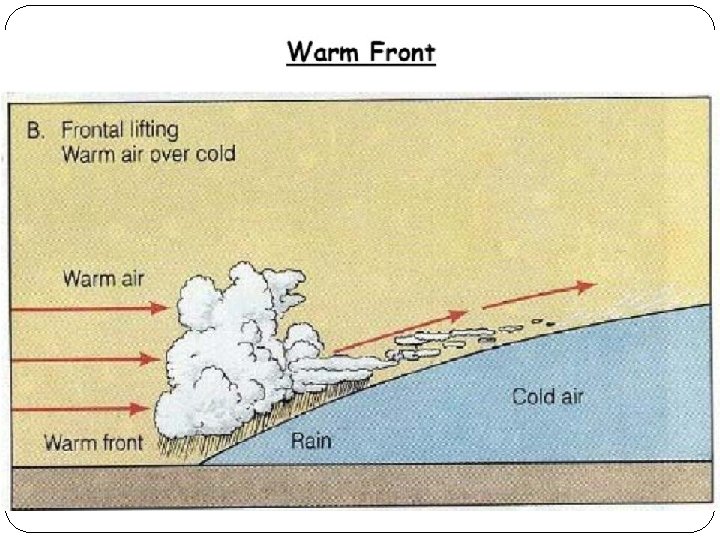
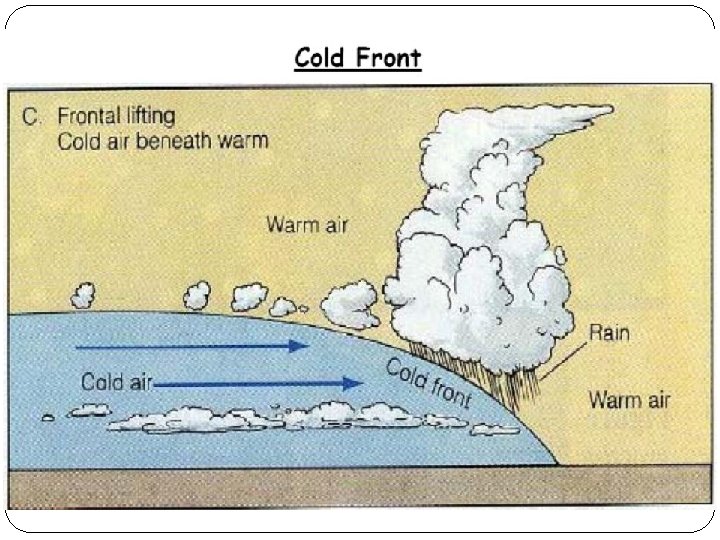
WEATHER SYSTEMS FOR PRECIPITATION Front A front is the interface between two distinct air masses. Under certain favorable conditions when a warm air mass and cold air mass meet, the warmer air mass is lifted over the colder one with the formation of a front. The ascending warmer air cools adiabatically with the consequent formation of clouds and precipitation. -10
WEATHER SYSTEMS FOR PRECIPITATION Cyclone A cyclone is a large low pressure region with circular wind motion. Two types of cyclones are recognized: tropical cyclones and extratropical cyclones. -13
WEATHER SYSTEMS FOR PRECIPITATION Convective Precipitation In this type of precipitation a packet of air which is warmer than the surrounding air due to localized heating rises because of its lesser density. Air from cooler surroundings flows to take up its place thus setting up a convective cell. The warm air continues to rise, undergoes cooling and results in precipitation. -14
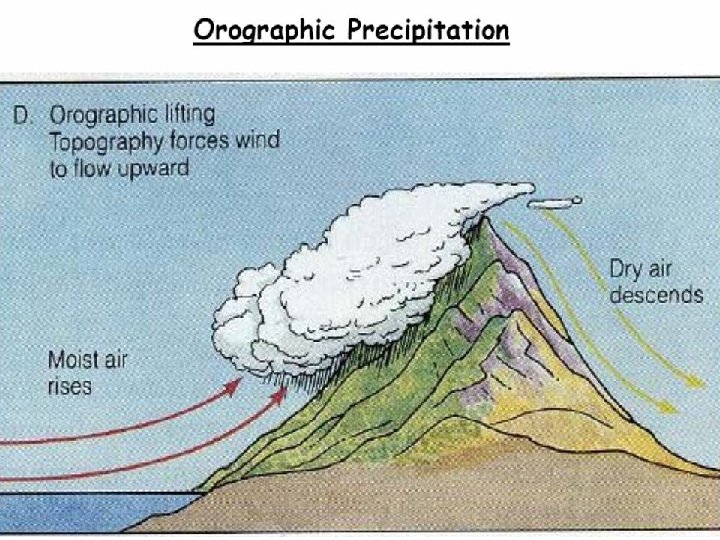
WEATHER SYSTEMS FOR PRECIPITATION Orographic Precipitation The moist air masses may get lifted-up to higher altitudes due to the presence of mountain barriers and consequently undergo cooling, condensation and precipitation. Such a precipitation is known as Orographic precipitation -15
MEASUREMENT Precipitation is expressed in terms of the depth to which rainfall water would stand on an area if all the rain were collected on it. Thus 1 cm of rainfall over a catchment area of 1 km represents a volume of water equal to 104 m 3 The precipitation is collected and measured in a raingauge -17
Rain gauge Setting For setting a rain gauge the following considerations are important: 1. The ground must be level and in the open and the instrument must present a horizontal catch surface. 2. The gauge must be set as near the ground as possible to reduce wind effects. 3. The instrument must be surrounded by an open fenced area of at least 5. 5 m x 5. 5 m. No object should be nearer to the instrument than 30 m or twice the height of the obstruction. -18
Non-recording Gauges -19
Recording Gauges Tipping—Bucket Type Weighing—Bucket Type Natural—Syphon Type -20
Recording Gauges Telermetering Raingauges Radar Measurement of Rainfall where Pr = average echopower, Z = radar-echo factor, r = distance to target volume and C = a constant Generally the factor Z is related to the intensity of rainfall as Z=a. Ib -21
RAINGAUGE NETWORK 1. In flat regions of temperate, Mediterranean and tropical zones: ideal – 1 station for 600 – 900 km 2 acceptable – 1 station for 900 – 3000 km 2 2. in mountainous regions of temperate, Mediterranean and topical zones: ideal - 1 station for 100— 250 km 2 acceptable - 1 station for 250— 1000 km 2 3. in arid and polar zones: I station for 1500—l 0, 000 km 2 depending on the feasibility. -22
Adequacy of Rain gauge Stations where N = optimal number of stations, ε = allowable degree of error in the estimate of the mean rainfall and Cv = coefficient of variation of the rainfall values at the existing m stations (in per cent) -23
Adequacy of Rain gauge Stations Pi = precipitation magnitude in the i 4 th station -24
EXAMPLE A catchment has six rain gauge stations. In a year, the annual rainfall recorded by the gauges are as follows: - Station Rainfall (cm) A B C D E 82. 6 102. 9 180. 3 98. 8 136. 7 For a 10% error in the estimation of the mean rainfall, calculate the optimum number of stations in the catchment Solution: - from first data -25
PREPARATION OF DATA Estimation of Missing Data Given the annual precipitation values, P 1, P 2, P 3, . Pm at neighbouring M stations 1, 2, 3 M respectively, it is required to find the missing annual precipitation P. at a station X not included in the above M stations If the normal annual precipitations at various stations are within about 10% of the normal annual precipitation at station X: -26
PREPARATION OF DATA Estimation of Missing Data If the normal precipitations vary considerably -27
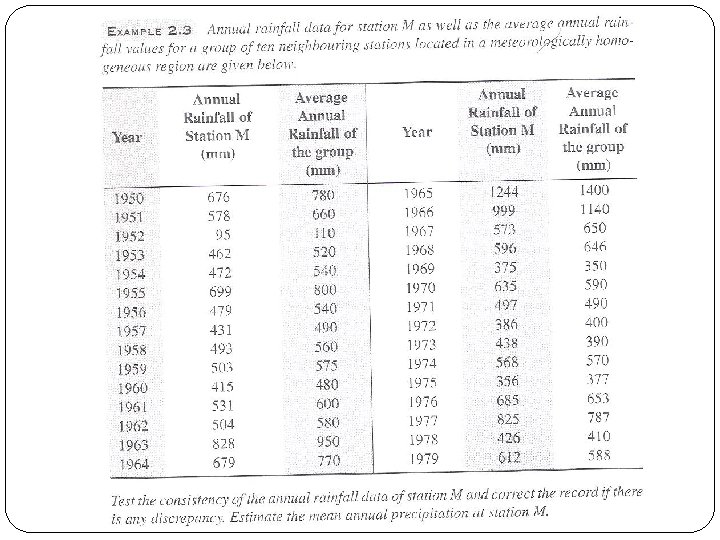
PREPARATION OF DATA Test for Consistency of Record Some of the common causes for inconsistency of record are: (i) shifting of a rain gauge station to a new location, (ii) the neighborhoods of the station undergoing a marked change, (iii) change in the ecosystem due to calamities, such as forest fires, land slides, and (iv) occurrence of observational error from a certain date -28
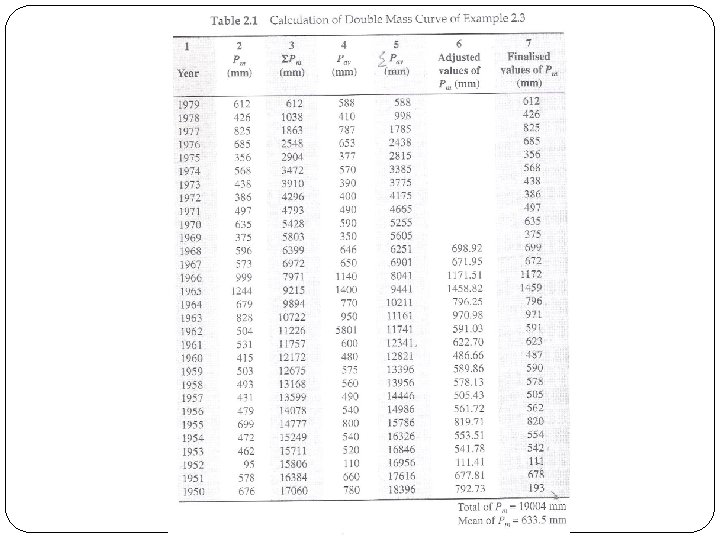
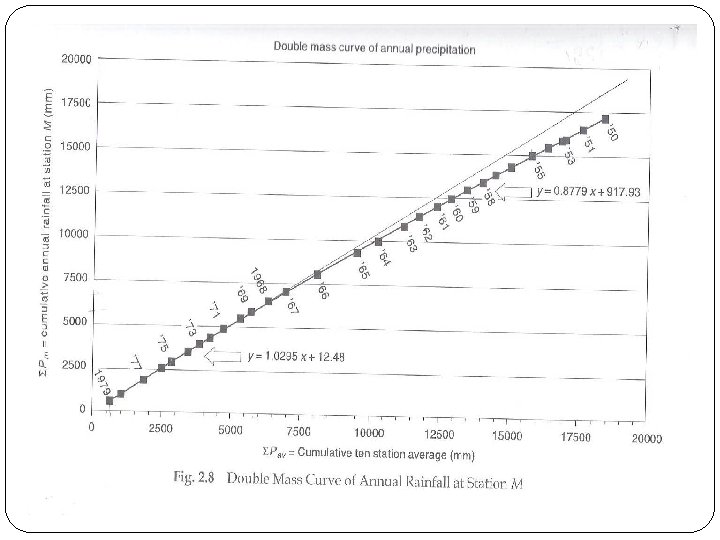
PREPARATION OF DATA Accumulated Annual Rainfall at x ΣP in units of l 03 cm Test for Consistency of Record -29 Accumulated Annual Rainfall of 10 station Mean ΣP in units of l 03 cm
PRESENTATION OF RAINFALL DATA Mass Curve of Rainfall -33
PRESENTATION OF RAINFALL DATA Hyetograph See also Example 2. 9 Page 47 -34
MEAN PRECIPITATION OVER AN AREA Arithmetical—Mean Method -35
MEAN PRECIPITATION OVER AN AREA Thiessen-Mean Method -36
MEAN PRECIPITATION OVER AN AREA Isohyetal Method -37
-38
DEPTH- AREA—DURATION RELATIONSHIPS Depth-Area Relation where P = average depth in cms over an area A km 2, Po = highest amount of rainfall in cm at the storm centre and K and n are constants for a given region -39
DEPTH-AREA—DURATION RELATIONSHIPS Maximum Depth-Area-Duration Curves -40
FREQUENCY OF POINT RAINFALL If the probability of an event occurring is P, the probability of the event not occurring in a given year is q= (1 - P) where Pr, n = probability of a random hydrologic event (rainfall) of given magnitude and exceedence probability P occurring r times in n successive years -41
FREQUENCY OF POINT RAINFALL example, (a) The probability of an event of exceedence probability P occurring 2 times in n successive years is (b) The probability of the event not occurring at all in , successive years is (c) The probability of the event occurring at least once in n successive years -42
FREQUENCY OF POINT RAINFALL 0. 0323 -43
T : Return Period or Recurrence interval (Years) T is a characteristic time period called interval of occurrence or return period to be defined as the number of years until the considered Maximum Rainfall X equals or exceeds a specified value x only once. For example the return period of 280 mm rainfall is 50 years is by definition 280 mm rainfall may occur on average only once in 50 years. This does not imply necessarily that the above rainfall value (280 mm) will occur only after 50 years: it may occur next year or several times in the next 50 years or not at all for 100 years. -44
FREQUENCY OF POINT RAINFALL Plotting Position Method P California m/N Hazen (m-0. 5)/N Weibull m/(N+1) Chegodayev (m-0. 3)/(N+0. 4) Blom (m-0. 44)/(N+0. 12) Gringorten (m-3/8)/(N+1/4) -45
FREQUENCY OF POINT RAINFALL T : Return Period or Recurrence interval (Years) -46
For a station A, the recorded annual 24 h maximum rain fall are given below. (a) Estimate the 24 h maximum rainfall with return period of 13 and 50 year. (b) What would be the probability of a ran fall of magnitude equal to or exceeding 10 cm occurring in 24 h at station A. -47
ANNUAL MAXIMUM 24 h RAINFALL AT STATION A Year 1950 1951 1952 1953 1954 1955 1956 1957 1958 1959 1960 1961 13. 0 12. 0 7. 6 14. 3 16. 0 9. 6 8. 0 12. 5 11. 2 8. 9 7. 8 1962 1963 1964 1965 1966 1967 1968 1969 1970 1971 9. 0 10. 2 8. 5 7. 5 6. 0 8. 4 10. 8 10. 6 8. 3 9. 5 Rain-Fall cm Year Rain-Fall cm -48
m Rainfall (cm) 1 16. 0 0. 043 23. 00 12 9. 0 0. 522 2 14. 3 0. 087 11. 50 13 8. 9 - 3 13. 0 0. 013 7. 67 14 8. 9 0. 609 1. 64 4 12. 5 0. 174 5. 75 15 8. 5 0. 652 1. 53 5 12. 0 0. 217 4. 60 16 8. 4 0. 696 1. 44 6 11. 2 0. 261 3. 83 17 8. 3 0. 739 1. 35 7 10. 8 0. 304 3. 29 18 8. 0 0. 783 1. 28 8 10. 6 0. 348 2. 88 19 7. 8 0. 826 1. 21 9 10. 2 0. 391 2. 56 20 7. 6 0. 870 1. 15 10 9. 6 0. 435 2. 30 21 7. 5 0. 913 1. 10 11 9. 5 0. 478 2. 09 22 6. 0 0. 957 1. 05 Probability Return period T=1/P Years m Rainfall (cm) Probability Return period T=1/P Years 1. 92 - -49
INTENSITY-DURATION-FREQUENCY RELATIONSHIP where K, x, a and n are constants for a given catchment -50
INTENSITY-DURATION-FREQUENCY RELATIONSHIP Go to Example 2 and 3 in the excel sheet (Example_CH 2 -new) -51
DEPTH-DURATION-FREQUENCY RELATIONSHIP (DDF) for Gaza City 24 h 18 h Return Period: 2 years - a: 4. 06 - b: -0. 636 12 h 6 h 3 h 2 h 1 h 30 min 15 min 57. 3 51. 6 44. 5 24 h 18 h 34. 6 26. 9 23. 2 18. 0 14. 0 10. 9 7. 3 ﺍﻷﻤﻄﺎﺭ Return Period: 5 years - a: 6. 18 - b: 0. 649 12 h 6 h 3 h 2 h 1 h 30 min 15 min ﺍﻟﻔﺘﺮﺓ 79. 4 71. 7 62. 2 24 h 18 h 48. 8 38. 2 33. 2 26. 0 20. 4 16. 0 10. 9 ﺍﻷﻤﻄﺎﺭ Return Period: 10 years - a: 7. 95 - b: 0. 660 12 h 6 h 3 h 2 h 1 h 30 min 15 min ﺍﻟﻔﺘﺮﺓ 94. 2 85. 5 74. 4 24 h 18 h 58. 8 46. 5 40. 5 32. 0 25. 3 20. 0 13. 7 ﺍﻷﻤﻄﺎﺭ Return Period: 20 years - a: 9. 39 - b: 0. 665 12 h 6 h 3 h 2 h 1 h 30 min 15 min ﺍﻟﻔﺘﺮﺓ 107. 3 97. 5 85. 1 24 h 18 h 126. 4 155. 1 24 h 18 h 100. 9 80. 5 64. 3 56. 4 45. 0 35. 9 28. 7 20. 1 ﺍﻷﻤﻄﺎﺭ Return Period: 100 years - a: 13. 60 - b: 0. 682 12 h 6 h 3 h 2 h 1 h 30 min 15 min ﺍﻟﻔﺘﺮﺓ 137. 4 125. 4 110. 2 ﺍﻟﻔﺘﺮﺓ 67. 5 53. 5 46. 7 37. 0 29. 3 23. 3 16. 1 ﺍﻷﻤﻄﺎﺭ Return Period: 50 years - a: 11. 89 - b: 0. 675 12 h 6 h 3 h 2 h 1 h 30 min 15 min ﺍﻟﻔﺘﺮﺓ 88. 4 70. 9 62. 3 50. 0 40. 1 32. 2 22. 7 ﺍﻷﻤﻄﺎﺭ -52
DDF Curve 30 Depth-Duration. Frequency for Return Period 2 Years 20 15 10 5 0 0 20 40 60 80 100 120 140 160 180 200 Duration (min) IDF Curve for 2 years Return Period 100 Intensity-Duration. Frequency for Return Period 2 Years intensity (mm/hr) Depth (mm) 25 80 60 40 20 0 0 20 40 60 80 100 120 140 160 180 200 Duration (min) -53
INTENSITY-DURATION-FREQUENCY RELATIONSHIP (IDF) for Gaza City -54
PROBABLE MAXIMUM PRECIPITATION (PMP) where = mean of annual maximum rainfall series, σ = standard deviation it the series and K = a frequency factor (Usually take a value close to 15) -55