
Energyefficient buildings Paul Linden Department of Mechanical and
Energy-efficient buildings Paul Linden Department of Mechanical and Aerospace Engineering University of California, San Diego
Outline • Wind-driven flow – – Historical perspective Environmental perspective Flow through an orifice Wind-driven flow through a building • Stack-driven flow – – The neutral level Thermal plumes Displacement ventilation produced by a single heat source Mixing ventilation • Underfloor air distribution – Non-uniform cooling – Flow in the plenum
Wind-driven flow – Historical perspective – Environmental perspective – Wind-driven flow through a building
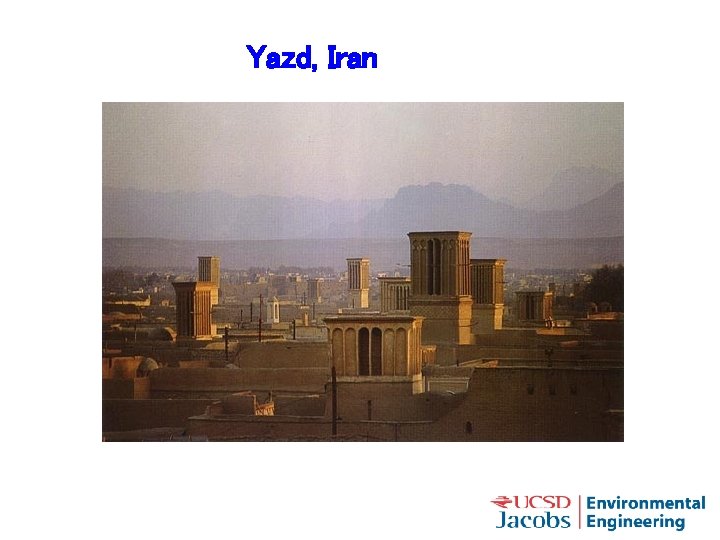
Yazd, Iran
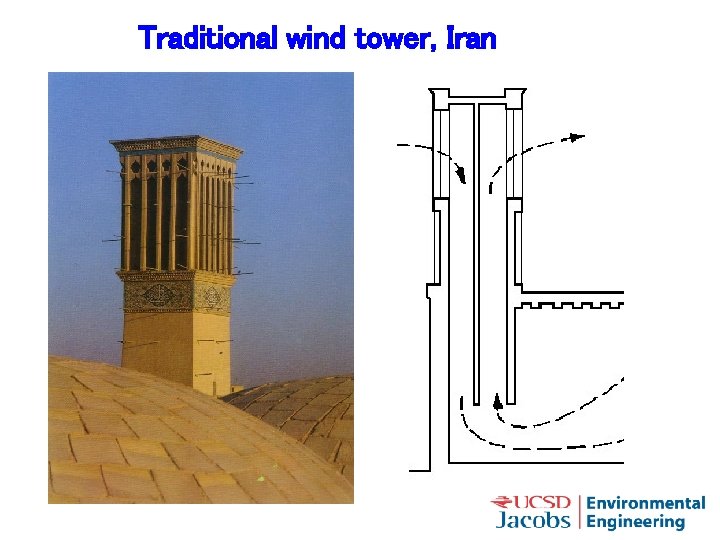
Traditional wind tower, Iran
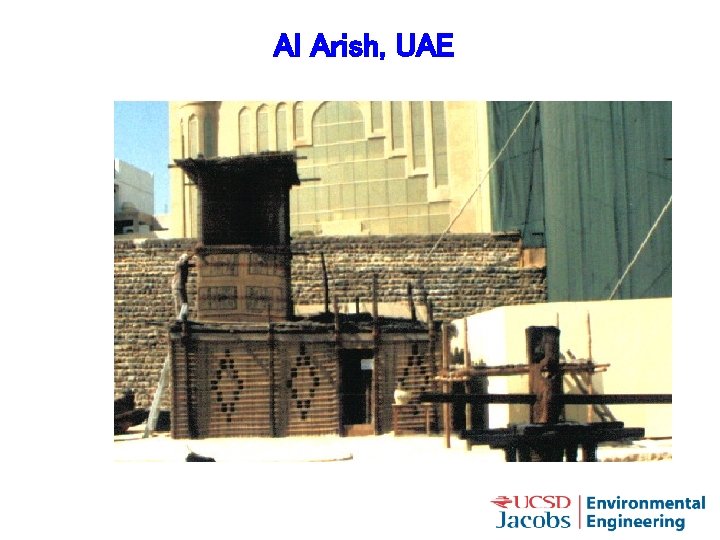
Al Arish, UAE
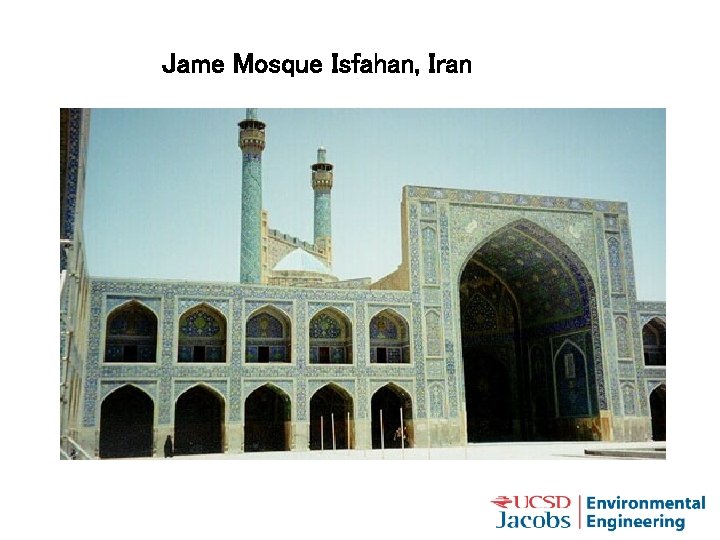
Jame Mosque Isfahan, Iran

Sheik Lotfollaf Mosque, Isfahan, Iran

Mai Hong Song, Thailand

Namwam banquet hall, Korea
Energy usage Over 10% of total annual energy consumption in the US is used in heating and cooling of buildings – at a cost > $100 B per annum In LA, more energy is used in buildings than in transport Built environment is responsible for > 30% of GHG emissions in US
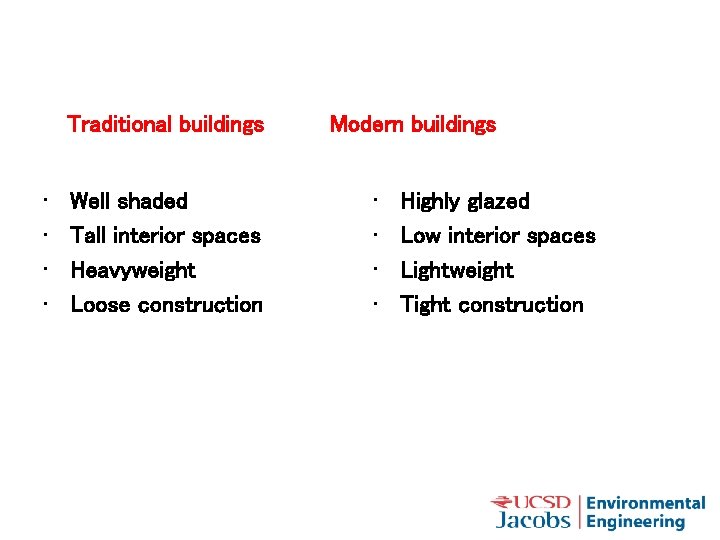
Traditional buildings • • Well shaded Tall interior spaces Heavyweight Loose construction Modern buildings • • Highly glazed Low interior spaces Lightweight Tight construction
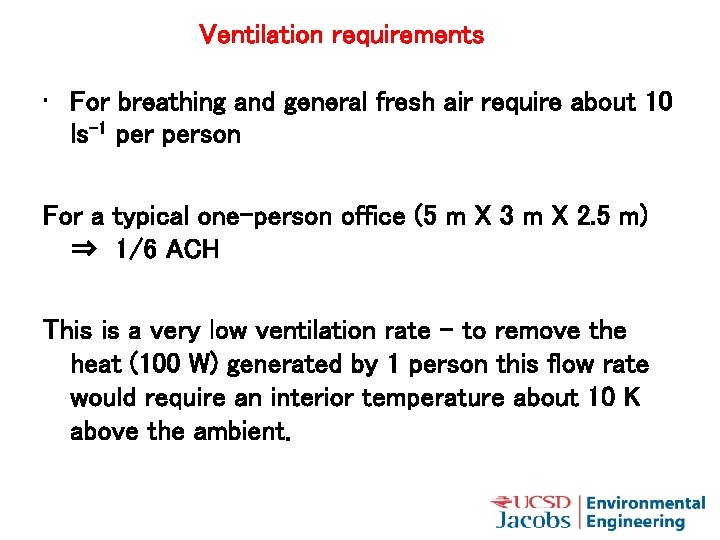
Ventilation requirements • For breathing and general fresh air require about 10 ls-1 person For a typical one-person office (5 m X 3 m X 2. 5 m) ⇒ 1/6 ACH This is a very low ventilation rate – to remove the heat (100 W) generated by 1 person this flow rate would require an interior temperature about 10 K above the ambient.
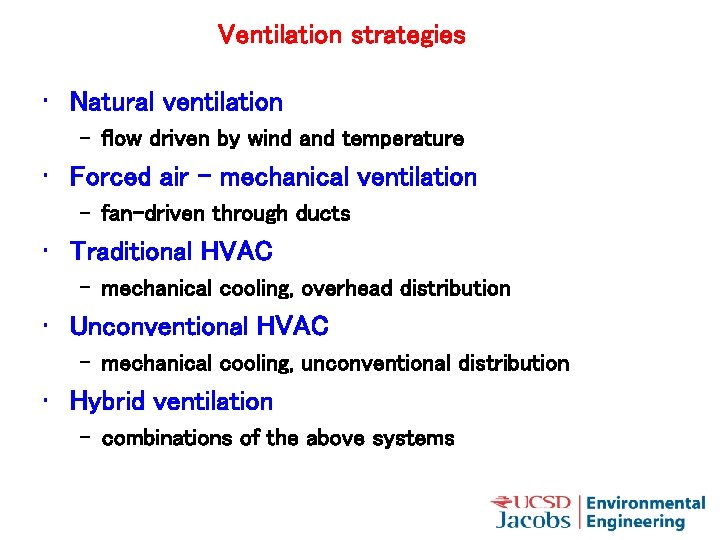
Ventilation strategies • Natural ventilation – flow driven by wind and temperature • Forced air – mechanical ventilation – fan-driven through ducts • Traditional HVAC – mechanical cooling, overhead distribution • Unconventional HVAC – mechanical cooling, unconventional distribution • Hybrid ventilation – combinations of the above systems
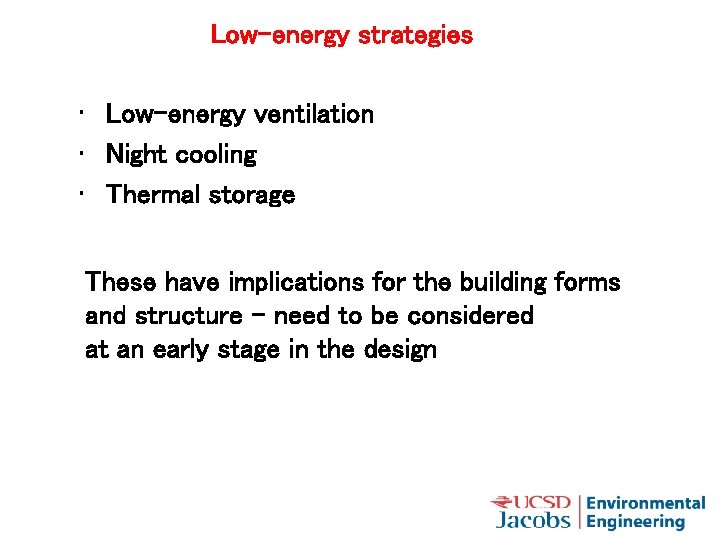
Low-energy strategies • Low-energy ventilation • Night cooling • Thermal storage These have implications for the building forms and structure – need to be considered at an early stage in the design
Natural Ventilation driven by natural pressure forces • wind • buoyancy - due to temperature differences; the ‘stack effect’ A temperature difference of 50 C across a doorway 2 m high will give a flow of 0. 1 ms-1
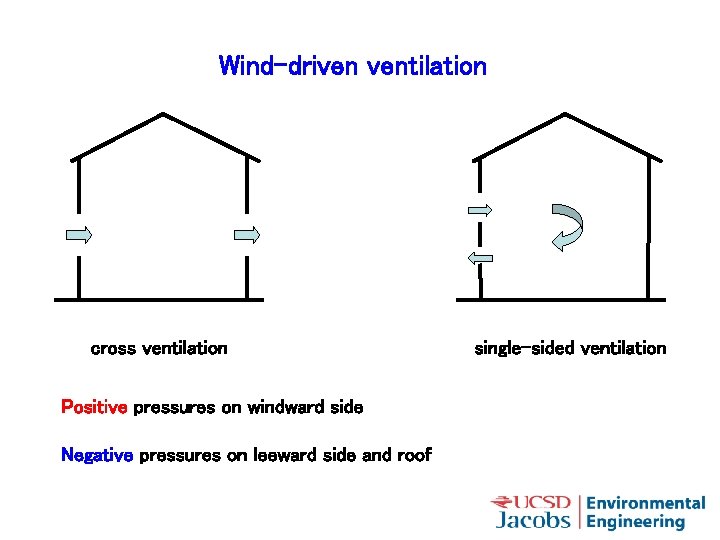
Wind-driven ventilation cross ventilation Positive pressures on windward side Negative pressures on leeward side and roof single-sided ventilation
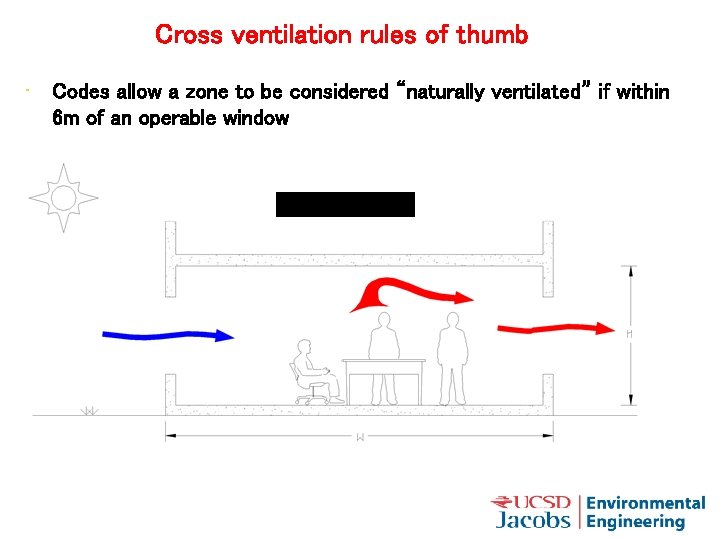
Cross ventilation rules of thumb • Codes allow a zone to be considered “naturally ventilated” if within 6 m of an operable window
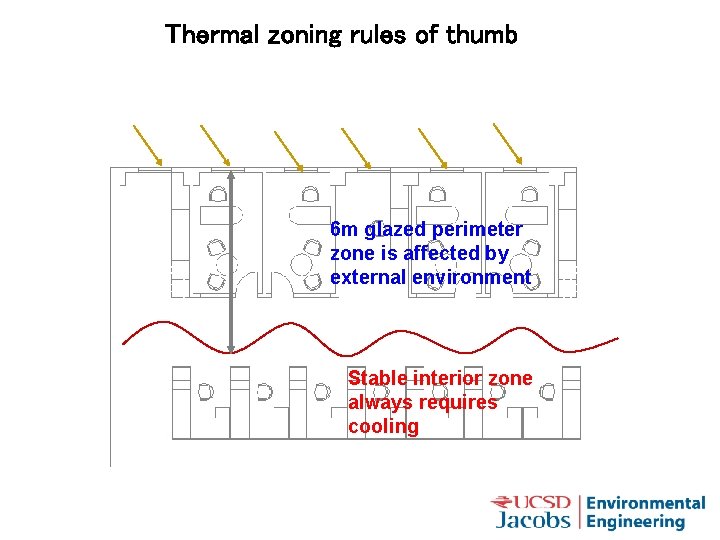
Thermal zoning rules of thumb 6 m glazed perimeter zone is affected by external environment Stable interior zone always requires cooling
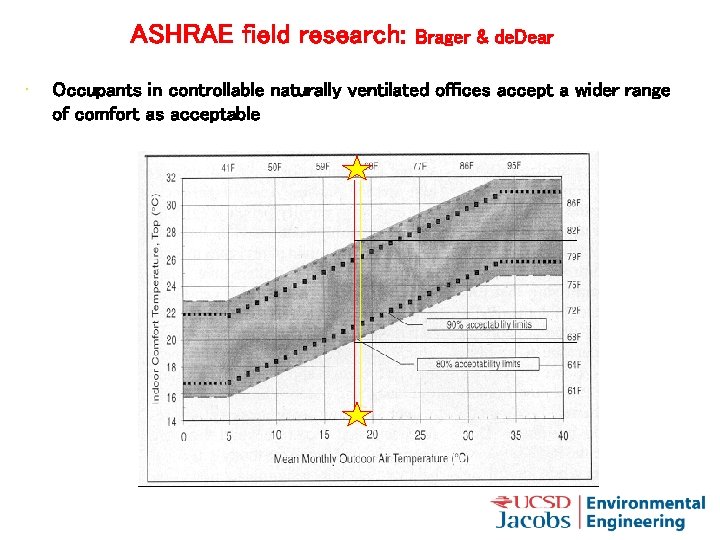
ASHRAE field research: • Brager & de. Dear Occupants in controllable naturally ventilated offices accept a wider range of comfort as acceptable
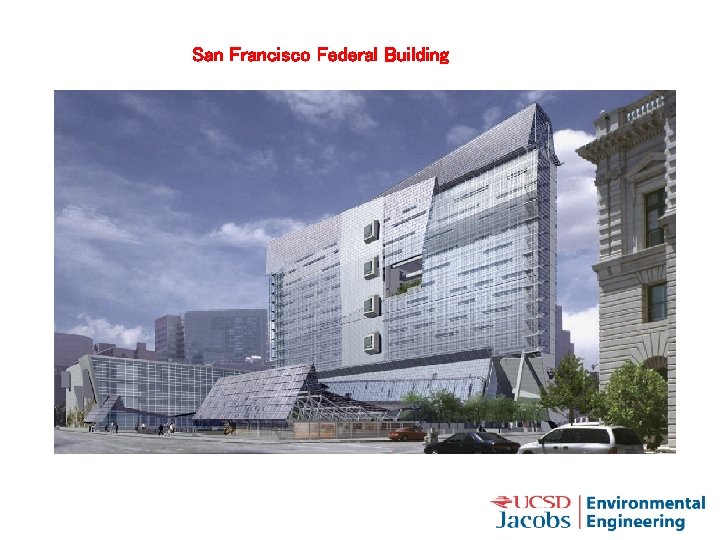
San Francisco Federal Building
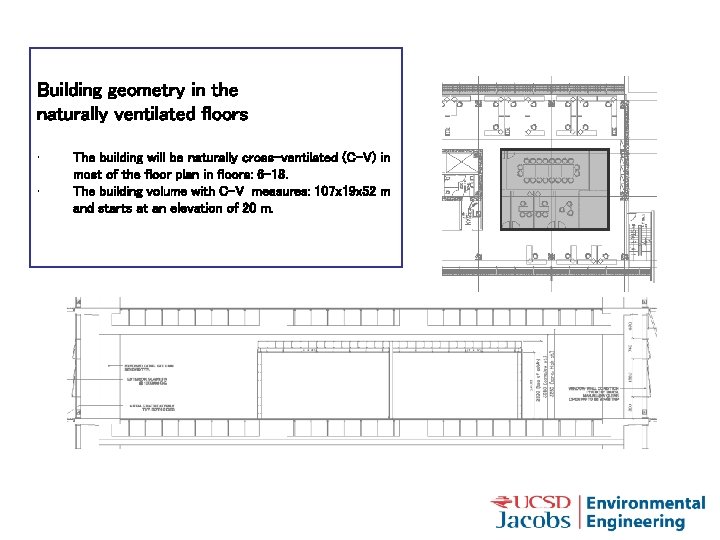
Building geometry in the naturally ventilated floors • • The building will be naturally cross-ventilated (C-V) in most of the floor plan in floors: 6 -18. The building volume with C-V measures: 107 x 19 x 52 m and starts at an elevation of 20 m.
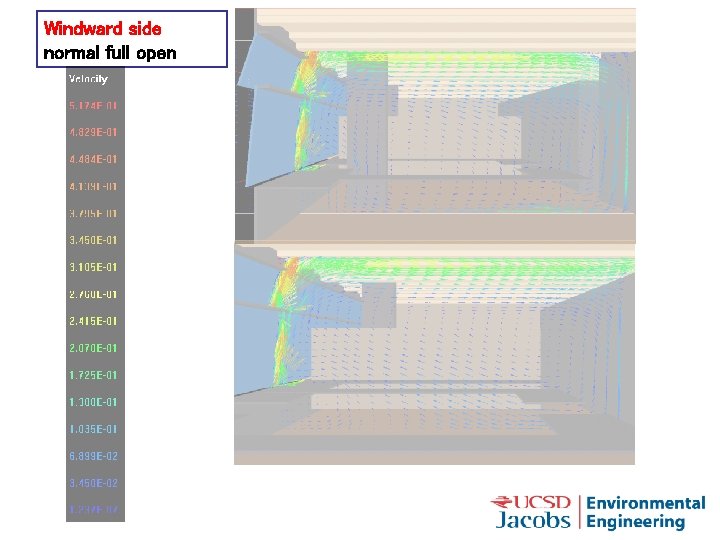
Windward side normal full open
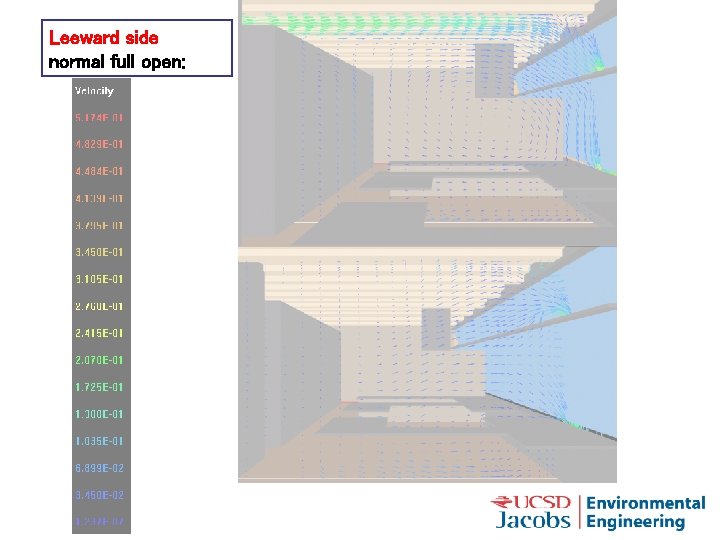
Leeward side normal full open:
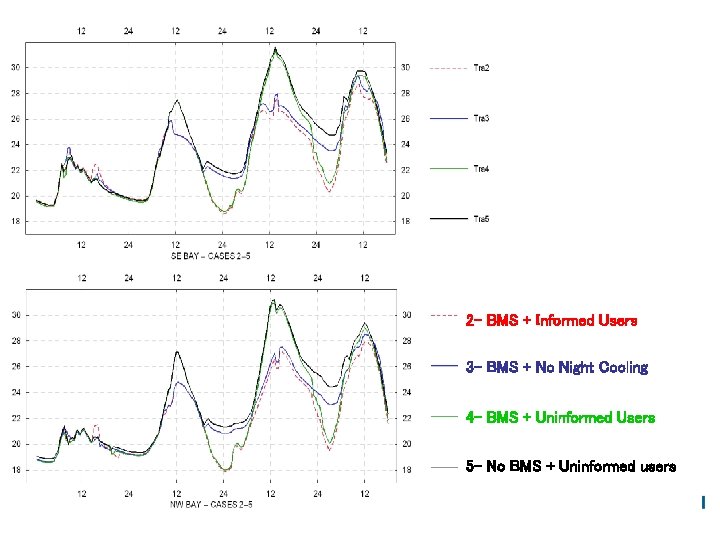
2 - BMS + Informed Users 3 - BMS + No Night Cooling 4 - BMS + Uninformed Users 5 - No BMS + Uninformed users
Stack-driven ventilation – The neutral level – Thermal plumes – Displacement ventilation produced by a single heat source – Mixing ventilation
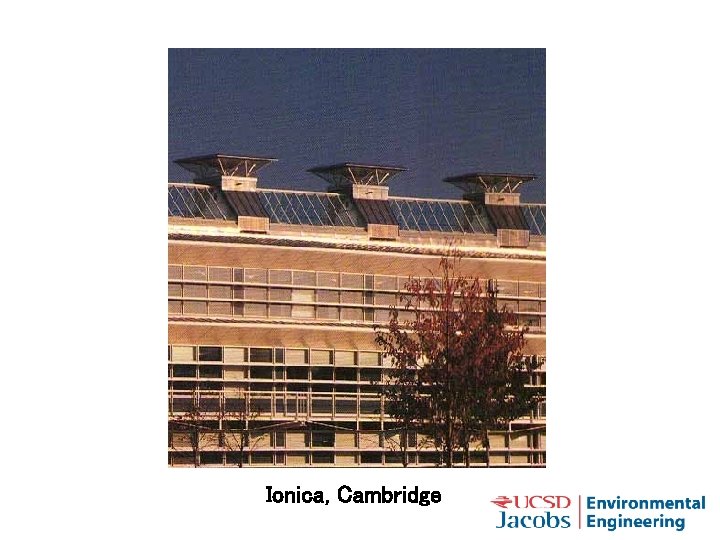
Ionica, Cambridge
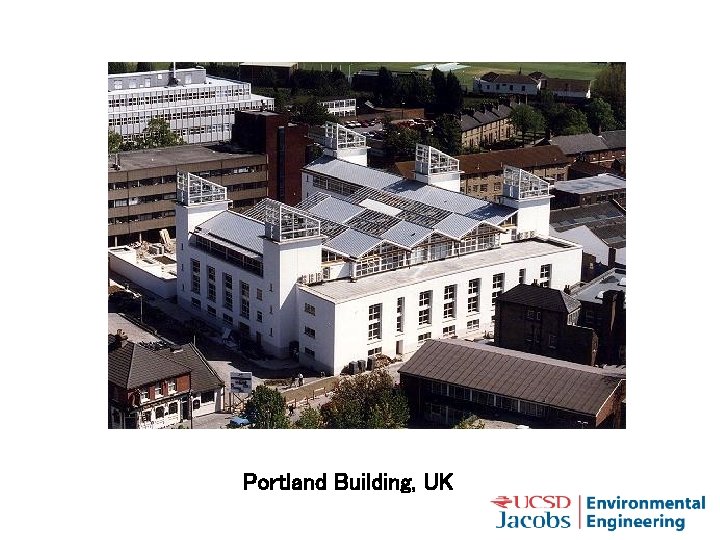
Portland Building, UK
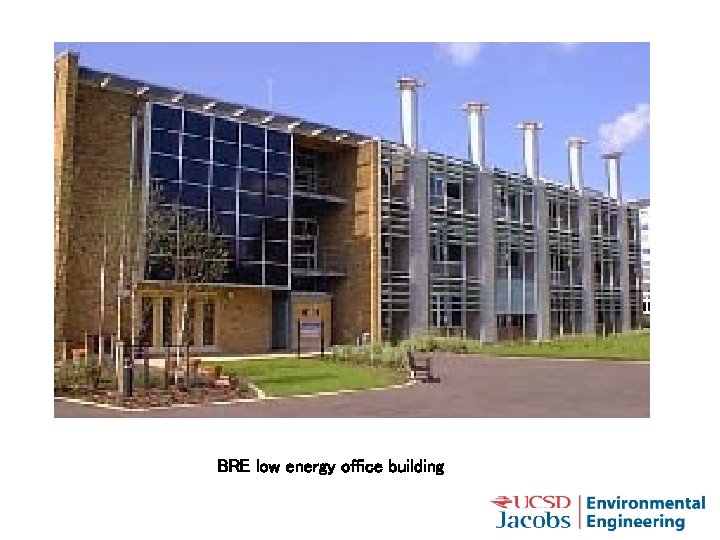
BRE low energy office building
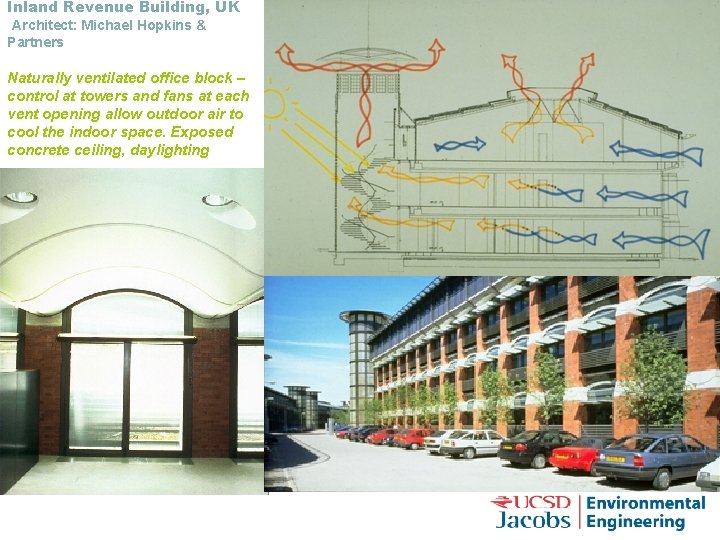
Inland Revenue Building, UK Architect: Michael Hopkins & Partners Naturally ventilated office block – control at towers and fans at each vent opening allow outdoor air to cool the indoor space. Exposed concrete ceiling, daylighting
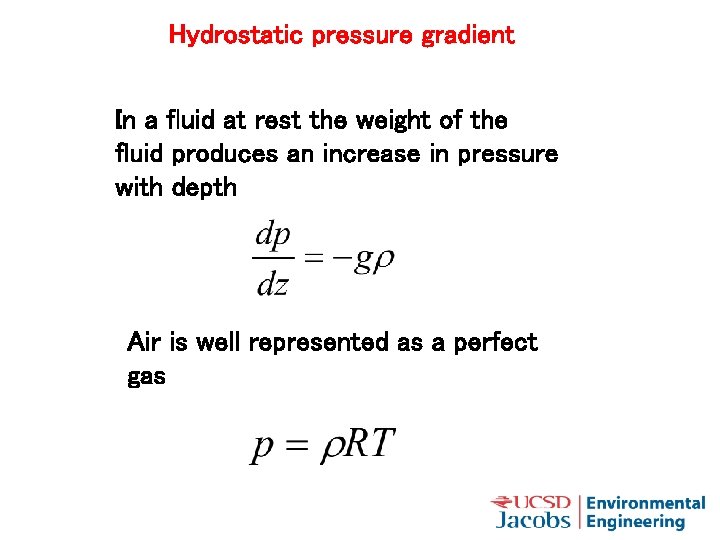
Hydrostatic pressure gradient In a fluid at rest the weight of the fluid produces an increase in pressure with depth Air is well represented as a perfect gas
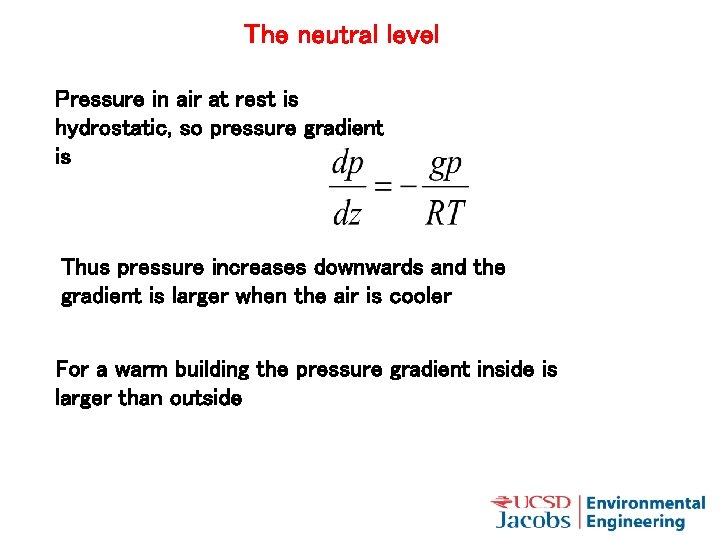
The neutral level Pressure in air at rest is hydrostatic, so pressure gradient is Thus pressure increases downwards and the gradient is larger when the air is cooler For a warm building the pressure gradient inside is larger than outside
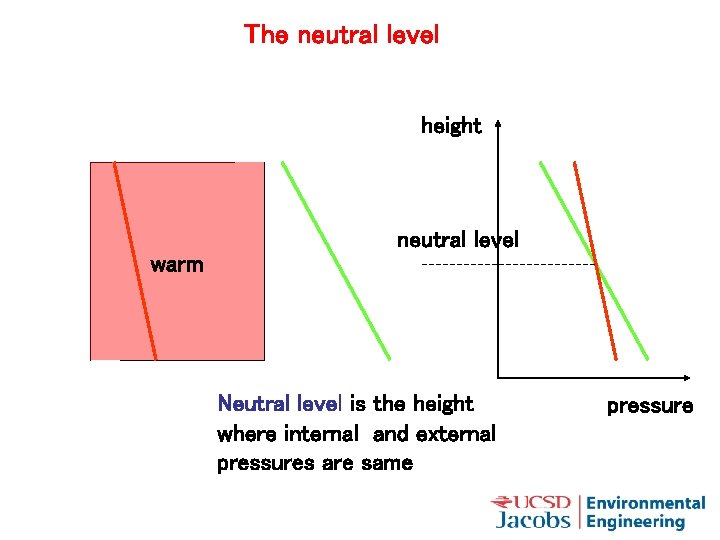
The neutral level height neutral level warm Neutral level is the height where internal and external pressures are same pressure
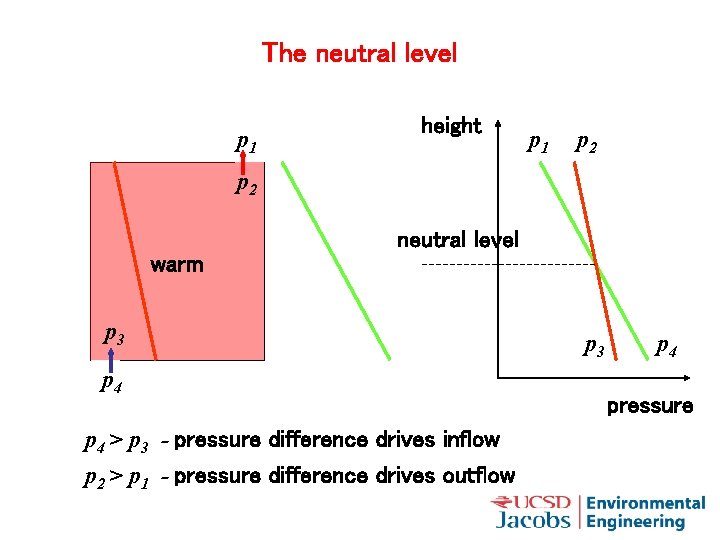
The neutral level p 1 height p 1 p 2 neutral level warm p 3 p 4 > p 3 - pressure difference drives inflow p 2 > p 1 - pressure difference drives outflow p 3 p 4 pressure
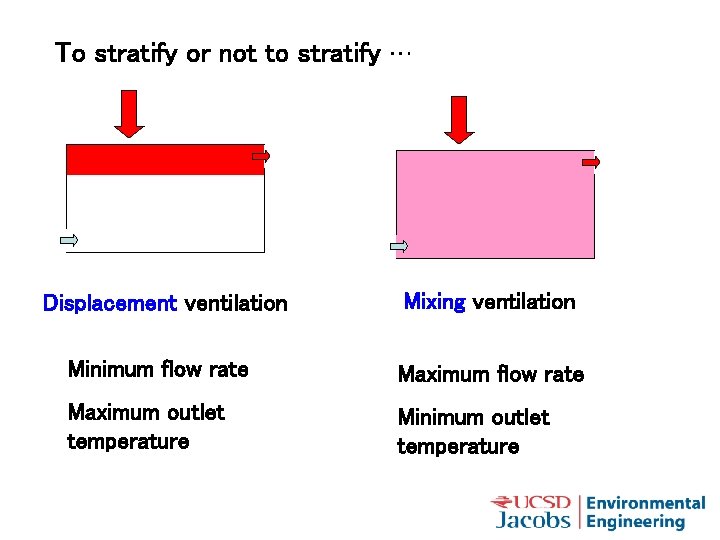
To stratify or not to stratify … Displacement ventilation Mixing ventilation Minimum flow rate Maximum outlet temperature Minimum outlet temperature
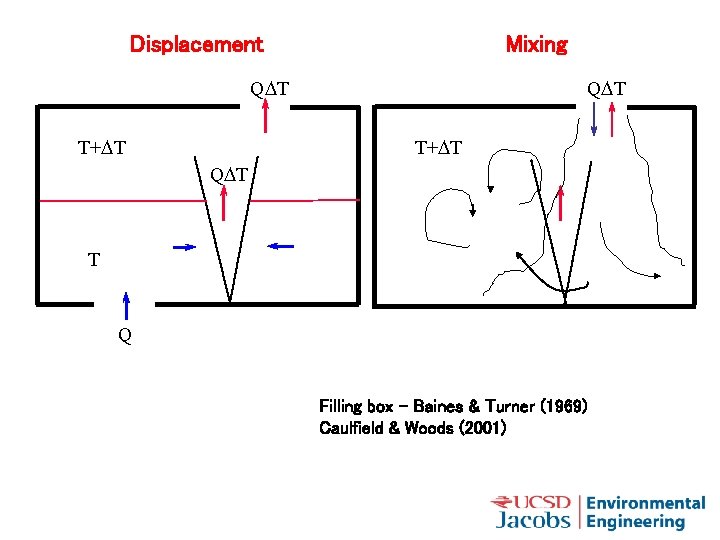
Displacement Mixing QDT T+DT QDT T Q Filling box – Baines & Turner (1969) Caulfield & Woods (2001)
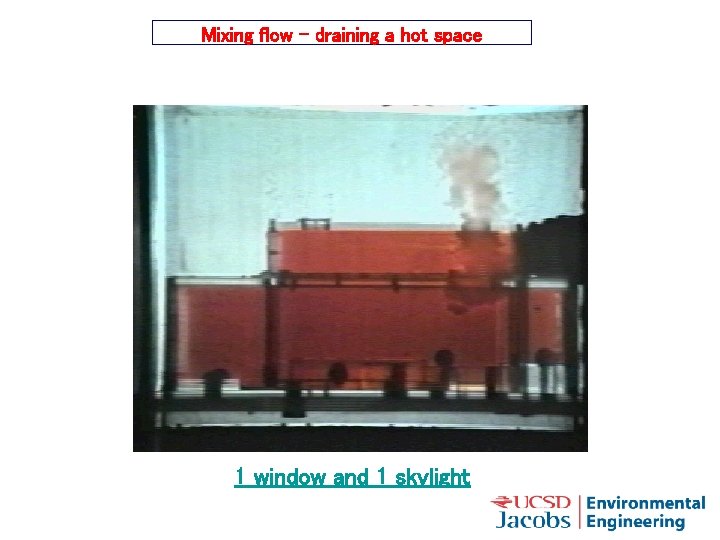
Mixing flow – draining a hot space 1 window and 1 skylight
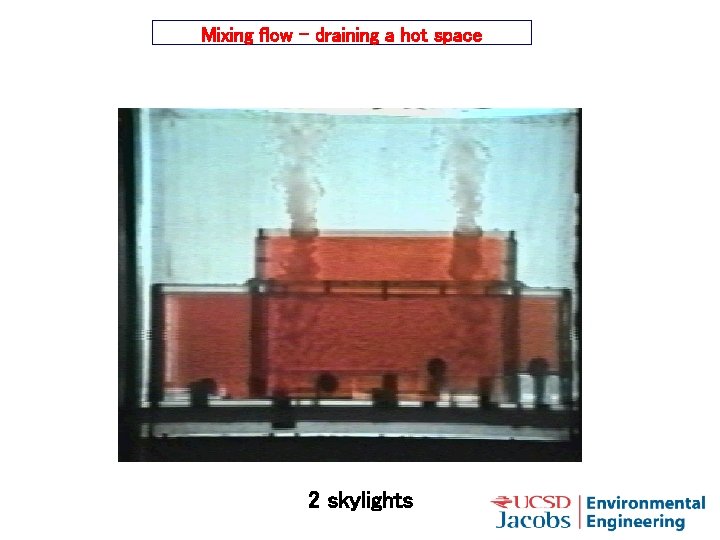
Mixing flow – draining a hot space 2 skylights
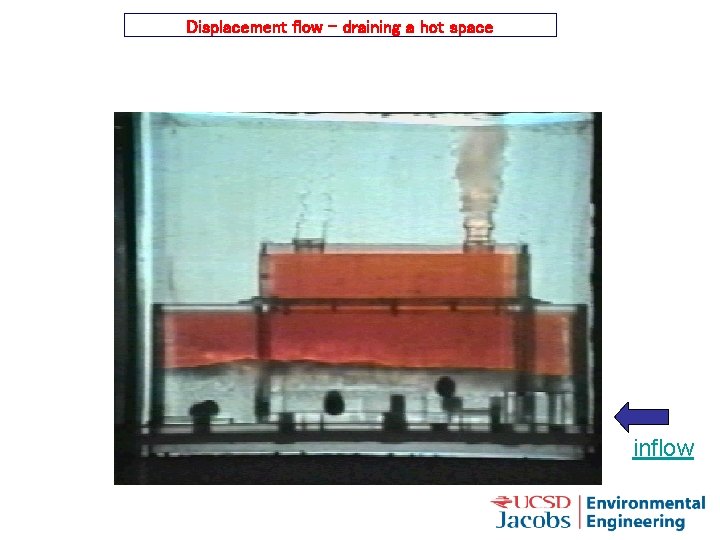
Displacement flow – draining a hot space inflow
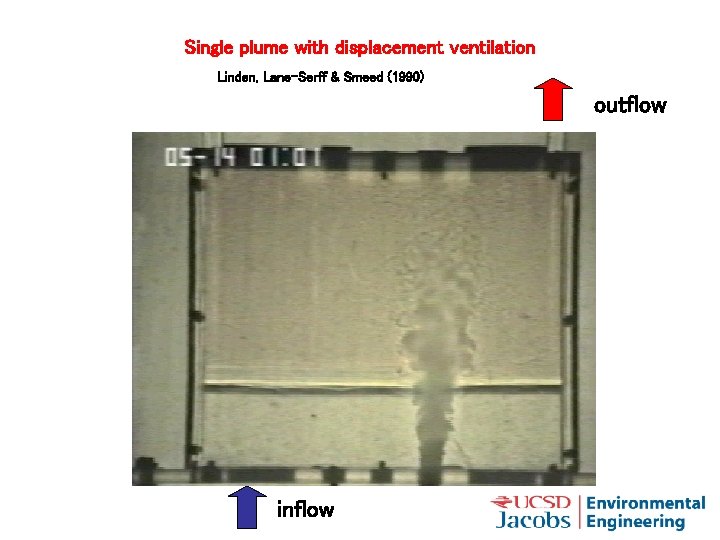
Single plume with displacement ventilation Linden, Lane-Serff & Smeed (1990) outflow inflow
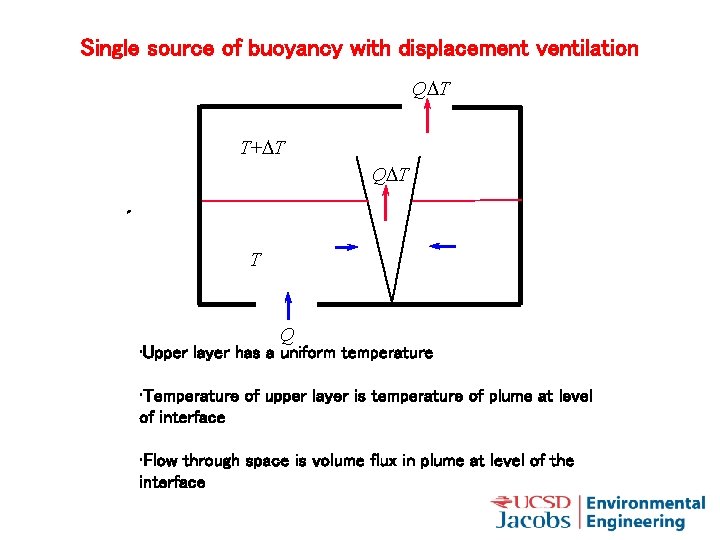
Single source of buoyancy with displacement ventilation QDT T+DT QDT T Q • Upper layer has a uniform temperature • Temperature of upper layer is temperature of plume at level of interface • Flow through space is volume flux in plume at level of the interface
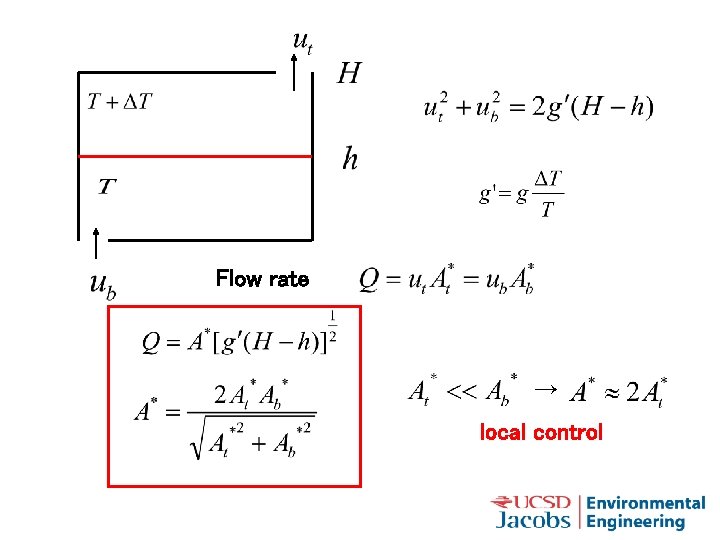
Flow rate → local control
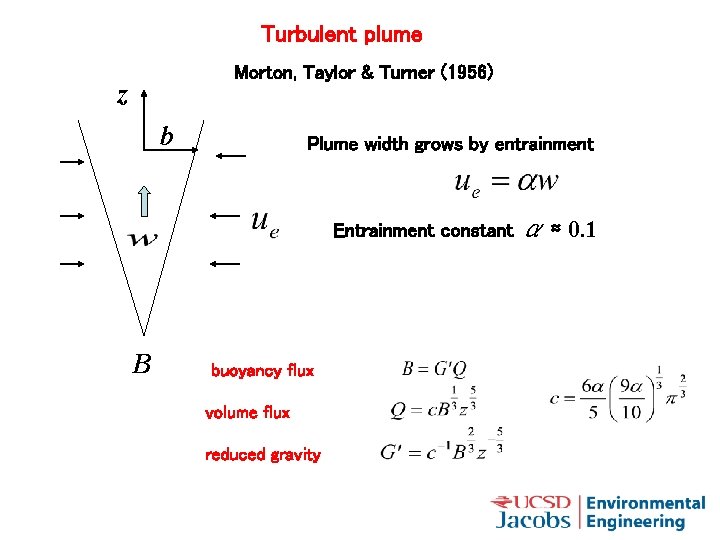
Turbulent plume Morton, Taylor & Turner (1956) z b Plume width grows by entrainment Entrainment constant B buoyancy flux volume flux reduced gravity α ≈ 0. 1
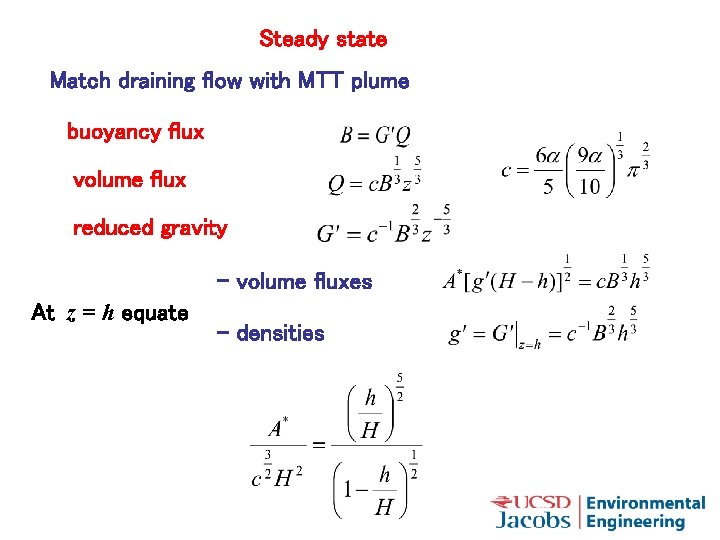
Steady state Match draining flow with MTT plume buoyancy flux volume flux reduced gravity - volume fluxes At z = h equate - densities

Children’s Museum, San Diego
Underfloor air distribution (UFAD) • Cooling part of the space • Effect on IAQ • Plenum flow
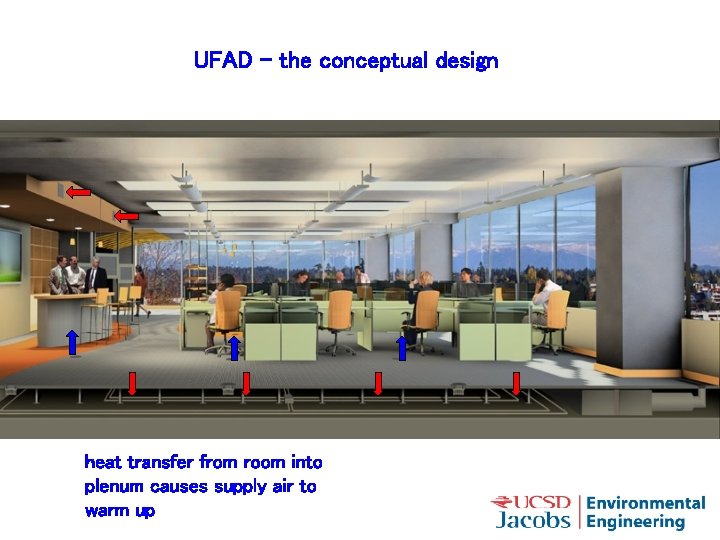
Technology Overview UFAD – the conceptual design Concept heat transfer from room into plenum causes supply air to warm up
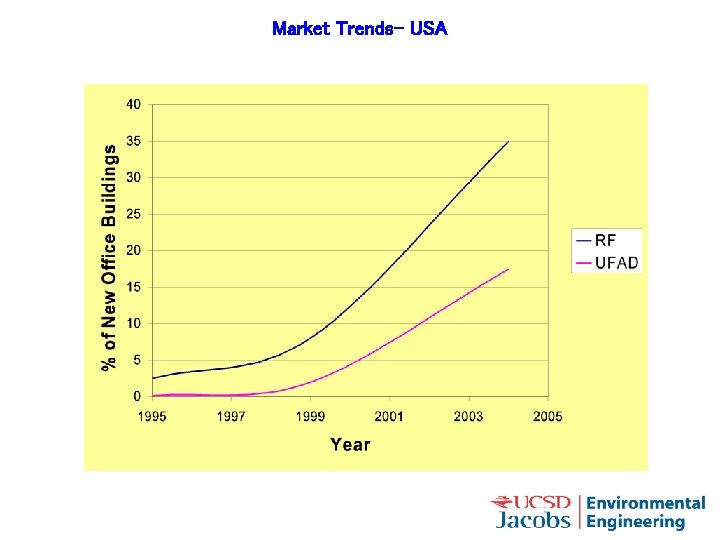
Market Trends- USA
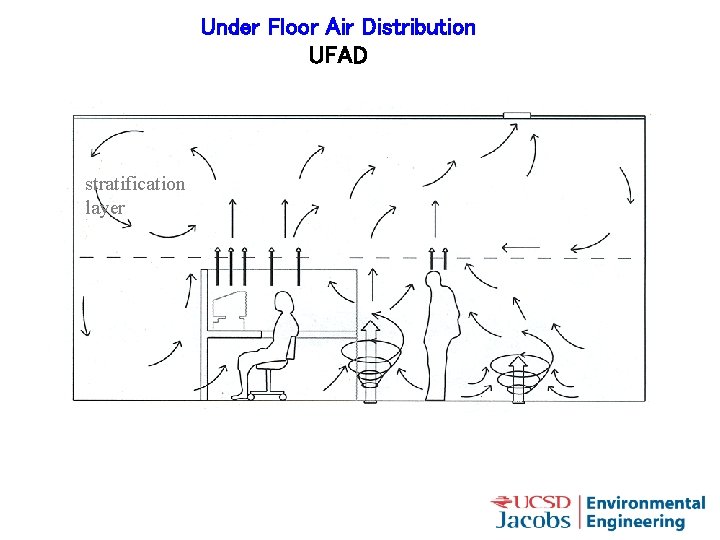
Under Floor Air Distribution UFAD stratification layer
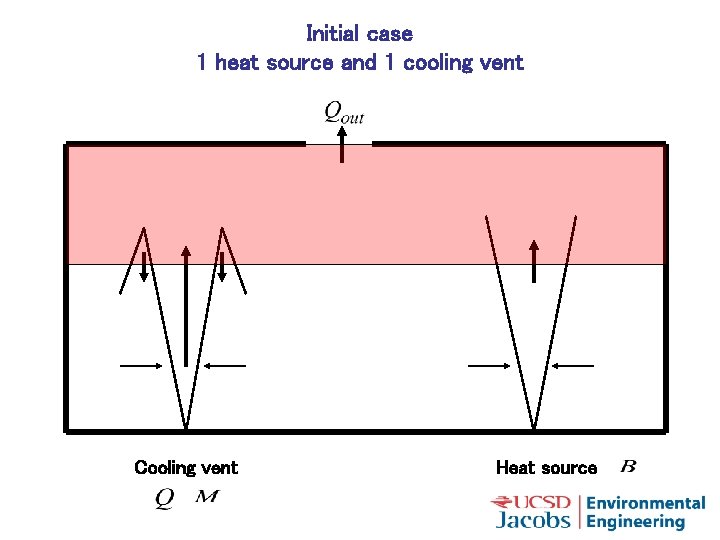
Initial case 1 heat source and 1 cooling vent Cooling vent Heat source
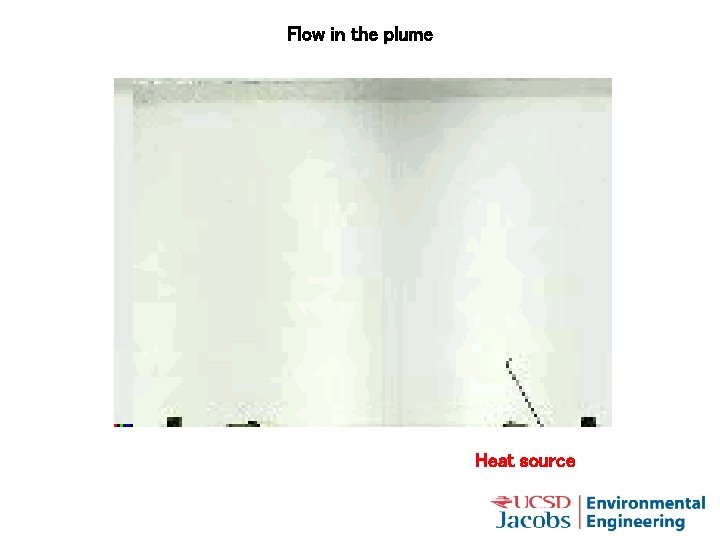
Flow in the plume Heat source

The diffuser flow diffuser
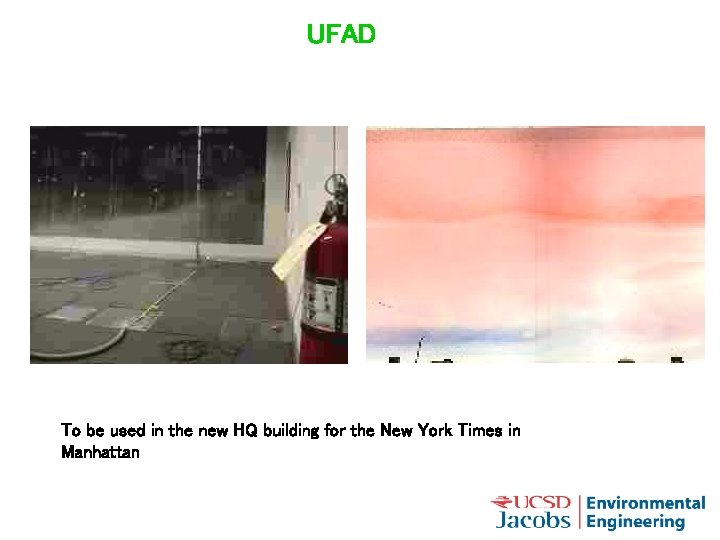
UFAD To be used in the new HQ building for the New York Times in Manhattan
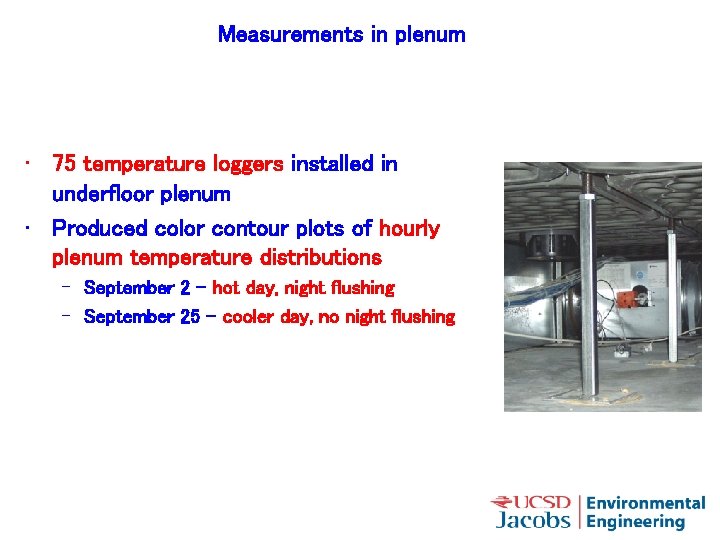
Measurements in plenum • 75 temperature loggers installed in underfloor plenum • Produced color contour plots of hourly plenum temperature distributions – September 2 – hot day, night flushing – September 25 – cooler day, no night flushing
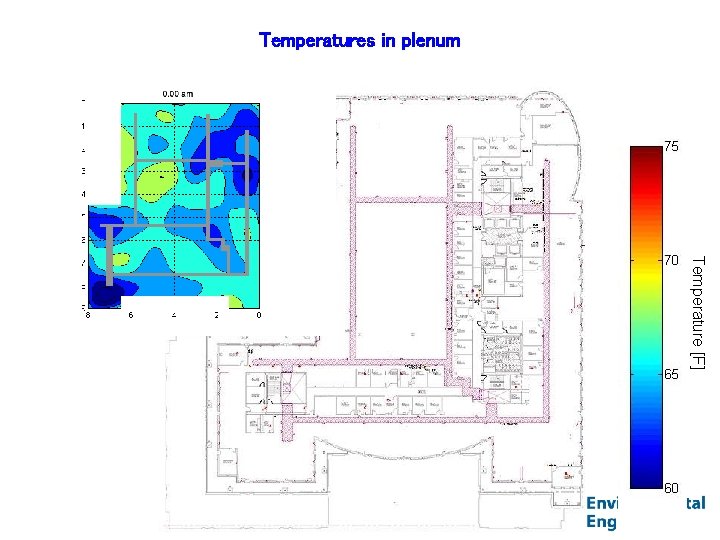
Temperatures in plenum Movie Temperature [F]
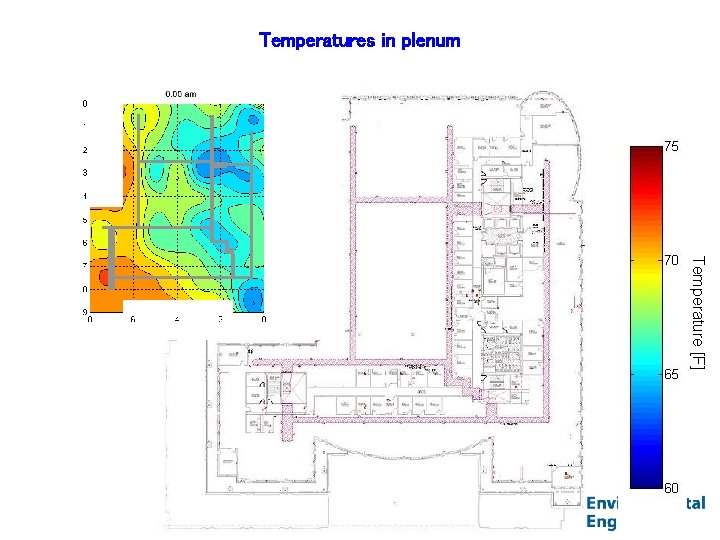
Temperatures in plenum Temperature [F]
- Slides: 57