Energy Resources Overview NonRenewable An overview on energy

Energy Resources: Overview & Non-Renewable An overview on energy for Introduction to Environmental Science
 of electricity produced or")
Energy Basics A kilowatt-hour means one kilowatt (1, 000 watts) of electricity produced or consumed for one hour. A Megawatt is (1, 000 watts) A Gigawatt is (1, 000, 000 watts) An average U. S. household uses about 10, 655 kilowatt-hours (k. Wh) of electricity each year. American Wind Energy Association

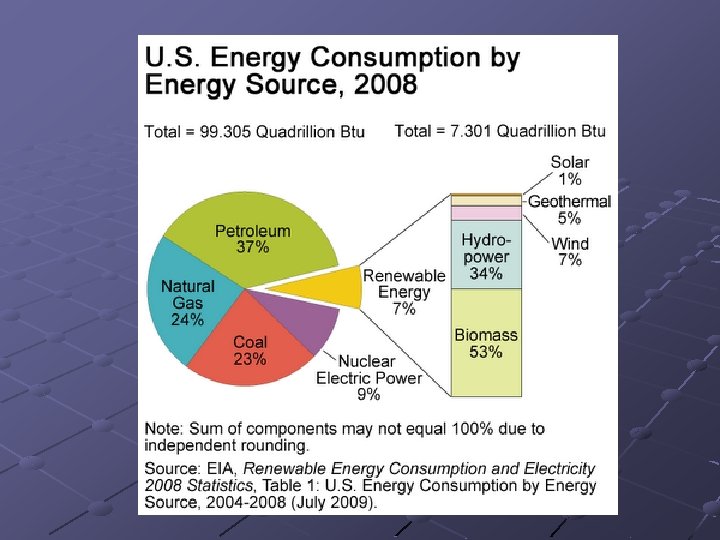
Energy Consumption Facts About 94% of the commercial energy used in the US comes from non-renewable resources The US is the largest energy consumer in the world In developing countries, approximately 50% use wood and/or charcoal Fossil fuels contribute more air pollution than any other fuel source

World Vie

Chart of regional consumption patterns of primary energy 2009

www. eia. doe. gov

Non-Renewable Energy Types Coal Oil Natural Gas Nuclear Energy About 78% of the commercial energy used worldwide comes from non-renewable sources

World Vie

www. worldofenergy. com

Coal “An old and reliable fuel source”

Coal Facts One-quarter of the world’s coal supply is found within the United States. “Coal is the work horse of the nation’s energy supply, supplying more than half of the United States’ electric supply” (US DOE). 27. 4% of the energy generated worldwide is produced from coal (Energy Information Administration). Developing countries' demand for coal will double through 2020 (EIA).

Coal Types Anthracite- Highest carbon content and used more in residential Bituminous- Most plentiful in the US used in electricity Sub-Bituminous- It has a lower sulfur content, but a lower carbon than the two listed above Lignite- A very young coal with the lowest carbon content

Bituminous Coal Anthracite Coal Lignite Coal

2005 U. S. Coal Production by Region Sources: Energy Information Administration, Annual Coal Report, 2005, DOE/EIA-0584(2005) (Washington, DC, October 2006).

Coal reserves in Colorado in surface mines

Coal Mining Comparison in the United States

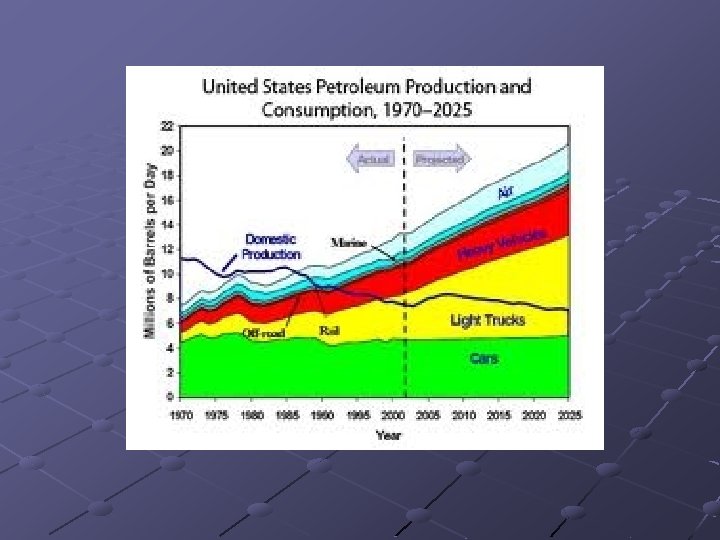
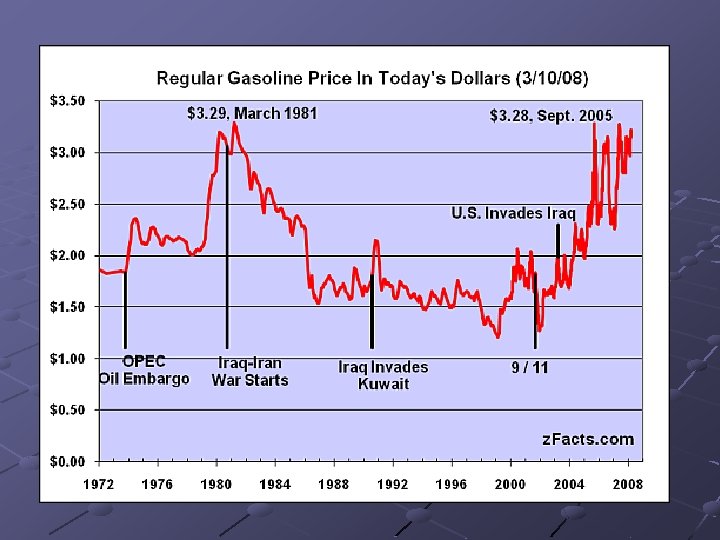
Petroleum - Oil “It powers transportation in the United States” Production Consumption Solutions

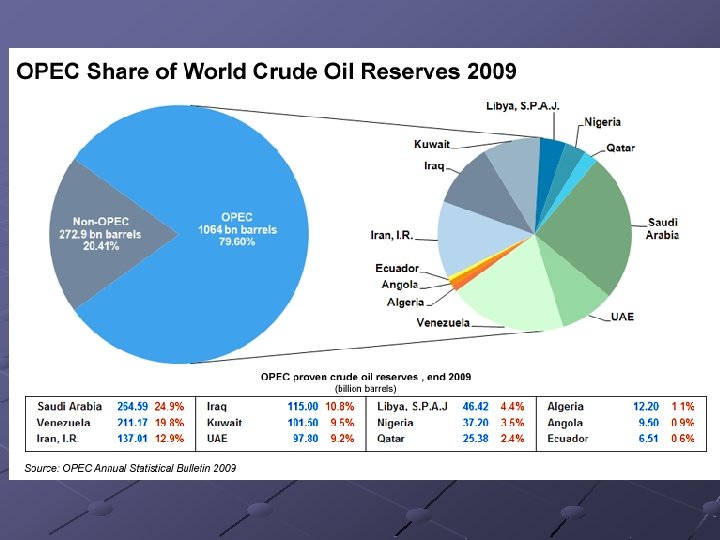
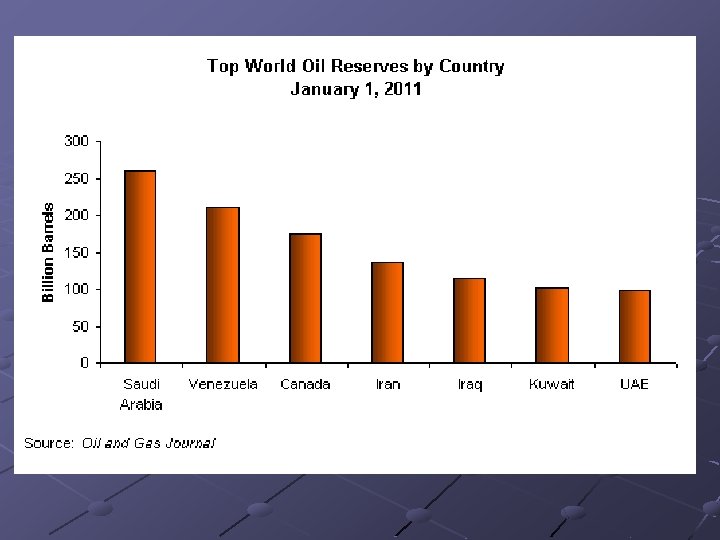
TOP 5 CRUDE OIL PRODUCING COUNTRIES Saudi Arabia Canada Russia United States Iran China Organization of the Petroleum Exporting Countries OPEC “An intergovernmental coalition of oil exporting nations created at a conference in Baghdad in 1960. ”

Picture: Phillips Petroleum © Tammy Sharp

International Crude Oil Production Millions of Barrels per Day
. Figures are")
One Barrel = 42 gallons Source: American Petroleum Institute (www. api. org). Figures are based on 1995 average yields for U. S. refineries. One barrel contains 42 gallons of crude oil. The total volume of products made is 44. 2 GALLONS - 2. 2 gallons greater than the original 42 gallons of crude oil. This is called "processing gain, " where other chemicals are added to the refining process to create the products.

Increasing Oil Production Could negatively impact the environment despite new technologies Too little potential for oil despite the effort the that is put into it There is always a chance for a major oil spill like those in Alaska and off the coast of Spain Increasing carbon dioxide levels and reliance on fossil fuels

www. eia. doe. gov

Oil Usage Tradeoffs Advantages n High net energy yield n Better technology n Decent supply n Is part of the culture Disadvantages n n G. Tyler Miller 2008 Environmental problems for burning this fuel Contributes to Global Warming Not an unlimited supply Destroys the environment when obtained

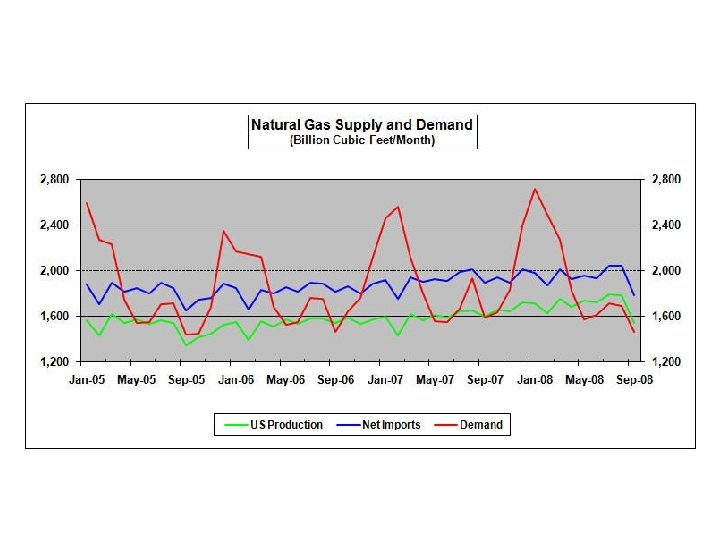
Natural Gas Facts It is the nation's fastest-growing energy source, with demand forecast to increase by about 22 percent between now and 2030 (EIA Annual Energy outlook 2006), including a more than 62 percent increase for electric power generation (EIA Annual Energy outlook 2006).
 by the Chinese")
History First Recorded Use of Natural Gas (600 B. C. ) by the Chinese using hollow bamboo poles to collect it. Used in Persia in 100 A. D. after lightening hit a natural gas seepage from the ground causing an everlasting flame. In the 1600’s it was lighted from a ground seepage around Lake Erie. Source: Culverco. com

Natural Gas Supply Worldwide United States 22. 5 % Canada 7. 0 % Mexico 1. 4 % Central and South America 4. 0 % Europe 11. 9 % Former Soviet Union 27. 5 % Middle East 9. 3 % Africa 5. 0 % Asian and Pacific Countries 11. 4 % (Source: BP Statistical Review of World Energy 2002 http: //www. bp. com/centres/energy 2002/downloads/index. asp)

www. ngsa. org

Natural Gas “NATURAL GAS is used in over 60 million homes. In addition, natural gas is used in 78 percent of restaurants, 73 percent of lodging facilities, 51 percent of hospitals, 59 percent of offices, and 58 percent of retail buildings” (American Petroleum Institute) It meets 23 percent of U. S. energy requirements It accounts for more than 90 percent of new electricity capacity built in last 5 years

Natural Gas Demand Worldwide United States 25. 6 % Canada 3. 0 % Mexico 1. 4 % Central and South America 4. 0 % Europe 19. 5 % Former Soviet Union 22. 8 % Middle East 8. 4 % Africa 2. 5 % Asian and Pacific Countries 12. 7 % (Source: BP Statistical Review of World Energy 2002 http: //www. bp. com/centres/energy 2002/downloads/index. asp)

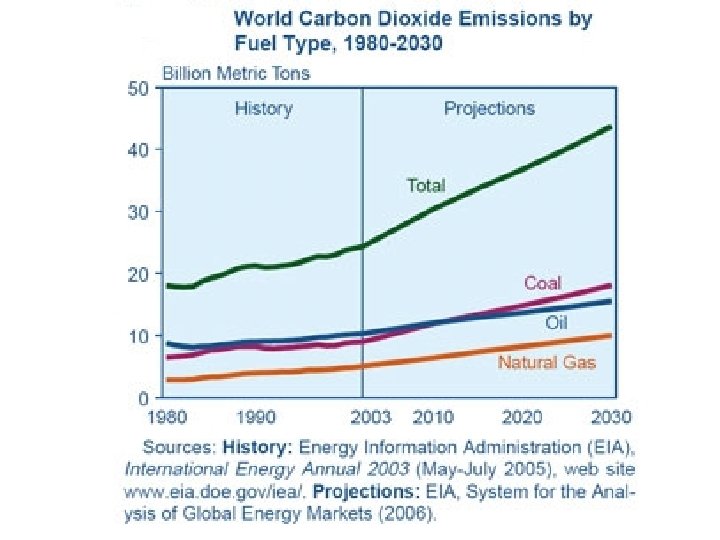
Natural Gas Usage Tradeoffs Advantages n n High Net Energy Yield Not as high a carbon dioxide emission as other fossil fuels Can be used in many scenarios Greater supply than crude oil G. Tyler Miller 2005 Disadvantages n n Produces environmental pollution including Carbon monoxide Contributes to Global Warming Not an unlimited supply Can be more dangerous than other fuels to handle

Nuclear Energy “It was supposed to be the fuel source to end all energy problems and power our future. ”

How a Nuclear Reactor Works The nucleus of a heavy element, such as uranium, splits when bombarded by a free neutron in a nuclear reactor. (1) The fission process for uranium atoms yields two smaller atoms, one to three free neutrons, plus an amount of energy. This leads to a continuous reaction which is considered a chain reaction.

U. S. Nuclear Regulatory Commission

Uranium vs. Plutonium Uranium has a half-life of 10, 000 years Plutonium has a half-life of 240, 000 years

Boiling Water Reactor U. S. Nuclear Regulatory Commission

Pressurized Water Reactor U. S. Nuclear Regulatory Commission

Oyster Creek Nuclear Generating Plant Began operating in 1969 as the first largescale commercial nuclear power plant in the United States. Single boiling water reactor produces 636 net megawatts*. It serves 600, 000 homes Located at Forked River, Ocean County, N. J. on the Jersey Shore * A megawatt-hour equals one million watts produced or used for one hour

Aerial View of Oyster Creek – Nuclear Regulatory Commission
 Year Coal Natural Gas Hydro")
Electricity Market in New Jersey (Percent Generated by Fuel) Year Coal Natural Gas Hydro Nuclear Other 2004 18 30 0 48 4 2003 16 26 * 53 5 2002 16 31 0 50 3 Source: Form EIA-860, "Annual Electric Generator" *Less than one percent

The Future of Nuclear Currently it is supplying 19% of the world’s energy supply It is forecast to drop to only 12% of the world’s energy supply within the next 40 years The NRC reports that there will be a 1545% chance of a complete core meltdown within the next 20 years. At least 228 reactors worldwide are scheduled for retirement

Japan: Nuclear Meltdown
 Totally dismantle the reactor and plant and contain the")
Retiring of a Reactor 1) Totally dismantle the reactor and plant and contain the waste in a high-level storage facility. 2) Place a barrier around the plant and deal with it decades from closing. 3) Another option is to totally seal off the reactor and entomb it.

Renewable Energy Sources Solar Wind Hydroelectric Geothermal Biomass Hydrogen

www. wvic. com

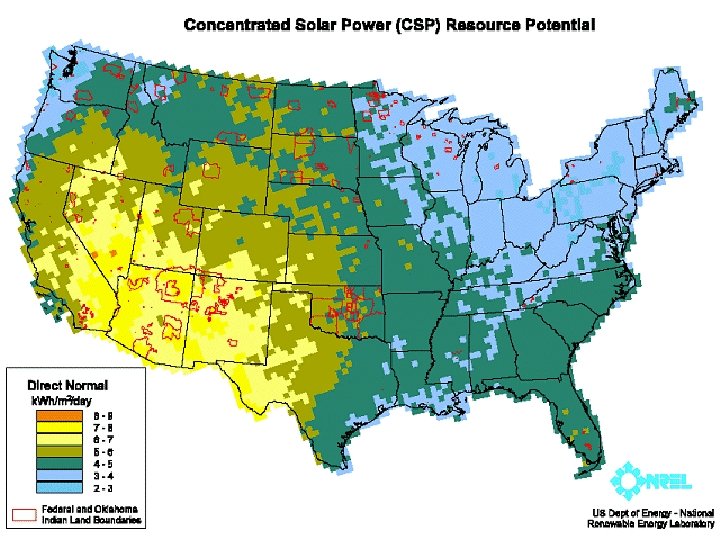
Sunlight Facts Sunlight travels to the earth in approximately 8 minutes from 93 million miles away, at 186, 282 miles per second. In one hour, more sunlight falls on the earth than what is used by the entire population in one year. The earth’s greatest source of energy is the sun and it maintain heat balance. The sun provides 1370 W/m 2 of energy www. fplenergy. com
 generating electricity from the sun")
Solar Energy Photovoltaic (PV) generating electricity from the sun

Photovoltaic Cells involve silicon coated plates Silicon crystal lattice structure

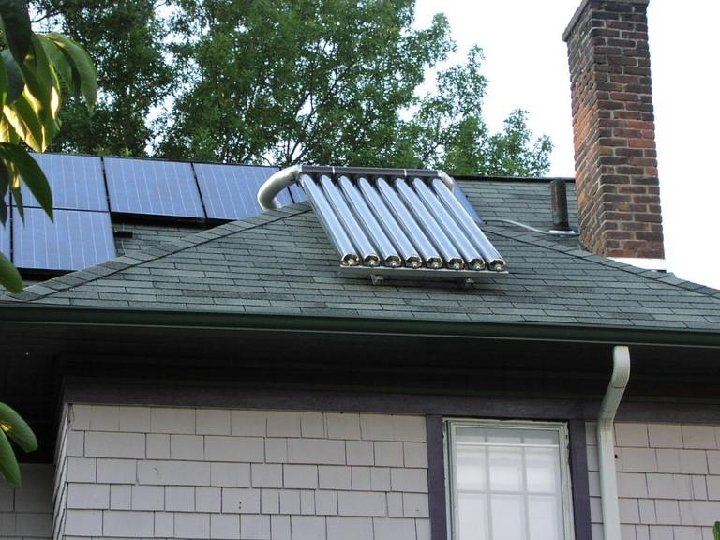
Solar Energy Solar Thermal Energy Most solar water-heating systems for buildings have two main parts: (1) a solar collector (2) a storage tank. The most common collector used in solar hot water systems is the flat-plate collector. www 1. eere. energy. gov

Solar Energy www 1. eere. energy. gov

Solar benefits Reduction in carbon dioxide and other emissions of gases Use of the sun’s energy which is considered renewable Better technology and advancements to increase efficiency Lower costs for installation today than in the past Moderate net energy returns

www. eia. doe. gov

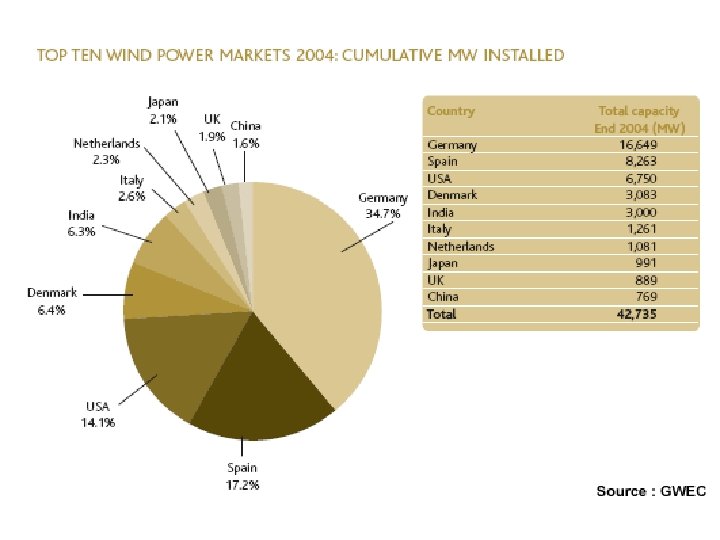
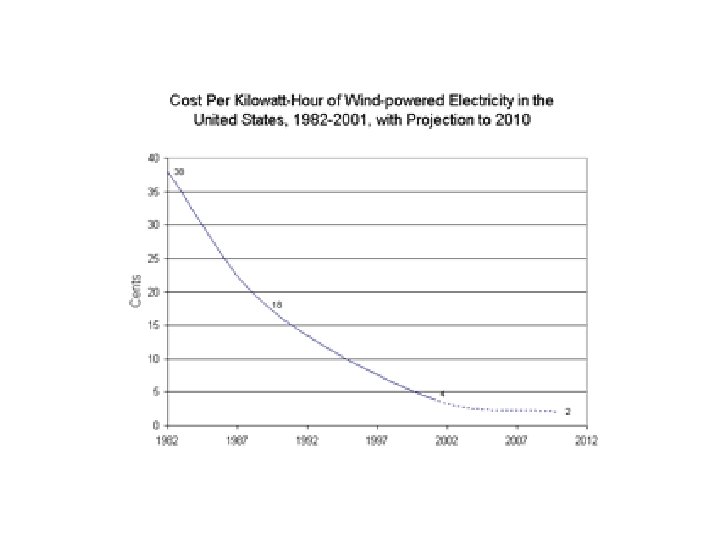
Wind Energy Can generate energy for thousands of homes The U. S. can generate > 10, 000 megawatts (MW) and may be able to support 20% of the electric needs of the U. S. Costly to install wind generators. Some environmental resistance Potential U. S. wind energy production by 2020: enough power for 25 million homes yearly Source: National Renewable Energy Laboratory

These wind turbines near Lamar, Colorado, are part of the 162 -MW Colorado Green Wind Farm. Each turbine produces 1. 5 megawatts of electricity. www. awea. org

Wind Energy Projects Throughout the United States of America U. S. WIND ENERGY CAPACITY: US Department of Energy 2011

New Jersey Wind Energy Development Total installed = 7. 5* Planned MW = 0* Wind Energy Potential: Average Power Output (MW): 1, 200 Annual k. Wh: 10 Billion Rank in US: 29 th ** Project or Area Owner Atlantic City Wind Farm Jersey America n Wind LLC Date Online 2005 MW Power Purchaser/ User Turbines / Units 7. 5 Atlantic County Utilities Authority Wastewater Treatment Plant GE Energy 1. 5 MW (5)

Hydroelectric It accounts for 7 to 9% of the U. S. electrical production According to 2004 statistics, it was number one in renewable energy production accounting for over 75% of our renewable sources Small scale projects can be advantageous and less impacting on the environment

Ice Harbor Dam – eia. doe. gov

www. eia. doe. gov

Hydroelectric Advantages n n n Small scale does not impact the environment as much as large scale impacts Does not produce air pollutants Year-round water supplies to areas Disadvantages n n n Major source of dams which disrupt water flow patterns Affect spawning migration routes Affect precipitation patterns regionally

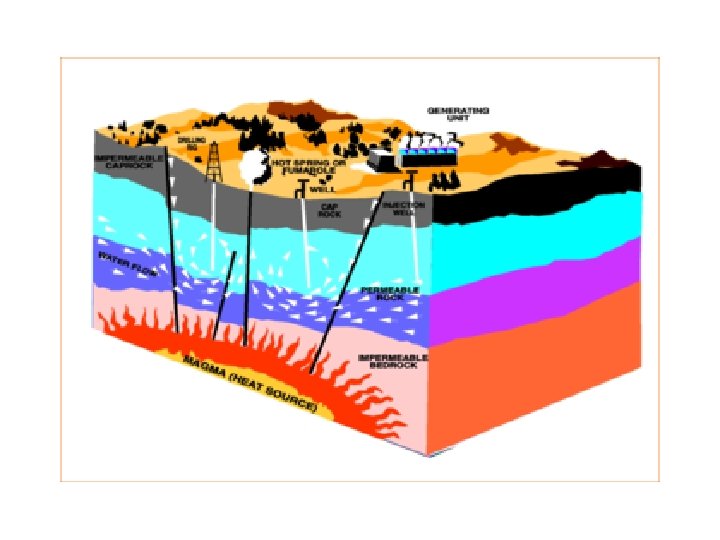
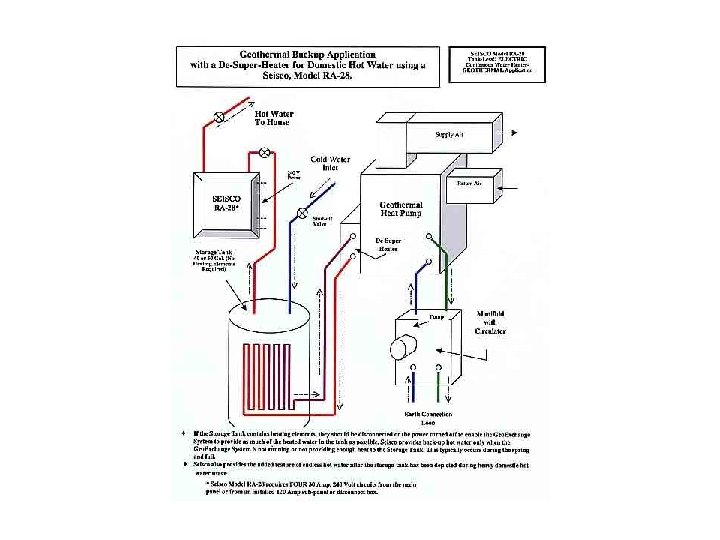
Geothermal Using below ground temperature and core temperatures of the earth to maintain a certain temperature thus less energy is needed to heat water. It is a secondary source, thus another active source of energy is needed to run pumps

Geothermal The upper 10 feet of Earth's surface maintains a nearly constant temperature between 50 and 60°F Technology is being developed to drill into this rock, inject cold water down one well, circulate it through the hot, fractured rock, and draw off the heated water from another well. www 1. eere. energy. gov

Geothermal www. wvic. com

Biomass The largest U. S. renewable energy source every year since 2000, it also provides the only renewable alternative for liquid transportation fuel (US EPA). Biomass power boilers are typically in the 20 -50 MW range, compared to coal-fired plants in the 100 -1500 MW range (US EPA).

Biomass

Biomass Advantages n n n Good use of materials that we would consider secondary An alternative fuel source that is a good secondary source Relatively low cost of production Disadvantages n n Not a primary source of energy Must include vast amounts of growth to include a supplemental source of energy

www. wvic. com

Hydrogen fuel “The goal of the U. S. Department of Energy’s Hydrogen Program is for hydrogen to produce ten percent of our energy by the year 2030”

Hydrogen Technologies "National Hydrogen Storage Project" Hydrogen is expensive fuel if converted per gallon gasoline. Estimates to balance at 2015 Hydrogen cuts back on air pollution emissions There are promising new advancements in storage and supply. www 1. eere. energy. gov

Carbon Sequestration Forest Lands Agricultural Lands Biomass Croplands Deserts and Degraded Soils Boreal Wetlands and Peatlands Oceanic Absorption Direct Ocean Injection Oil and Gas Reservoirs Coal Bed Methane www. fossil. energy. gov
- Slides: 84