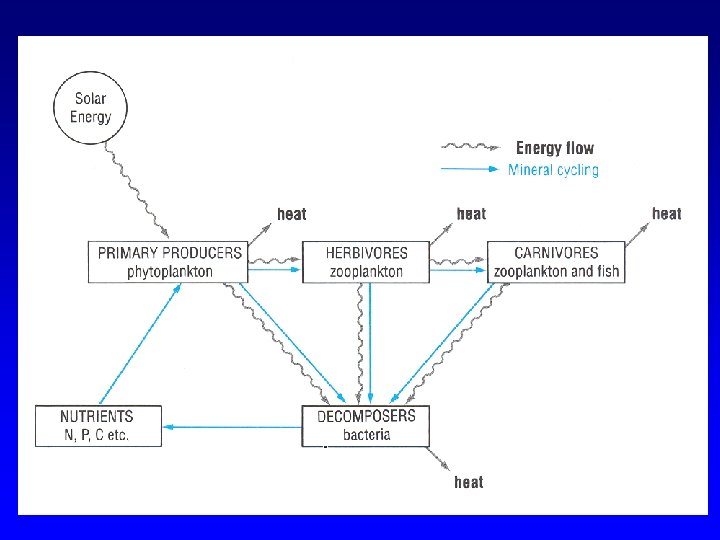
Energy flow and mineral cycling in ocean Food


의 크기 – 일반적으로")
 – Trophic level 사이에 이동되는 energy의 효율 –")
의 개체 크기에 의해 trophic level의")
 – total amount of animal biomass produced per")
 • Bacteria와 planktonic protozoans이 관여 • Detritus (유기물입자, 잔사)에서 시작 –")
 • Bacteria는 protozoans의 predation에 의해 조절됨 – Bacteria 수가 증가하면 protozoan")


 • 1) Majority")
 구조 (structure) – Phytoplankton: 작은 size때문에 floatation, 주변")
 Phytoplankton: Small size, high")
육상생태계에서는 많은 양의 primary production이")
 In the pelagic environment, primary")
 Production to biomass ratio")
 P/B ratio for terrestrial")
 대부분의 바다동물: cold-blooded invertebrates and")
 Marine animals의 경우 상대적으로 많은")

- Slides: 27
Energy flow and mineral cycling in ocean
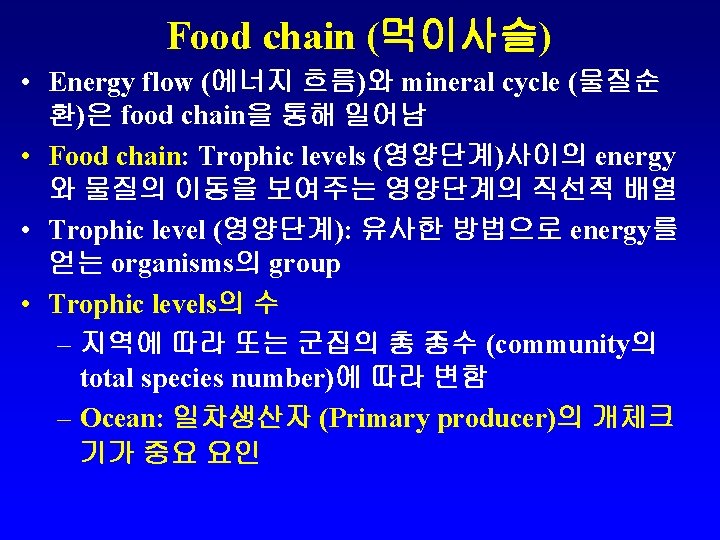
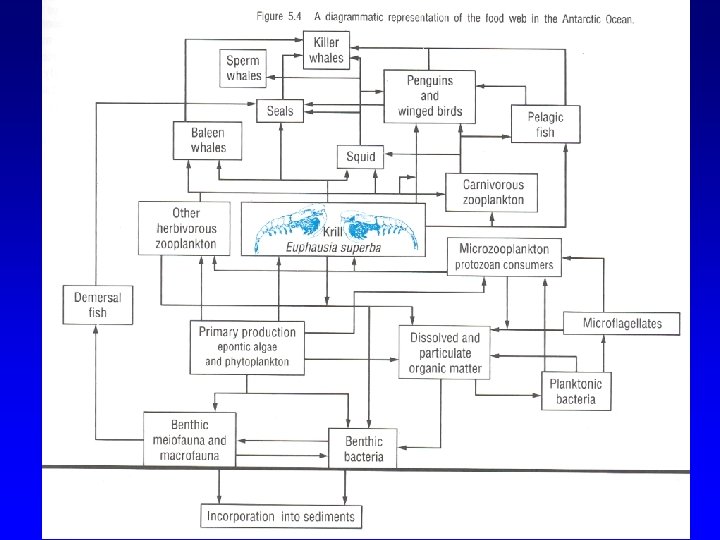
Food chain in Ocean • Ocean에서는 food chain이 주로 phytoplankton에 서 시작: Pelagic food chain (표영계 먹이사슬) 1. Begins with the phytoplankton (primary producer, 일차생산자) 2. Herbivorous zooplankton (primary consumers, 일차소비자) 3. Carnivorous zooplankton (secondary consumers, 이차소비자) 4. Big carnivores feed on small carnivores (tertiary consumers)
Trophic levels in ocean • Trophic level 내의 개체 (individual organisms)의 크기 – 일반적으로 trophic level이 올라감에 따라 increase • Generation time (수명; length of the life cycle): progressively longer – Phytoplankton: hours or days – Zooplankton: weeks to months – Fish: years – Marine mammals: many years
Food chain • Ecological efficiency (생태적효율) – Trophic level 사이에 이동되는 energy의 효율 – 측정에 어려움 – Transfer efficiency로 측정 • ET = Pt/Pt-1 (P: annual production) – In marine system • Plants to herbivores: 20% • At higher levels: 10 -15% • 육상 생태계: 주로 10%
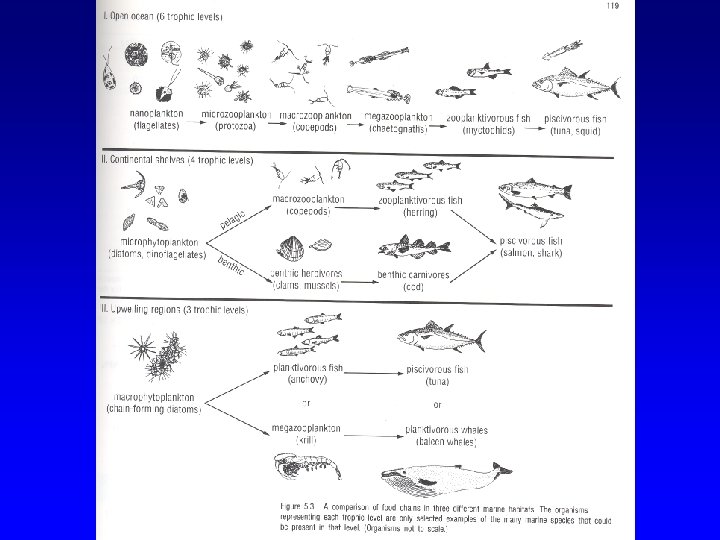
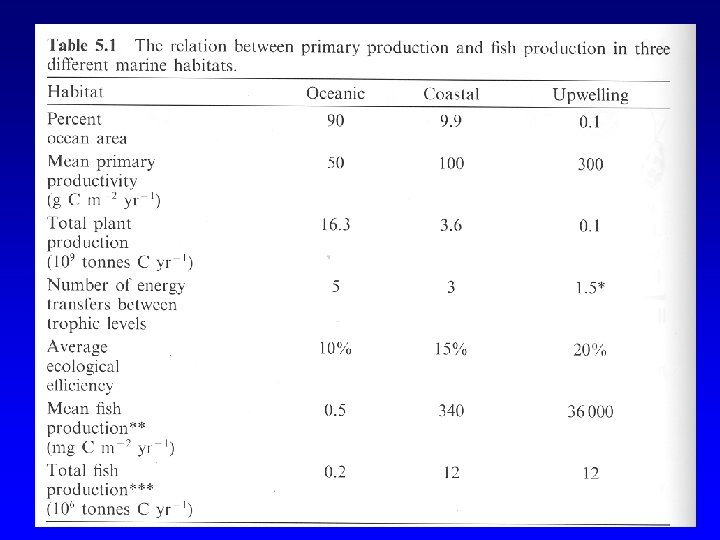
Number of trophic levels • 해양에서는 일차생산자 (primary producers)의 개체 크기에 의해 trophic level의 수가 결정 – 1. In the open ocean: 6 단계 • phytoplankton is small (because low nutrients) • 중간 단계가 필요 – 2. Continental shelves: 약 4 단계 – 3. In upwelling zones: 약 3단계 • Large chain-forming diatoms 이 우점 • Large zooplankton or fish 가 large primary producers를 직접 섭식 • High biomass of top level predators • 최상위 포식자의 biomass를 결정하는 주요 요인 – 물고기 생산성을 결정 (인간은 주로 최상위 포식자를 이용)
Secondary production • Secondary production (이차생산) – total amount of animal biomass produced per unit area and per unit time – 단위 면적, 단위 시간 당 총 동물 생산량 – Cf. primary production: 식물의 생산 • Secondary production (P) = BEn – B: annual primary production – E: ecological efficiency – n: number of trophic transfers (# of trophic levels – 1)
Microbial loop (미생물고리) • Bacteria와 planktonic protozoans이 관여 • Detritus (유기물입자, 잔사)에서 시작 – 1. Particulate detritus 형성 • Natural mortality of plankton, nekton: 사체 • Production of faecal pellets: 배설물 – 2. Bacteria 들이 detritus 를 이용 (for growth) – 3. Number of bacteria in the sea • Number of bacteria in the euphotic zone: 5 106/ml • Absence of bacterial grazers: 108/ml • In deep ocean: less than 103/ml
Microbial loop (미생물고리) • Bacteria는 protozoans의 predation에 의해 조절됨 – Bacteria 수가 증가하면 protozoan predation도 증가 – Bactivorous zooplankton (protozoan)이 더 큰 생물의 먹이 원이 됨 – Small bactivorous zooplankton (주로 protozoans)은 bacteria production이 상위 trophic level로 전달되는데 중요한 역할
POC
Microbial loop • 일반적으로 photosynthesis에 의해 생성된 organic carbon의 50% 이상이 bacteria에 의해 이용됨 • New in marine biology (해양생물학의 새로운 분야) – – Very small size of the pelagic bacteria and protozoans Difficult in collection, preservation and identification Need to understand the impact of this cycle About 30 to 50% of bacteria populations are infected by viruses • Virus: a significant agent in mortality for bacteria – Lysis (용해)
A comparison of marine and terrestrial production (바다와 육상의 생산성 비교) • 1) Majority of the primary producers ( 주요 일차생산자) – In the open ocean: microscopic phytoplankton – Terrestrial: large, highly visible forms like grass and trees
Marine and terrestrial productions • 2) 구조 (structure) – Phytoplankton: 작은 size때문에 floatation, 주변 물 로부터 직접 cell wall을 통해 nutrients 흡수 – Terrestrial plants: • • 고정 및 토양으로부터 nutrients 흡수를 위해 roots 필요 빛을 많이 받기 위해 trunks와 branches가 발달 strength와 rigidity 제공을 위해 cellulose나 lignin 생성 Structural carbohydrates 필요: 보통 energy로 사용 불가 – Phytoplankton은 많은 양의 structural carbohydrate를 필요로 하지 않으며, protein을 많 이 함유함 • High nutritional value를 가짐
A comparison of marine and terrestrial production • 3 -1) Phytoplankton: Small size, high protein content, relatively low abundance compared to herbivore numbers (zooplankton) 때문에 – 대부분의 marine primary production (phytoplankton)이 marine herbivores (zooplankton)에 의해 소비됨. – 적은 양의 pelagic primary production 만 decomposer cycle로 들어감
A comparison of marine and terrestrial production • 3 -2)육상생태계에서는 많은 양의 primary production이 소화되지 않는 cellulose나 lignin과 같 은 structural components – 육상초식동물은 total plant production의 5 -15% 이하를 소비, 그리고 소화되지 않은 부분이 많음 – 많은 육상 photosynthetic production이 decomposition cycle을 통해 간접적으로 food chain으로 들어옴.
A comparison of marine and terrestrial production • 4) In the pelagic environment, primary productivity ranges: 50 to 350 g C m-2 yr-1 – 육상: 0 (사막, 극지) – 2400 (grassland), 3900 (tropical rain forest) – Seagrass beds의 경우 매우 높은 생산성을 나 타내나 (1000 g C m-2 yr-1) – 일반적으로 단위 면적 당 일차생산성 (식물 생산성)은 바다가 육상에 비해 낮다
A comparison of marine and terrestrial production • 5 -1) Production to biomass ratio (P/B) – relationship between the amount of production per year and the amount of living material present at any one time – 현존하는 biomass에 대한 연간 production 비율 – Phytoplankton: 100 -300 (phytoplankton biomass turn over 100 -300 times during a year) • Small size, fast-growing – An order of magnitude lower for marine zooplankton (P/B): 10 -30 – Another order of magnitude lower for fish (P/B): 1 -3
A comparison of marine and terrestrial production • 5 -2) P/B ratio for terrestrial plants (육상식 물): 0. 5 – 2. 0 – High total biomass – Slow-growing, long-lived – Primary production의 많은 부분이 high biomass를 유지 (maintenance)하는데 사용 (respiration)
A comparison of marine and terrestrial production • 6) 대부분의 바다동물: cold-blooded invertebrates and fish (변온동물) – 육상의 warm-blooded animals 에 비해 훨씬 적 은 양의 energy requirements • 7) Pelagic animals live in a buoyant fluid and use little energy in locomotion – 물속의 동물은 부력에 의해 중력의 영향을 덜 받으므로 이동 (locomotion)에 적은 양의 energy를 사용 – 육상동물은 중력에 저항해야 하므로 이동에 많은 energy 필요
A comparison of marine and terrestrial production • 8) Marine animals의 경우 상대적으로 많은 energy를 growth (생장)와 reproduction (생식)에 사용 – Growth efficiency (생장효율)이 높다 • 먹은 음식물 양에 대한 biomass production 비율 (ratio of biomass production to quantity of food eaten) • 생장효율이 변온동물에서 10배정도 높다 (an order of magnitude higher in marine poikilothermic (coldblooded species)) • 9) 대부분의 해양동물은 많은 자손을 생산하며, 자손 을 돌보는데 energy를 사용하지 않음 • 따라서 바다에서 육상에 비해 높은 이차생산성 (동물 생산)을 보임 (Therefore, much higher secondary production in the sea compared with that on land)
A comparison of marine and terrestrial production • On land: plants dominate the biomass • In the sea: animals are dominant group • The ocean contribution – only about 35% of the world’s plant production – but it accounts for about 80% of its animal production