ENERGY Energy the ability to do work The

ENERGY! Energy: the ability to do work The 1 st Law of Thermodynamics, also known as Law of Conservation of Energy: energy can neither be created or destroyed; destroyed energy can only be transferred or changed from one form to another. ΔE = q(heat) + w(work)

What is Energy? Let’s create a word map from your ideas as 2 a class… c m E=

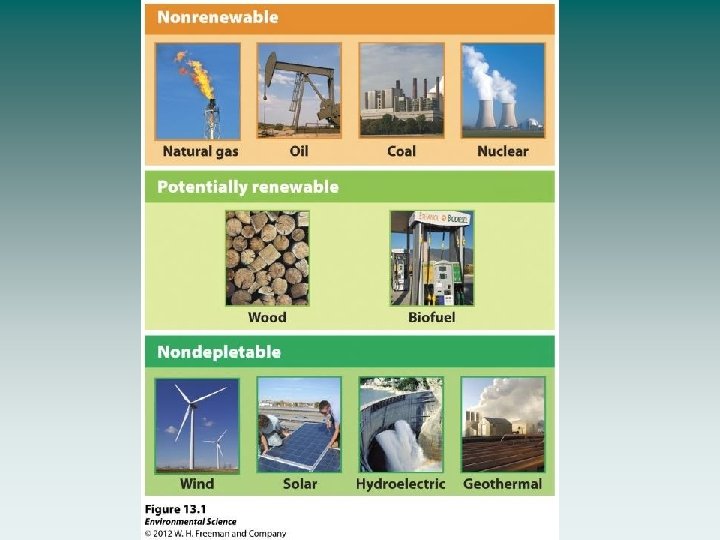
Non-Renewable Defined: Limited supply – may run out and will not be replaced in our lifetimes. Examples: May never run out, or it can be replenished in a human lifetime. “non-depletable” Examples : Fossil Fuels • Oil (Petroleum) • Coal • Natural Gas Nuclear? Renewable Solar Wind Water (hydroelectric) Geothermal Biomass / Ethanol Humans ; ) Hydrogen Fuel Cells…

A S ll l o ? r a The Sun is the ultimate source of almost all types of energy!

Energy Usage In the United States, each person averages 10, 000 watts of energy use continuously — 24 hours per day, 365 days per year
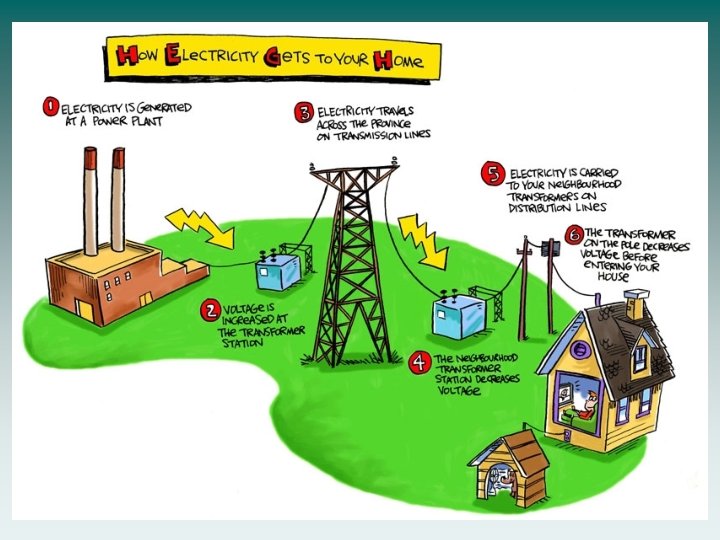
 How a")
Electricity Generation (Fill in the captions using the diagram from Mr. Sierra) How a Coal Plant works (click here for video)
 Make a pie-graph with this data: (we’ll do this on")
Energy Resources (for electricity) Make a pie-graph with this data: (we’ll do this on another slide) Coal: 49% Natural Gas: 20% Nuclear: 20% Hydroelectric: 7% Petroleum: 1. 5% Other Renewables (remainder) It will look something similar to… Coal, natural gas, and nuclear power plants together account for about 90 percent of current U. S. electricity production.
 Fuels used for electricity generation in the United States. Coal")
Energy Resources (for electricity) Fuels used for electricity generation in the United States. Coal is the fuel most commonly used for electricity generation. [Data from U. S. Department of Energy, Energy Information Administration, 2009. ] However… most coal burning power plants are only about 35% efficient. What do we mean by energy “efficiency”? See next slide…

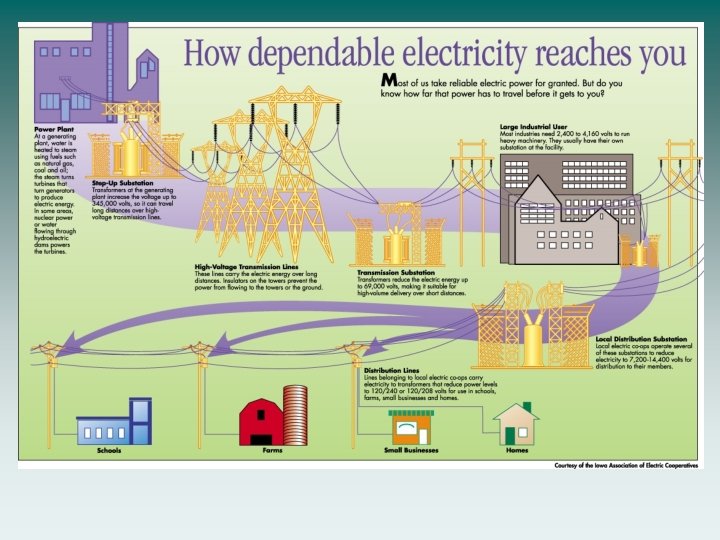
Process of Energy Use The efficiency of the transfer of energy from a fuel to electricity is approximately 35%. Another 30% is lost during “electricity transmission” from the generator to the user.

1. Start with a nice circle Renewables 2. Put a dot in the middle for reference 9 -13% 3. Draw the first line at “midnight” Nuclear How do these graphs compare to 4. the Oilprevious is betweenslide? 34 -36%. Let’s say 35%. Oil Thefor lineelectricity) should be over ¼ of the circle. 6 -8%represent all energy - not just (these Energy Resources (Petroleum) Natural Gas 35% 20 -25% Coal 20 -25% 5. Coal and Natural Gas make up about 40 -25%. The line should be less than ½. 6. Split them down the middle… 7. Nuclear is between 6 -8% 8. Add these up, and what are we left with? 9. ALL the renewables make up LESS than 13% of all the energy used in the U. S. !!! 10. Feel free to list the renewables with an arrow to this small percentage. (sad…) Let’s make our own pie graph

History of Consumption OPEC = Organization of Petroleum Exporting Countries For the majority of human history (before the 1800’s), the predominant fuel source has been wood
- Slides: 14