
Energy Efficiency in Manufacturing Prof Dr Ing E
- Slides: 24
Energy Efficiency in Manufacturing Prof. Dr. -Ing. E. h. Dr. h. c. Fritz Klocke Dipl. -Ing. Dieter Lung Dipl. -Ing. Ralf Schlosser Bilbao, 20. 04. 2010 © WZL/Fraunhofer IPT
Agenda 1 Introduction 2 Fields of Action in Energy- and Ressource-Efficient Manufacturing 3 Balancing 4 Adapted Process-Design leading to Resource- and Energy-Savings 5 Summary © WZL/Fraunhofer IPT Seite 2
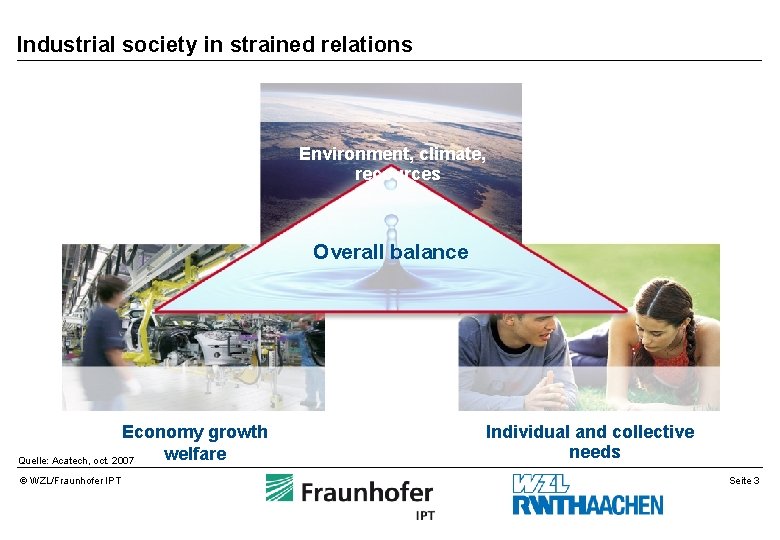
Industrial society in strained relations Environment, climate, recources Overall balance Economy growth welfare Quelle: Acatech, oct. 2007 © WZL/Fraunhofer IPT Individual and collective needs Seite 3
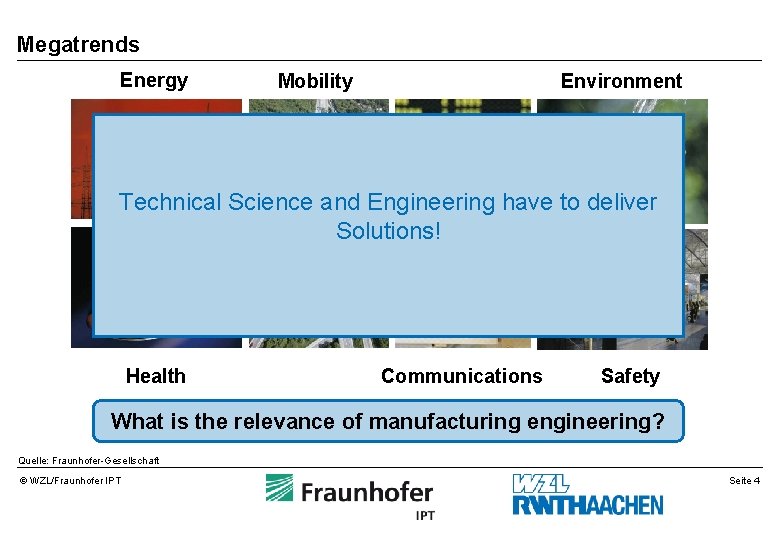
Megatrends Energy Mobilit Environment Technical Science and Engineering have to deliver Solutions! Health Communications Safety What is the relevance of manufacturing engineering? Quelle: Fraunhofer-Gesellschaft © WZL/Fraunhofer IPT Seite 4
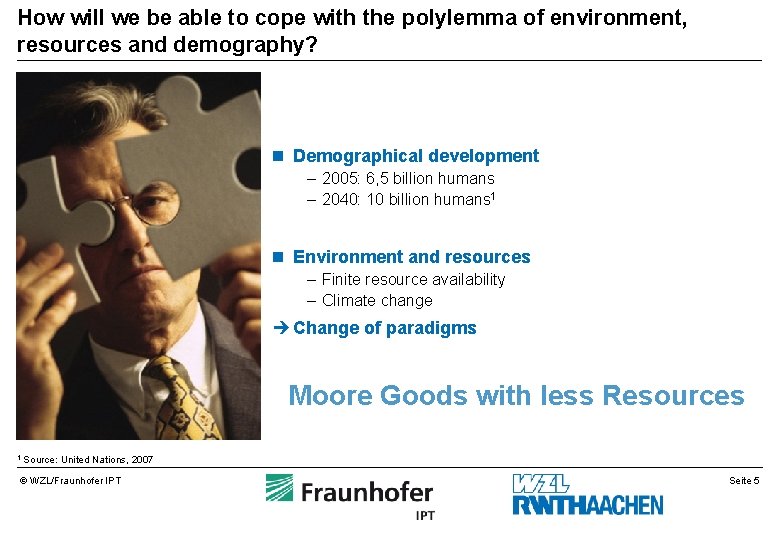
How will we be able to cope with the polylemma of environment, resources and demography? n Demographical development – 2005: 6, 5 billion humans – 2040: 10 billion humans 1 n Environment and resources – Finite resource availability – Climate change è Change of paradigms Moore Goods with less Resources 1 Source: United Nations, 2007 © WZL/Fraunhofer IPT Seite 5
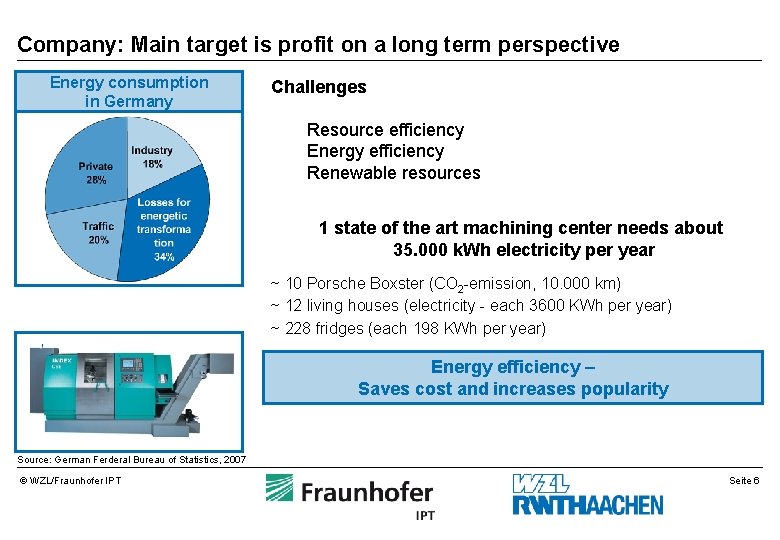
Company: Main target is profit on a long term perspective Energy consumption in Germany Challenges Resource efficiency Energy efficiency Renewable resources 1 state of the art machining center needs about 35. 000 k. Wh electricity per year ~ 10 Porsche Boxster (CO 2 -emission, 10. 000 km) ~ 12 living houses (electricity - each 3600 KWh per year) ~ 228 fridges (each 198 KWh per year) Energy efficiency – Saves cost and increases popularity Source: German Ferderal Bureau of Statistics, 2007 © WZL/Fraunhofer IPT Seite 6
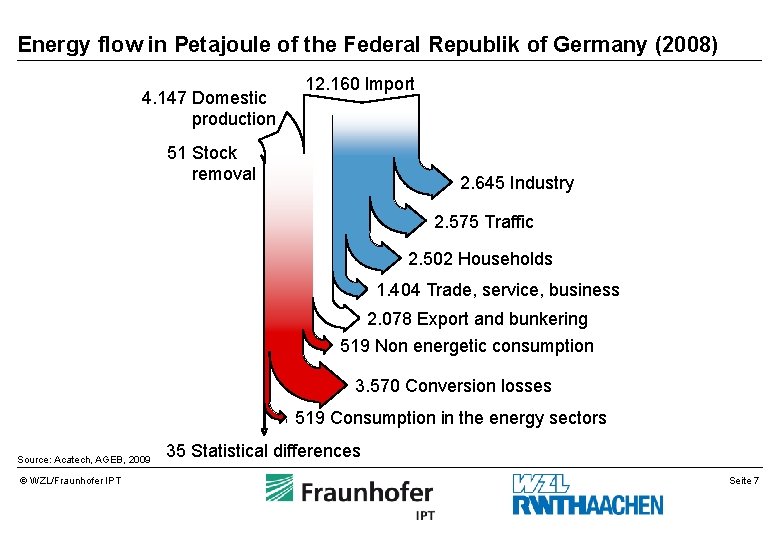
Energy flow in Petajoule of the Federal Republik of Germany (2008) 4. 147 Domestic production 12. 160 Import 51 Stock removal 2. 645 Industry 2. 575 Traffic 2. 502 Households 1. 404 Trade, service, business 2. 078 Export and bunkering 519 Non energetic consumption 3. 570 Conversion losses 519 Consumption in the energy sectors Source: Acatech, AGEB, 2009 © WZL/Fraunhofer IPT 35 Statistical differences Seite 7
Agenda 1 Introduction 2 Fields of Action in Energy- and Ressource-Efficient Manufacturing 3 Balancing 4 Adapted Process-Design leading to Resource- and Energy-Savings 5 Summary © WZL/Fraunhofer IPT Seite 8
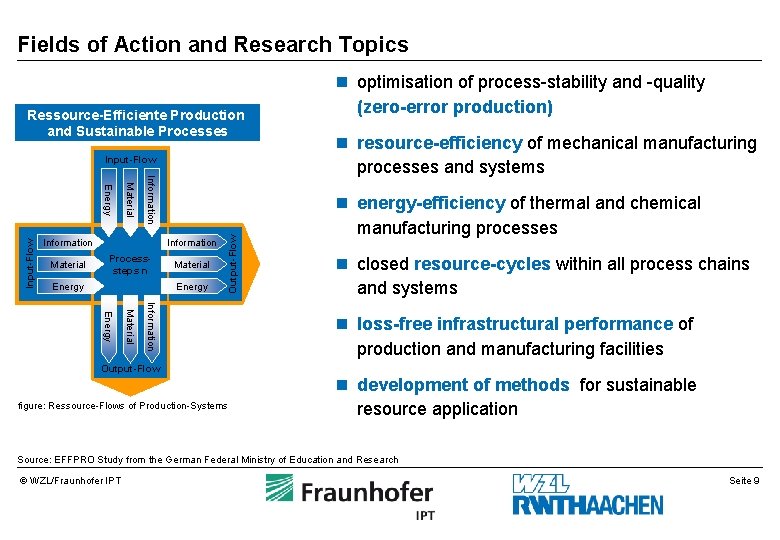
Fields of Action and Research Topics n optimisation of process-stability and -quality Ressource-Efficiente Production and Sustainable Processes Input-Flow Information Processsteps n Energy n energy-efficiency of thermal and chemical Material Energy Output-Flow Input-Flow Prozess Material n resource-efficiency of mechanical manufacturing processes and systems Information Material Energy Information (zero-error production) manufacturing processes n closed resource-cycles within all process chains and systems Information Material Energy n loss-free infrastructural performance of production and manufacturing facilities Output-Flow n development of methods for sustainable figure: Ressource-Flows of Production-Systems resource application Source: EFFPRO Study from the German Federal Ministry of Education and Research © WZL/Fraunhofer IPT Seite 9
Agenda 1 Introduction 2 Fields of Action in Energy- and Ressource-Efficient Manufacturing 3 Balancing 4 Adapted Process-Design leading to Resource- and Energy-Savings 5 Summary © WZL/Fraunhofer IPT Seite 10
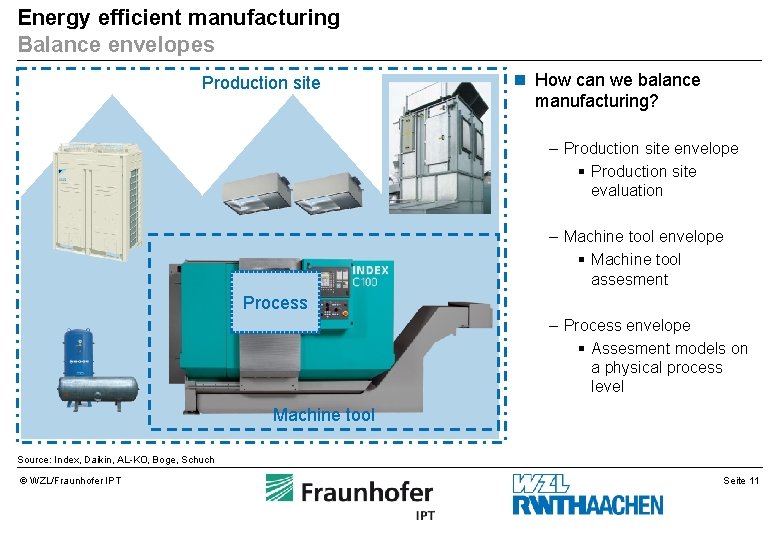
Energy efficient manufacturing Balance envelopes Production site n How can we balance manufacturing? – Production site envelope § Production site evaluation – Machine tool envelope § Machine tool assesment Process – Process envelope § Assesment models on a physical process level Machine tool Source: Index, Daikin, AL-KO, Boge, Schuch © WZL/Fraunhofer IPT Seite 11
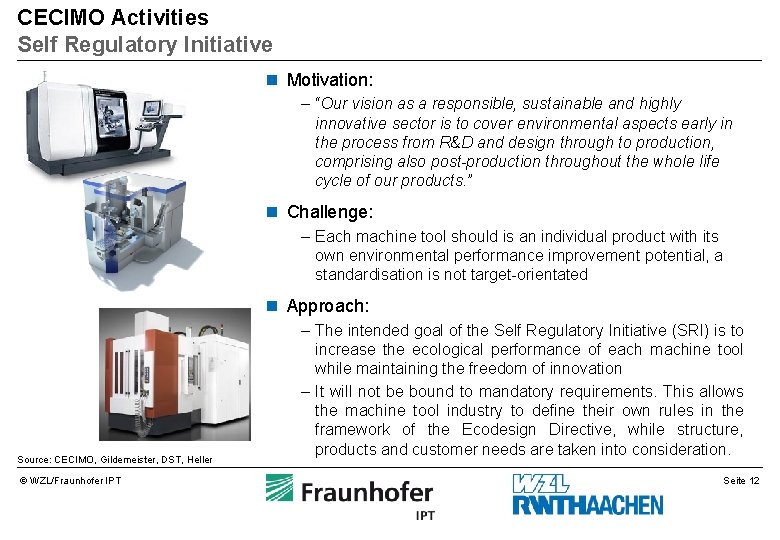
CECIMO Activities Self Regulatory Initiative n Motivation: – “Our vision as a responsible, sustainable and highly innovative sector is to cover environmental aspects early in the process from R&D and design through to production, comprising also post-production throughout the whole life cycle of our products. ” n Challenge: – Each machine tool should is an individual product with its own environmental performance improvement potential, a standardisation is not target-orientated Source: CECIMO, Gildemeister, DST, Heller © WZL/Fraunhofer IPT n Approach: – The intended goal of the Self Regulatory Initiative (SRI) is to increase the ecological performance of each machine tool while maintaining the freedom of innovation – It will not be bound to mandatory requirements. This allows the machine tool industry to define their own rules in the framework of the Ecodesign Directive, while structure, products and customer needs are taken into consideration. Seite 12
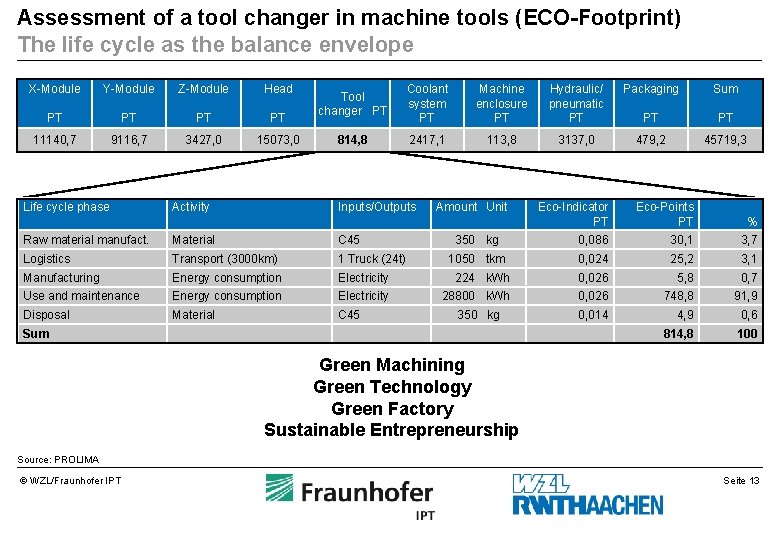
Assessment of a tool changer in machine tools (ECO-Footprint) The life cycle as the balance envelope X-Module Y-Module Z-Module Head PT PT 11140, 7 9116, 7 3427, 0 15073, 0 Life cycle phase Activity Tool changer PT Coolant system PT Machine enclosure PT Hydraulic/ pneumatic PT Packaging Sum PT PT 814, 8 2417, 1 113, 8 3137, 0 479, 2 45719, 3 Inputs/Outputs Amount Unit Eco-Indicator PT Eco-Points PT % 350 kg 0, 086 30, 1 3, 7 1050 tkm 0, 024 25, 2 3, 1 Raw material manufact. Material C 45 Logistics Transport (3000 km) 1 Truck (24 t) Manufacturing Energy consumption Electricity 224 k. Wh 0, 026 5, 8 0, 7 Use and maintenance Energy consumption Electricity 28800 k. Wh 0, 026 748, 8 91, 9 Disposal Material C 45 350 kg 0, 014 4, 9 0, 6 814, 8 100 Sum Green Machining Green Technology Green Factory Sustainable Entrepreneurship Source: PROLIMA © WZL/Fraunhofer IPT Seite 13
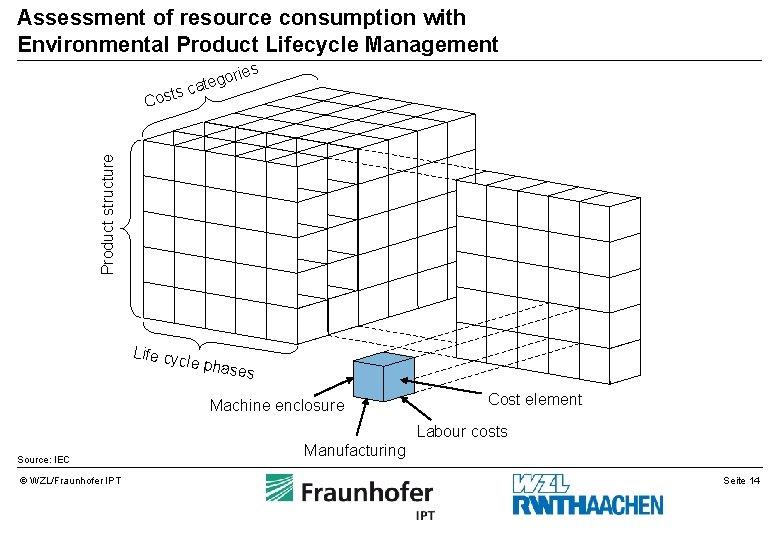
Assessment of resource consumption with Environmental Product Lifecycle Management ts Product structure Cos ies r o g cate Life cy cle pha ses Machine enclosure Cost element Labour costs Source: IEC © WZL/Fraunhofer IPT Manufacturing Seite 14
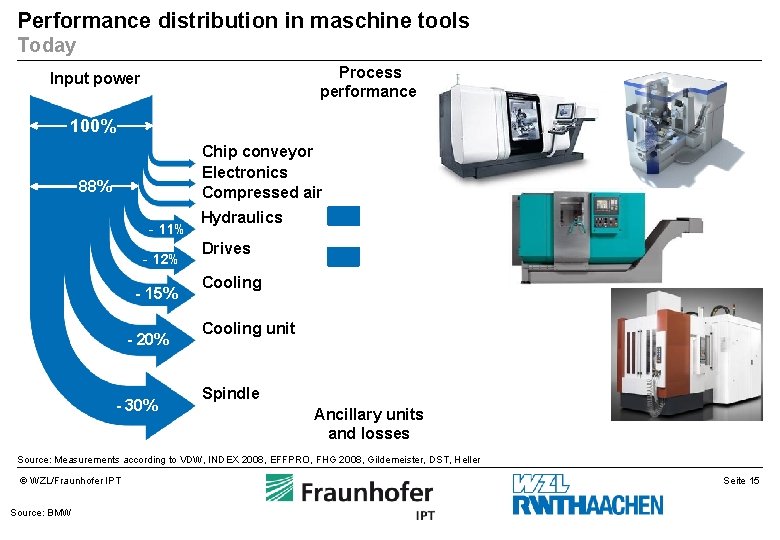
Performance distribution in maschine tools Today Input power Process performance 100% 25% Chip conveyor Electronics Compressed air 88% - 11% - 12% - 15% - 20% Hydraulics Drives Cooling unit 75% - 30% Spindle Ancillary units and losses Source: Measurements according to VDW, INDEX 2008, EFFPRO, FHG 2008, Gildemeister, DST, Heller © WZL/Fraunhofer IPT Source: BMW Seite 15
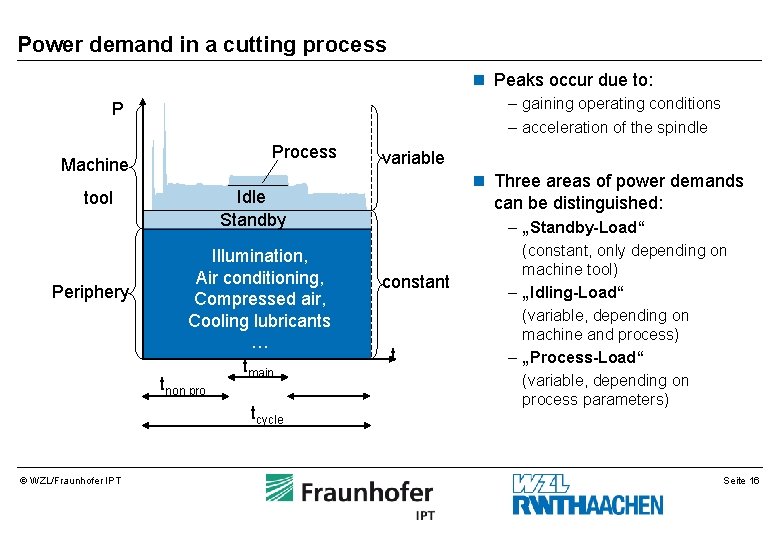
Power demand in a cutting process n Peaks occur due to: – gaining operating conditions – acceleration of the spindle P Process Machine Illumination, Air conditioning, Compressed air, Cooling lubricants … tmain tnon pro tcycle © WZL/Fraunhofer IPT n Three areas of power demands Idle Standby tool Periphery variable can be distinguished: constant t – „Standby-Load“ (constant, only depending on machine tool) – „Idling-Load“ (variable, depending on machine and process) – „Process-Load“ (variable, depending on process parameters) Seite 16
Agenda 1 Introduction 2 Fields of Action in Energy- and Ressource-Efficient Manufacturing 3 Balancing 4 Adapted Process-Design leading to Resource- and Energy-Savings 5 Summary © WZL/Fraunhofer IPT Seite 17
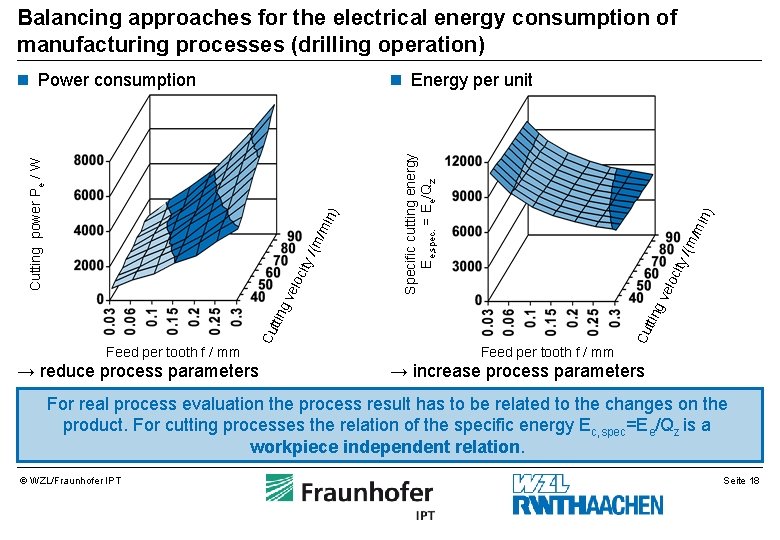
Balancing approaches for the electrical energy consumption of manufacturing processes (drilling operation) → reduce process parameters /m in) /(m gv elo city Feed per tooth f / mm Cu ttin /m in) /(m gv elo city Cu ttin Feed per tooth f / mm Specific cutting energy Ee, spec. = Ee/Qz n Energy per unit Cutting power Pe / W n Power consumption → increase process parameters For real process evaluation the process result has to be related to the changes on the product. For cutting processes the relation of the specific energy Ec, spec=Ee/Qz is a workpiece independent relation. © WZL/Fraunhofer IPT Seite 18
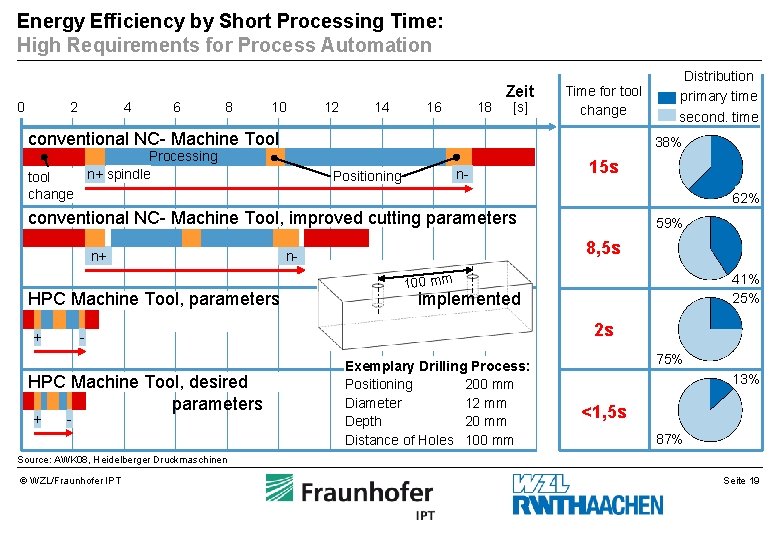
Energy Efficiency by Short Processing Time: High Requirements for Process Automation 0 2 4 6 8 10 12 14 16 18 Zeit [s] Time for tool change conventional NC- Machine Tool 38% Processing n+ spindle tool change n- Positioning 15 s 62% conventional NC- Machine Tool, improved cutting parameters n+ HPC Machine Tool, parameters + - 59% 8, 5 s n- 41% 25% 100 mm implemented 2 s - HPC Machine Tool, desired parameters + Distribution primary time second. time Exemplary Drilling Process: Positioning 200 mm Diameter 12 mm Depth 20 mm Distance of Holes 100 mm 75% 13% <1, 5 s 87% Source: AWK 08, Heidelberger Druckmaschinen © WZL/Fraunhofer IPT Seite 19
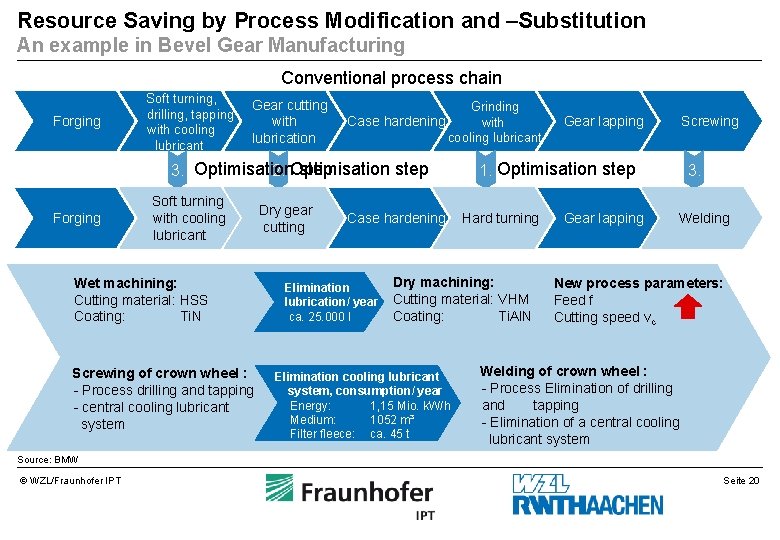
Resource Saving by Process Modification and –Substitution An example in Bevel Gear Manufacturing Conventional process chain Forging Soft turning, drilling, tapping with cooling lubricant Gear cutting with lubrication Grinding Case hardening with cooling lubricant step 3. Optimisation 2. Optimisation Forging Soft turning, Gear cutting Soft turning Dry gear cutting drilling, tapping Gear with cooling cutting dry lubricant lubrication lubricant Wet machining: Cutting material: HSS Coating: Ti. N Screwing of crown wheel : - Process drilling and tapping - central cooling lubricant system Dry machining: Cutting material: VHM Coating: Ti. Al. N Elimination cooling lubricant system, consumption/ year Energy: 1, 15 Mio. k. W/h Medium: 1052 m³ Filter fleece: ca. 45 t Screwing 1. Optimisation step Grinding turning with Hard turning Case hardening Hard cooling lubricant Elimination lubrication/ year ca. 25. 000 l Gear lapping 3. Welding Screwing New process parameters: Feed f Cutting speed vc Welding of crown wheel : - Process Elimination of drilling and tapping - Elimination of a central cooling lubricant system Source: BMW © WZL/Fraunhofer IPT Seite 20
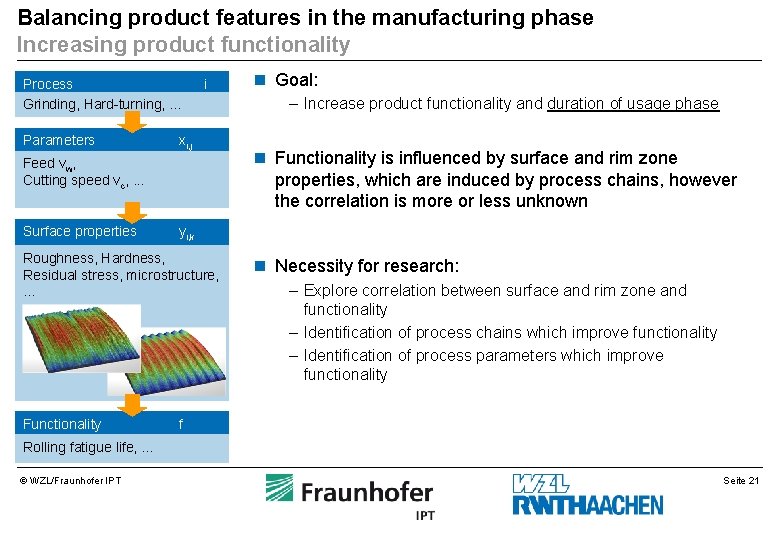
Balancing product features in the manufacturing phase Increasing product functionality Process Grinding, Hard-turning, . . . Parameters i xi, j Feed vw, Cutting speed vc, . . . Surface properties n Functionality is influenced by surface and rim zone properties, which are induced by process chains, however the correlation is more or less unknown yi, k Roughness, Hardness, Residual stress, microstructure, . . . Functionality n Goal: – Increase product functionality and duration of usage phase n Necessity for research: – Explore correlation between surface and rim zone and functionality – Identification of process chains which improve functionality – Identification of process parameters which improve functionality f Rolling fatigue life, . . . © WZL/Fraunhofer IPT Seite 21
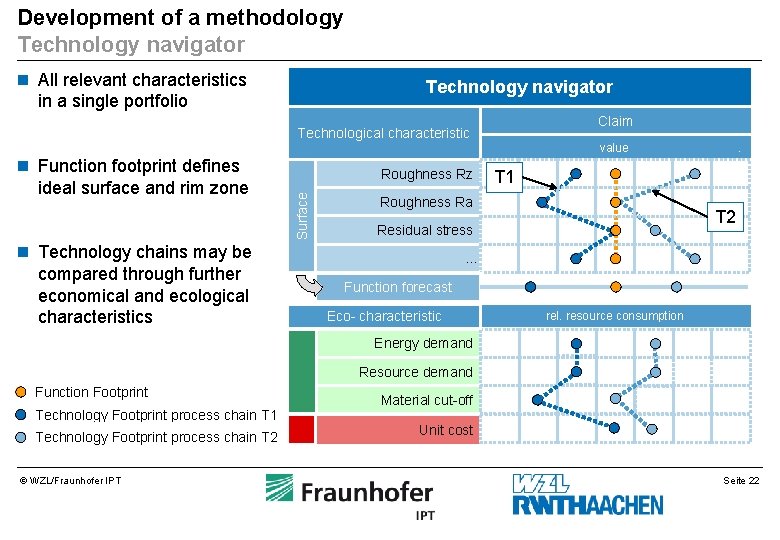
Development of a methodology Technology navigator n All relevant characteristics Technology navigator in a single portfolio Claim Technological characteristic n Function footprint defines Surface ideal surface and rim zone Roughness Rz . T 1 Roughness Ra T 2 Residual stress n Technology chains may be compared through further economical and ecological characteristics value . . . Function forecast Eco- characteristic rel. resource consumption Energy demand Resource demand Function Footprint Technology Footprint process chain T 1 Technology Footprint process chain T 2 © WZL/Fraunhofer IPT Material cut-off Unit cost Seite 22
Agenda 1 Introduction 2 Fields of Action in Energy- and Ressource-Efficient Manufacturing 3 Balancing 4 Adapted Process-Design leading to Resource- and Energy-Savings 5 Summary © WZL/Fraunhofer IPT Seite 23
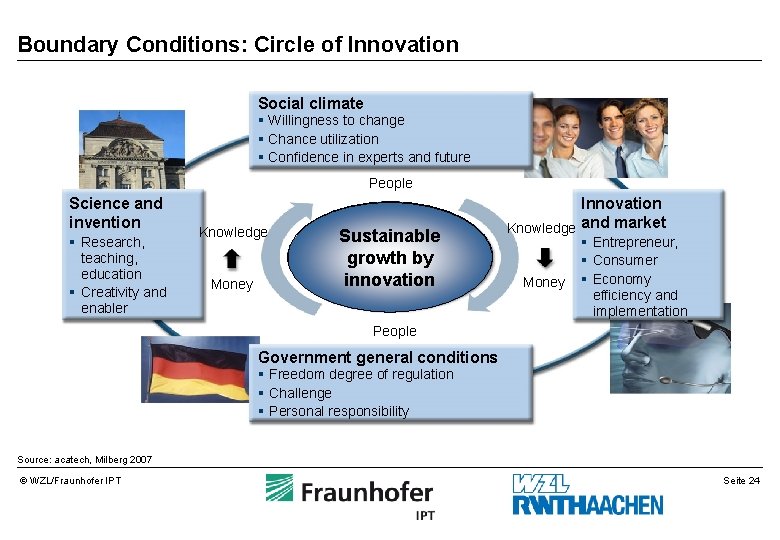
Boundary Conditions: Circle of Innovation Social climate § Willingness to change § Chance utilization § Confidence in experts and future People Science and invention § Research, teaching, education § Creativity and enabler Knowledge Money Sustainable growth by innovation Innovation Knowledge and market Money § Entrepreneur, § Consumer § Economy efficiency and implementation People Government general conditions § Freedom degree of regulation § Challenge § Personal responsibility Source: acatech, Milberg 2007 © WZL/Fraunhofer IPT Seite 24