Energy and Phases Potential Energy stored energy stored

 • Kinetic Energy")


 exits Releases energy (heat) when new products")

 goes in Reaction absorbs heat from the")


 • • • Heat absorbed/released by a reaction H")
 + O 2(g) → CO 2(g), exothermic")


 • Endothermic • Examples : dry")


 m =")

")


- Slides: 45
Energy and Phases
• Potential Energy - stored energy (stored in bonds, height) • Kinetic Energy - energy of motion, associated with heat
Forms of Energy • • • Light - light waves, electromagnetic radiation Electrical Chemical Heat Mechanical - moving parts, machines Atomic/Nuclear - changes in mass (nucleus) of an atom
Conservation of Energy • Energy can be converted from one form to another but never destroyed • The total amount of energy is always constant
Exothermic Reactions • • • Energy (heat) exits Releases energy (heat) when new products are formed Potential Energy of the reactants is greater than the potential energy of the products Surroundings feel warm because heat was released Heat is a product Ex: AB A + B + heat
Exothermic Potential Energy Diagram Potential Energy of the Reactants = Potential Energy 700 k. J Potential Energy of the Products = Activation Energy = 500 k. J Heat of Reaction = 300 k. J Reaction coordinate
Endothermic Reactions • • • Energy (heat) goes in Reaction absorbs heat from the environment Potential energy of the reactants is less than the potential energy of the products Surroundings feel cold because heat was absorbed from the surrounding Heat is a reactant Ex: A + B + heat AB
Endothermic Potential Energy Diagram • Potential Energy of the Reactants = • Potential Energy of the Products = • Activation Energy = • Heat of Reaction =
Activation Energy • The energy needed to break the bonds (to get the reaction started) • Energy to get over the “hill”, difference between your starting point and the top of the hill • All reactions need activation energy
Heat of Reaction ( H) • • • Heat absorbed/released by a reaction H = HP - HR If H is negative, Exothermic If H is positive, Endothermic The heat of reaction for selected reactions is given on Reference Table I
Table I 1. Is the reaction, C(s) + O 2(g) → CO 2(g), exothermic or endothermic? 2. What is the value of ΔH for the reaction, CO 2(g) → C(s) + O 2(g)
Catalyst • Speeds up the reaction • Lowers the activation energy • Provides an alternate pathway for the reaction (still start and end in the same spot)
Heat and Temperature • Heat and temperature are not the same – Heat – type of energy – Temperature – measures the average kinetic energy of a substance’s particles • The faster the particles move (more KE), the higher the temperature • Heat flows from high to low until an equilibrium is established (Hot Cold)
Heat/Temp Examples 1. If two systems at different temperatures have contact with each other, heat will flow from the system at a. b. c. d. 20 o. C to a system at 303 K 30 o. C to a system at 313 K 40 o. C to a system at 293 K 50 o. C to a system at 333 K 2. Which is not a form of energy? a. Light c. Heat b. Temperature d. Motion 3. Which has the most kinetic energy? a. 10. 0 g of H 2 O at 70 o. C c. 25. 0 g of H 2 O at 60 o. C b. 10. 0 g of H 2 O at 5 o. C d. 25. 0 g of H 2 O at 10 o. C
• Definite shape • Definite volume • Very high attractive forces between molecules • Neighboring particles are very close together • Crystalline structure
• Kinetic Energy – solids have KE – Particles are constantly vibrating (around their positions in the crystal) – Positions do not change in relation to the other particles in the crystal – At absolute zero (O K) all movement stops (theoretically)
Liquids • Definite Volume • Take the shape of the container • High attractive forces between molecules (but not as high as those found in solids) • Particles move freely • Particles have more kinetic energy (compared to the solid phase)
Gases • No Definite Volume • No Definite Shape • They take the shape of the container and volume of their container • Very spread out • Weak attractive forces • Particles move rapidly • Particles have very high kinetic energy
Melting • Solid to liquid phase change • Also called fusion • Endothermic
Freezing • Liquid to solid phase change • Also called solidification or crystallization • Exothermic
Boiling • Liquid to gas phase change • Also called vaporization or evaporation • Endothermic
Condensation • Gas to liquid phase change • Endothermic
Sublimation • Solid phase gas phase (skip liquid) • Endothermic • Examples : dry ice CO 2(s) CO 2(g) Iodine I 2(s) I 2(g) Naphthalene (moth balls)
Deposition • Reverse of sublimation • Direct change from the gas to the solid phase, skip liquid • Exothermic • Example: Frost
Melting Point n n Temperature where the solid and liquid phase exist in equilibrium Equivalent to the freezing point As energy is added to the solid, KE of the particles increases until they have sufficient energy to overcome the forces holding them in the crystal, the substance begins to melt and the particles spread apart Melting
Boiling Point • • • Temperature where the liquid and gas phase exist in equilibrium Equivalent to the point of condensation As energy is added to the liquid, KE of the particles increases until they have sufficient energy to overcome the intermolecular forces holding them in place, the particles enter the gas phase and spread out
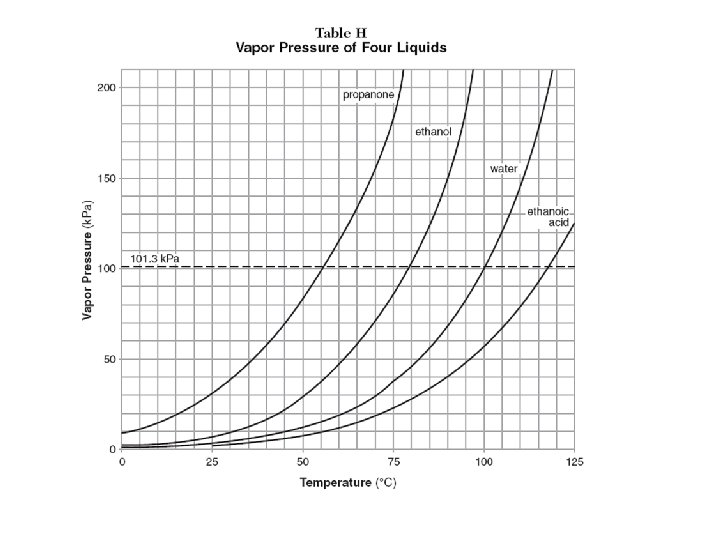
Vapor Pressure • • • Pressure of a gas on a liquid In a closed system (sealed container) the vapor evaporating from the liquid exerts pressure on the liquid Vapor Pressure increases as the temperature of the liquid increases It has specific values for each substance at any given temperature Table H
Vapor Pressure / Boiling Point • • A liquid will boil when its vapor pressure = atmospheric pressure Water boils at 100 o. C at 101. 3 k. Pa (1 atm) – Pressures below 101. 3 k. Pa (high elevations), water boils below 100 o. C – Pressures greater than 101. 3 k. Pa (below sea level), water boils above 100 o. C
Table H Examples 1. What is the vapor pressure of water at 105 o. C? 2. If the pressure is 30 k. Pa, what temperature will water boil at? 3. What pressure is needed for ethanol to boil at 50 o. C? 4. Which liquid on Table H has the strongest intermolecular forces?
Heat of Fusion • Heat needed to melt • Amount of heat needed to convert 1. 0 gram of a substance from a solid to liquid at a constant temperature • q = m. Hf q = heat (J) m = mass (g) Hf = heat of fusion (J/g) Hf for water = 334 J/g (Table B)
Hf Examples 1. How much energy is needed to change 75 g of ice at Oo. C to water at the same temperature? 2. 11, 000 J of heat are released as a sample of water at Oo. C freezes. Calculate the mass of the sample.
Melting/Freezing • Melting is an endothermic process, the H 2 O absorbs 334 J/g • Freezing is the reverse process, so it is exothermic, the H 2 O releases 334 J/g
Heat of Vaporization • • Heat to vaporize / boil / evaporate Amount of heat needed to convert 1. 0 g of a substance from liquid to vapor at a constant temperature
Heat of Vaporization • q = m. Hv q = heat (J) m = mass (g) Hv = heat of vaporization Hv for water = 2260 J/g (Table B) Examples: 1. How much heat must be supplied to evaporate 50. g of H 2 O at 100 o. C? 2. 12, 750 J of heat are used to boil a sample of water. Calculate the mass of the sample.
Boiling and Condensation • Boiling is an endothermic process, the H 2 O absorbs 2260 J/g • Condensation is the reverse process, so it is exothermic, the H 2 O releases 2260 J/g
Change in Temperature Calcs • q = mc T – q = heat (Joules) – m = mass – C = specific heat capacity • Specific heat capacity = the amount of energy needed to raise the temperature of one gram by one degree Celsius • (for water; c = 4. 18 J/go. C) *given on Table B – T = change in temperature
Examples 1. How many joules does it take to raise the temperature of a 5. 0 g sample of water from 20. o. C to 65 o. C? 2. A 1000. gram mass of water in a calorimeter has its temperature raised 5. 0 o. C. How much heat energy was transferred to the water? 3. 17, 500 J of heat are absorbed as a sample of water is heated from 12 o. C to 35 o. C. Find the mass of the sample.
Rate of Heating • Total amount of heat absorbed = time x rate of heating q= t x rate Example: A solid is heated at a constant rate of 150 J/min for 3 minutes. How much heat is absorbed?
Phase Diagrams / Heating and Cooling Curves • When a sample of matter is heated its temperature usually increases. Increase in KE causes an increase in temp. • Sometimes matter can gain or lose heat without changing temperature. What is going on at this point?
Points to remember: • When heat is used to increase the speed of particles, the temperature increases – at this point the KE is changing • When heat does not cause a change in temperature, it is being used to change phases (phase changes occur at the flat parts of the graph) – at this point PE is changing • Melting Point - point when the solid begins to melt, both the solid and liquid phases are present • Boiling Point - point when the liquid begins to boil, both the liquid and gas phases are present
Heating Curve
Heating Curves • Diagonals – – Only one phase is present Temperature is increasing Kinetic energy is increasing Potential energy remains constant • Horizontals – – – Phase change is occurring 2 phases are present Temperature is constant Kinetic energy remains the same Potential energy increases
Cooling Curve
Cooling Curve • Diagonals – – Only one phase is present Temperature is decreasing Kinetic energy is decreasing Potential energy remains constant • Horizontals – – – Phase change is occurring 2 phases are present Temperature is constant Kinetic energy remains the same Potential energy decreasing