Energetic Budgets Energy in Energy out Energetic Demand


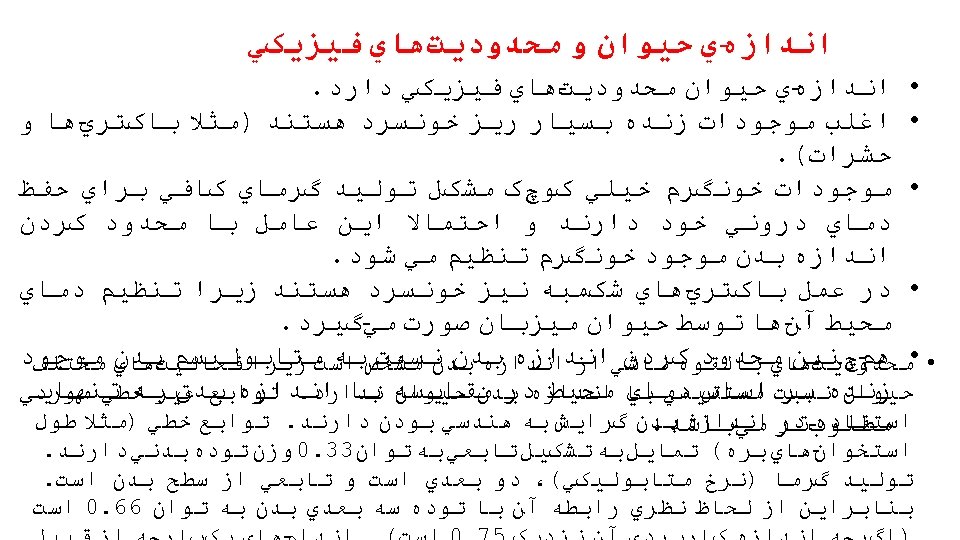
Energetic Budgets Energy in = Energy out Energetic Demand = ◦Activity Costs ◦Maintenance Costs ◦ Thermoregulatory Costs ◦SDA (cost of digestion) Important to Remember: Metabolism varies with temperature, activity level, diet, lactation, pregnancy, time of day, age, gender, EVERYTHING. 2
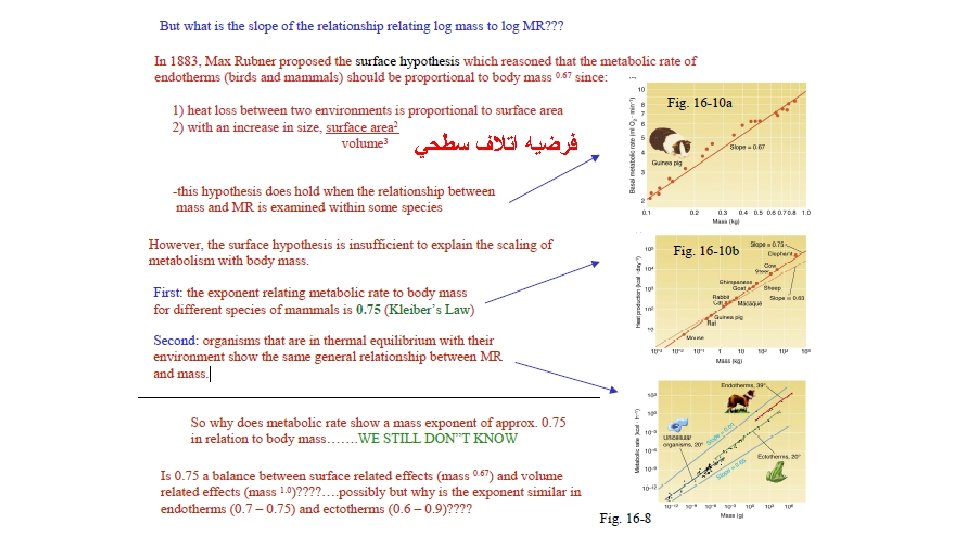
 metabolic rates (RMR; loge. RMR in k. J day-1) of 639 mammals")
Resting (basal) metabolic rates (RMR; loge. RMR in k. J day-1) of 639 mammals (A) and 381 birds (D) as a function of body mass (Mb, in g). [Least-squares fit equations: mammals, loge. BMR=0. 781+0. 677 loge. Mb, F=6605. 89, P<0. 001, r 2=0. 915, RMA gradient=0. 708; birds, . . . © 2005 by The Company of Biologists Ltd Speakman J R J Exp Biol 2005; 208: 1717 -1730
 - basal or")
The Caloric Balance Equation Caloric Balance = + food ingested (kcal) - basal or resting metabolic rate (kcal) - thermogenesis (kcal) - work or exercise metabolism (kcal) - energy excreted in waste products (kcal) 4

5

6

7

10
 of 530 mammal species across")
Fig. 1. Inter-specific variation in resting metabolic rate (MR) of 530 mammal species across a five-order-ofmagnitude range in body mass (data from Lovegrove 2000). Although body mass explains 95% of the variation in resting MR observed across all mammals, within narrower ranges of body size variation mass accounts for a much smaller proportion of resting MR variation. For example, from 100 to 200 g (inset), mass accounts for only 17% of variation in MR which varies 3. 6 -fold between 133 g tenrecs Hemicentetes semispinosus (64 ml O 2 h 1) and 139 g cotton rats Sigmodon hispidus (230 ml O 2 h 1) (black squares). Large differences in resting MR of similar-sized mammals occurs at all body masses, including a 6. 4 -fold difference between the MR of 8. 1 g shrews Sorex araneus (60. 2 ml O 2 h 1) and 8. 5 g roundleaf bats Hipposideros galeritus (9. 4 ml O 2 h 1) (black circles) and a 4. 8 -fold difference between the resting MR of 8 kg wild dogs Lycaon pictus (5862 ml O 2 h 1) and 10 kg echidnas Zaglossus bruijni (1215 ml O 2 h 1) (black triangles). 12

13

14

• THE PRINCIPLE OF DYNAMIC ENERGY ALLOCATION • Animals can ingest only a limited amount of food, and only some of the ingested energy is assimilated. • The portion of the assimilated energy left after the energetic costs of standard and active metabolism are met is ``surplus power'' (Stearns, 1992). ﻧﻈﺮﻳﻪ ﺍﻧﺮژﻰ ﻣﺎﺯﺍﺩ • Surplus power is partitioned into two important biological processes (Hirshfield and Tinkle, 1975; Perrin and Sibly, 1993; Stearns, 1992): Ø somatic effort (e. g. , growth, development) and Ø reproductive effort (e. g. , maturation, offspring production, reproductive behaviors). • Until sexual maturity, energy is liberally allocated to somatic effort, which allows rapid growth and development. Once maturity is achieved, however, the surplus power must be optimally allocated to each of the two processes. Because somatic effort and reproductive effort directly compete for the surplus power, an increase in energy allocated for somatic effort must necessarily be accompanied by a corresponding decrease in energy that can be allocated for reproductive effort, and vice versa. This type of energy allocation conflict is thought to result in trade-offs among life history traits (Stearns, 1992). 15

17

18
 • BMR estimates rate of energy use • Energy not")
Basal Metabolic Rate (BMR) • BMR estimates rate of energy use • Energy not captured is released as heat: – serves important homeostatic purpose • Is the minimum resting energy expenditure: – – of an awake and alert person measured under standardized testing conditions Involves monitoring respiratory activity Energy utilization is proportional to oxygen consumption 19

Some energy estimation equation for feed evaluation using chemical components of feed 20

• d. NDF 48 : Ash, fat, crude protein, ADICP, NDF, 48 h NDF, PAF • Lignin : Ash, fat, crude protein, ADICP, NDF, lignin, PAF. 21

22

23
 24")
Robinson P. H. (2001) 24

TDN 1 x is the TDN value of a feed or diet at maintenance intake (NRC, 2001). Because NEL 1 x at maintenance is not representative of the energy value of feed or diet at production level, a discount factor was developed to correct for decrease net energy levelat production (NEl, 3 x). In UCD factorial approach to estimate feed energy levels. Adiscount energy factor was formulated based on NDF and NSC content of feedstuff and NEl(1 x. M) values as % per unit of energy intake (M). Net energy values for lactation at level production (NEl 3 x. M). The energycontent of a feedstuff is not constant value. As its intake by the animal increase, itsenergy content tends to decline, since it passes through the intestine faster allowingrumen microorganism and intestinal enzymes less time to digest available nutrient. To extent of the change, refer to as the energy discount or simply discount, quantity theextent of this change. The discount is a reflection of the NDF and NSC content of thefeedstuff, and it can be calculated as % per unit of energy intake. 25

26

27

28

29

30

31

32

33
 total energy expenditure (TEE) activity related energy expenditure (AEE) resting")
Physical activity (PA) total energy expenditure (TEE) activity related energy expenditure (AEE) resting metabolic rate (RMR) the caloric cost of activity (CCA) 35

36

37

38

39


41

GROSS ENERGY Feces DIGESTIBLE ENERGY Urine & Gas METABOLIZABLE ENERGY ﺣﺮﺍﺭﺕ ﺗﻮﻟﻴﺪ ﺷﺪﻩ ﻧﺎﺷﻲ ﺍﺯ ﻣﺘﺎﺑﻮﻟﻴﺴﻢ Heat increment NET ENERGY Specific dynamic action ﺍﺛﺮ کﺎﻟﺮﻳک Maintenance Gain Reproduction Milk Production • BASAL METABOLISM • VOLUNTARY ACTIVITY • PRODUCT FORMATION • THERMAL REGULATION • WORK OF DIGESTION • HEAT OF FERMENTATION • WASTE FORMATION AND EXCRETION 42

Figure 3. 1 Overview of food energy flow through the body for maintenance of energy balance 1 1 Additional energy is needed for gains of body tissue, any increase in energy stores, growth of the foetus during pregnancy, production of milk during lactation, and energy losses associated with synthesis/deposition of new tissue or milk. Source: Adapted from Warwick and Baines (2000) and Livesey (in press [a]). 43

CONCEPTUAL DIFFERENCES BETWEEN METABOLIZABLE ENERGY AND NET METABOLIZABLE ENERGY ME has traditionally been defined as “food energy available for heat production (= energy expenditure) and body gains” (Atwater and Bryant, 1900), and more recently as “the amount of energy available for total (whole body) heat production at nitrogen and energy balance” (Livesey, 2001). By contrast, net metabolizable energy (NME) is based on the ATP-producing capacity of foods and their components, rather than on the total heat-producing capacity of foods. It can be thought of as the “food energy available for body functions that require ATP”. The theoretical appeal of NME for the derivation of energy conversion factors rests on the following: substrates are known to differ in the efficiency with which they are converted to ATP, and hence in their ability to fuel energy needs of the body. These differences in efficiency are reflected in the differences between heat production from each substrate and that from glucose; they can be determined stoichiometrically and can be measured. Furthermore, foods replace each other as energy sources in the diet and in intermediary metabolism on the basis of their ATP equivalence (which is reflected in NME), rather than on their ability to produce equal amounts of heat (which is reflected in ME). For more of the derivations of and differences between ME and NME see the detailed discussions of Warwick and Baines (2000) and Livesey (2001). 44

CURRENT STATUS OF FOOD ENERGY CONVERSION FACTORS • Just as a large number of analytical methods for food analysis have been developed since the late nineteenth century, so have a variety of different energy conversion factors for foods. • In general, three systems are in use: • the Atwater general factor system; • a more extensive general factor system; • and an Atwater specific factor system. • It is important to note that all of these systems relate conceptually to (ME). • A general factor system based on NME has been proposed by Livesey (2001) as an alternative to these systems. 45

The Atwater general factor system • The Atwater general factor system was developed by W. O. Atwater and his colleagues at the USDA (Atwater and Woods, 1896). • The system is based on the heats of combustion of protein, fat and carbohydrate, which are corrected for losses in digestion, absorption and urinary excretion of urea. • It uses a single factor for each of the energy-yielding substrates (protein, fat, carbohydrate), regardless of the food in which it is found. • The energy values are 17 k. J/g (4. 0 kcal/g) for protein, 37 k. J/g (9. 0 kcal/g) for fat and 17 k. J/g (4. 0 kcal/g) for carbohydrates. [ • The Atwater general system also includes alcohol with a rounded value of 29 k. J/g (7. 0 kcal/g or an unrounded value of 6. 9 kcal/g) (Atwater and Benedict, 1902). • As originally described by Atwater, carbohydrate is determined by difference, and thus includes fibre. • The Atwater system has been widely used, in part because of its obvious simplicity. 46

The extensive general factor system • A more extensive general factor system has been derived by modifying, refining and making additions to the Atwater general factor system. • For example, separate factors were needed so that the division of total carbohydrate into available carbohydrate and fibre could be taken into account. In 1970, Southgate and Durnin (1970) added a factor for available carbohydrate expressed as monosaccharide (16 k. J/g [3. 75 kcal/g]). • This change recognized the fact that different weights for available carbohydrate are obtained depending on whether the carbohydrate is measured by difference or directly. • In recent years, an energy factor for dietary fibre of 8. 0 k. J/g (2. 0 kcal/g) (FAO, 1998) has been recommended, but has not yet been implemented. • In arriving at this factor, fibre is assumed to be 70 percent fermentable. • It should also be recognized that some of the energy generated by fermentation is lost as gas and some is incorporated into colonic bacteria and lost in the faeces. • As already mentioned, there also general factors in use for alcohol (29 k. J/g [7. 0 kcal/g]), organic acids (13 k. J/g [3. 0 kcal/g]) (Codex Alimentarius, 2001) and polyols (10 k J/g (2. 4 kcal/g]), as well as individual factors for specific polyols and for different organic acids (Livesey et al. , 2000; for an example of a national specification, see Canada’s at: http: //www. inspection. gc. ca/english/bureau/labeti/guide/6 -4 e. shtml). 47

The Atwater specific factor system • The Atwater specific factor system, a refinement based on reexamination of the Atwater system, was introduced in 1955 by Merrill and Watt (1955). • It integrates the results of 50 years of research and derives different factors for proteins, fats and carbohydrates, depending on the foods in which they are found. Whereas Atwater used average values of protein, fat and total carbohydrate, Merrill and Watt emphasized that there are ranges in the heats of combustion and in the coefficients of digestibility of different proteins, fats and carbohydrates, and these should be reflected in the energy values applied to them. • The following two examples help to make this clearer: 1) Because proteins differ in their amino acid composition, they also differ in their heats of combustion. Thus, the heat of combustion of protein in rice is approximately 20 percent higher than that of protein in potatoes, and different energy factors should be used for each. 2) Digestibility (and fibre content) of a grain may be affected by how it is milled. Thus, the available energy from equal amounts (weight) of wholewheat flour (100 percent extraction) and extensively milled wheat flour (70 percent extraction) will be different. 48

The Atwater specific factor system • • Based on these considerations, a system - or rather a set of tables - was created with substantial variability in the energy factors applied to various foods (see examples in Table 3. 1). Among the foods that provide substantial amounts of energy as protein in the ordinary diet, energy conversion factors in the Atwater specific factor system vary, for example, from 10. 2 k. J/g (2. 44 kcal/g) for some vegetable proteins to 18. 2 k. J/g (4. 36 kcal/g) for eggs. Factors for fat vary from 35 k. J/g (8. 37 kcal/g) to 37. 7 k. J/g (9. 02 kcal/g), and those for total carbohydrate from 11. 3 k. J/g (2. 70 kcal/g) in lemon and lime juices to 17. 4 k. J/g (4. 16 kcal/g) in polished rice. These ranges for protein, fat and carbohydrate are, respectively, 44, 7 and 35 percent. Merrill and Watt (1973) compared the energy values for different representative foods and food groups derived using these new specific factors with those derived using general Atwater factors (Table 3. 2). Application of general factors to the mixed diet common in the United States resulted in values that were on average about 5 percent higher than those obtained with specific factors. There were several foods (for example, snap beans, cabbage and lemons) for which the differences ranged from 20 to 38 percent. When these foods were not included, the average difference between general and specific factor values was 2 percent. The Atwater specific factor system appears to be superior to the original Atwater general system, which took only protein, fat, total carbohydrate and alcohol into account. However, it may not be vastly superior to the more extensive general factor system, which takes into account the differentiation between available carbohydrate and dietary fibre, and recognizes sources of energy other than protein, carbohydrates and fat. 49

TABLE 3. 1 Atwater specific factors for selected foods * Carbohydrate factor is 3. 87 for brain, heart, kidney, liver; and 4. 11 for tongue and shellfish. # Unsweetened. § Original data were published in kcal/g; values for k. J/g have been calculated from calorie values. Hence, in this table, kcal values are given first, in italics, with k. J values following, in parenthesis. Source: Modified from Merrill and Watt (1973).

Net metabolizable energy system • ME values can be modified further to account for energy that is lost as heat from different substrates via heat of fermentation and obligatory thermogenesis, i. e. energy that would not be available for the production of ATP to fuel metabolism. This results in the NME factors. • The NME system retains a general factor approach, i. e. a single factor each for protein, fat, available carbohydrate, dietary fibre, alcohol, etc. that can be applied to all foods. This obviates the need for extensive tables. • The differences of importance between ME and NME factors are found primarily in estimating the energy content of protein, fermentable, unavailable carbohydrate, and alcohol (Table 3. 3). • NME factor for protein is 13 k. J/g (3. 2 kcal/g) versus the Atwater general factor of 17 k. J/g (4. 0 kcal/g). Use of the NME rather than the Atwater general factor results in a 24 percent decrease in energy from protein. • The recommended ME factor for dietary fibre in ordinary diets is 8 k. J/g (2. 0 kcal/g); the corresponding NME value is 6 k. J/g (1. 4 kcal/g) - a decrease of 25 percent. Values for fermentable fibre are believed to vary by 27 percent, i. e. ME 11 k. J/g (2. 6 kcal/g) and NME 8 k. J/g (2. 0 kcal/g). Finally, the values for alcohol are 29 k. J/g (7. 0 kcal/g) for ME, and 26 k. J/g (6. 3 kcal/g) for NME - a difference of 10 percent. 51

Net metabolizable energy system • The lower NME values for dietary fibre are due to a higher assumed loss of energy through heat of fermentation, while those for alcohol seem to be due to thermogenesis following alcohol consumption. The discrepancy between energy values calculated using ME and those using NME conversion factors will be greatest for diets that are high in protein and dietary fibre, as well as for some novel food components 52

53

• Visceral organs have a significant impact on the partitioning of ME between heat energy loss and NE available for peripheral tissue gain (Webster, 1980; Koong et al. , 1985). • the relationship between ME intake (MEI) and visceral organ mass (Johnson et al. , 1990). • Seal and Reynolds (1993) demonstrated a positive relationship between MEI and portal-drained viscera (PDV) heat production (R 2 = 0. 612). • Subsequently, we have demonstrated that changes in PDV heat production associated with MEI and dietary composition are a function of changes in digestive tract organ mass rather than oxidative capacity (Baldwin and Mc. Leod, 2000; Mc. Leod and Baldwin, 2000). • Small intestinal starch digestion increases PDV and peripheral glucose utilization relative to ruminal starch digestion (Harmon et al. , 2001). • Additionally, indirect calorimetry measures have shown that retained tissue energy is greater for starch digested in the small intestine than that digested ruminally (Mc. Leod et al. , 2001). • In the same study, carbon-N balance indicated that the increase in tissue energy with small intestinal starch infusion was realized as adipose tissue. These observations suggested that composition of tissue accretion may be altered by site of starch infusion. 54

55
 fed at: • 161 (LI) or")
Treatments included a pelleted basal diet (Table 1) fed at: • 161 (LI) or 214 (HI) kcal of ME/ (kg of BW d), • LI plus ruminal (R-SH) or • abomasal (A-SH) infusion of a partial starch hydrolysate (SH), • and LI plus abomasal infusion of glucose (A-G). 0. 75 56

57

58

59

60
- Slides: 60