
End use of hydrogen mobility industry built environment
End use of hydrogen, mobility, industry, built environment Theo Fens Delft University of Technology IDIC/EDI online seminar hydrogen, September 2020
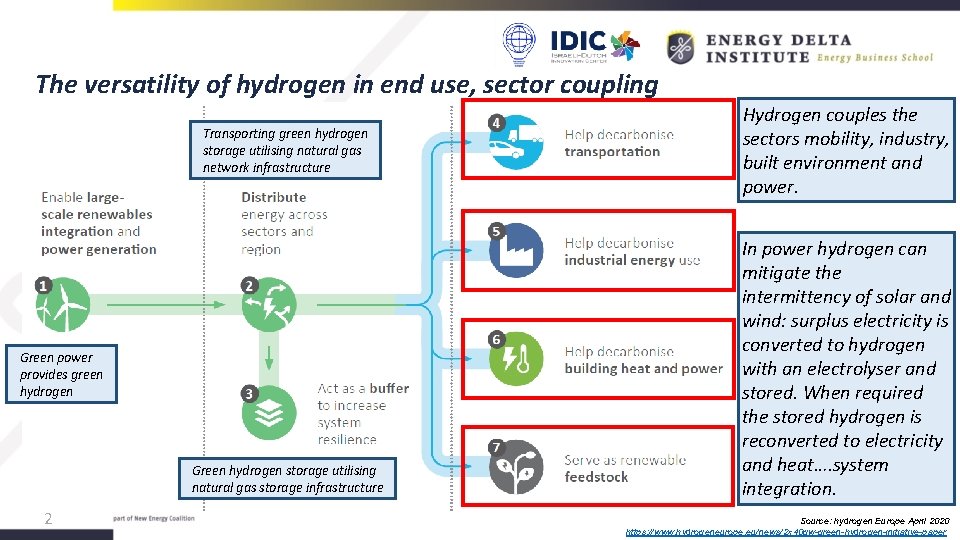
The versatility of hydrogen in end use, sector coupling Transporting green hydrogen storage utilising natural gas network infrastructure Green power provides green hydrogen Green hydrogen storage utilising natural gas storage infrastructure 2 Hydrogen couples the sectors mobility, industry, built environment and power. In power hydrogen can mitigate the intermittency of solar and wind: surplus electricity is converted to hydrogen with an electrolyser and stored. When required the stored hydrogen is reconverted to electricity and heat…. system integration. Source: hydrogen Europe April 2020 https: //www. hydrogeneurope. eu/news/2 x 40 gw-green-hydrogen-initiative-paper
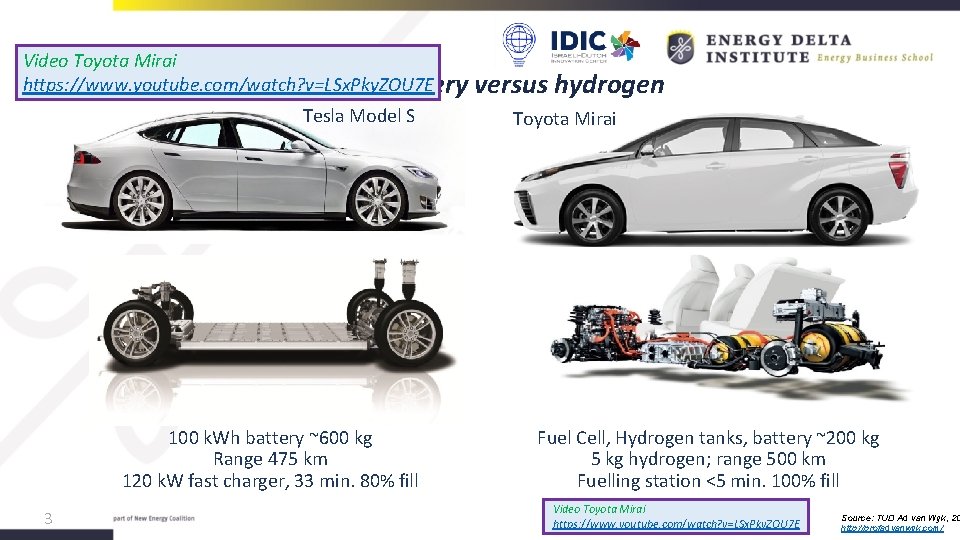
Video Toyota Mirai https: //www. youtube. com/watch? v=LSx. Pky. ZOU 7 E Future mobility will be electric, battery Tesla Model S 100 k. Wh battery ~600 kg Range 475 km 120 k. W fast charger, 33 min. 80% fill 3 versus hydrogen Toyota Mirai Fuel Cell, Hydrogen tanks, battery ~200 kg 5 kg hydrogen; range 500 km Fuelling station <5 min. 100% fill Video Toyota Mirai https: //www. youtube. com/watch? v=LSx. Pky. ZOU 7 E Source: TUD Ad van Wijk, 20 http: //profadvanwijk. com/
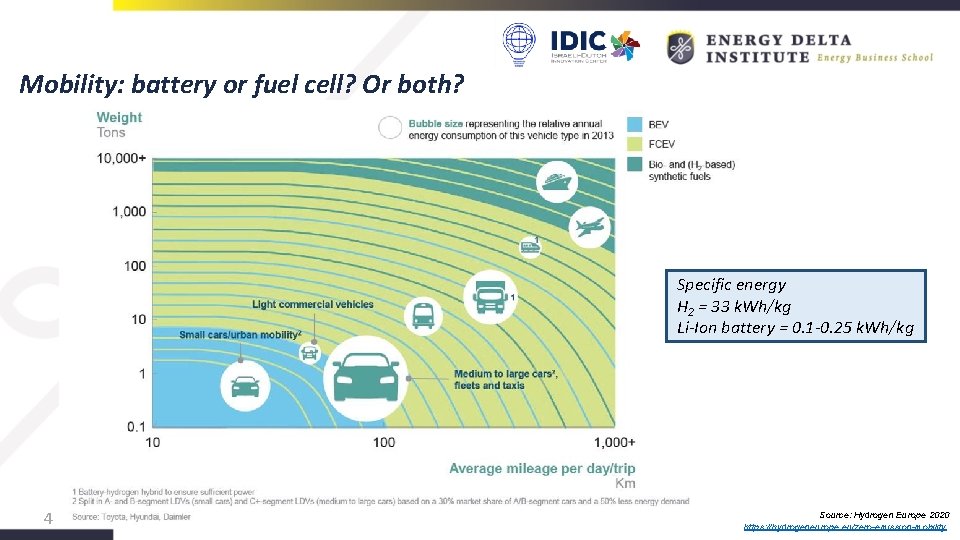
Mobility: battery or fuel cell? Or both? Specific energy H 2 = 33 k. Wh/kg Li-Ion battery = 0. 1 -0. 25 k. Wh/kg 4 Source: Hydrogen Europe 2020 https: //hydrogeneurope. eu/zero-emission-mobility
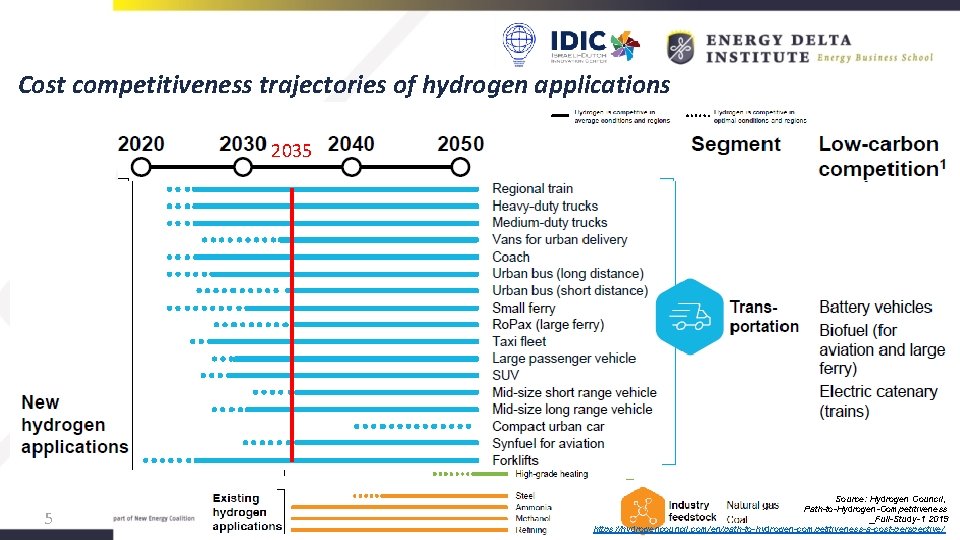
Cost competitiveness trajectories of hydrogen applications 2035 5 Source: Hydrogen Council, Path-to-Hydrogen-Competitiveness _Full-Study-1 2019 https: //hydrogencouncil. com/en/path-to-hydrogen-competitiveness-a-cost-perspective/
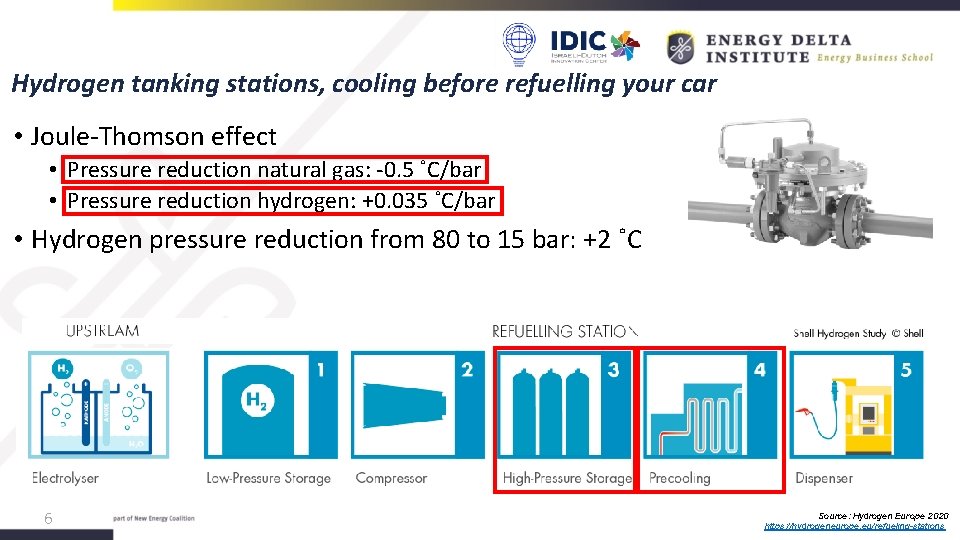
Hydrogen tanking stations, cooling before refuelling your car • Joule-Thomson effect • Pressure reduction natural gas: -0. 5 ˚C/bar • Pressure reduction hydrogen: +0. 035 ˚C/bar • Hydrogen pressure reduction from 80 to 15 bar: +2 ˚C 6 Source: Hydrogen Europe 2020 https: //hydrogeneurope. eu/refueling-stations
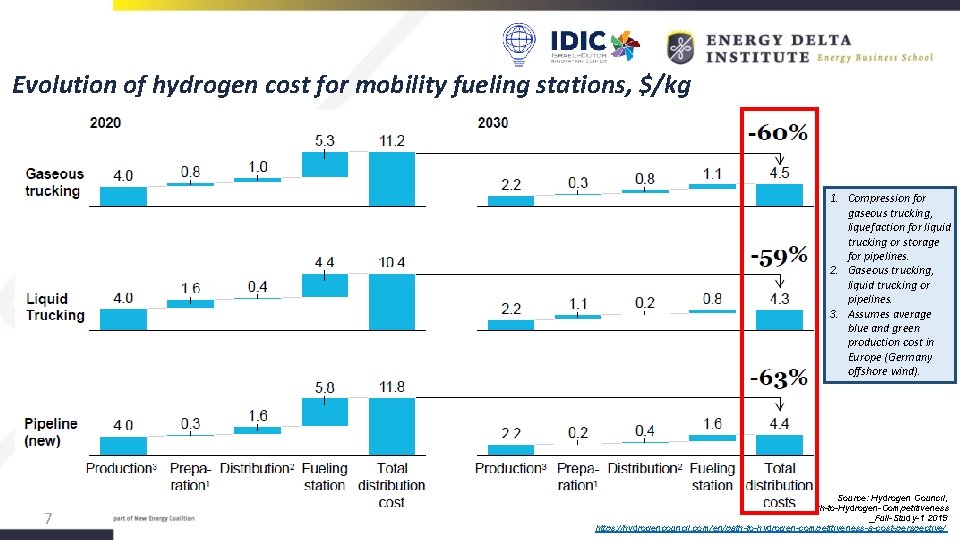
Evolution of hydrogen cost for mobility fueling stations, $/kg 1. Compression for gaseous trucking, liquefaction for liquid trucking or storage for pipelines. 2. Gaseous trucking, liquid trucking or pipelines. 3. Assumes average blue and green production cost in Europe (Germany offshore wind). 7 Source: Hydrogen Council, Path-to-Hydrogen-Competitiveness _Full-Study-1 2019 https: //hydrogencouncil. com/en/path-to-hydrogen-competitiveness-a-cost-perspective/
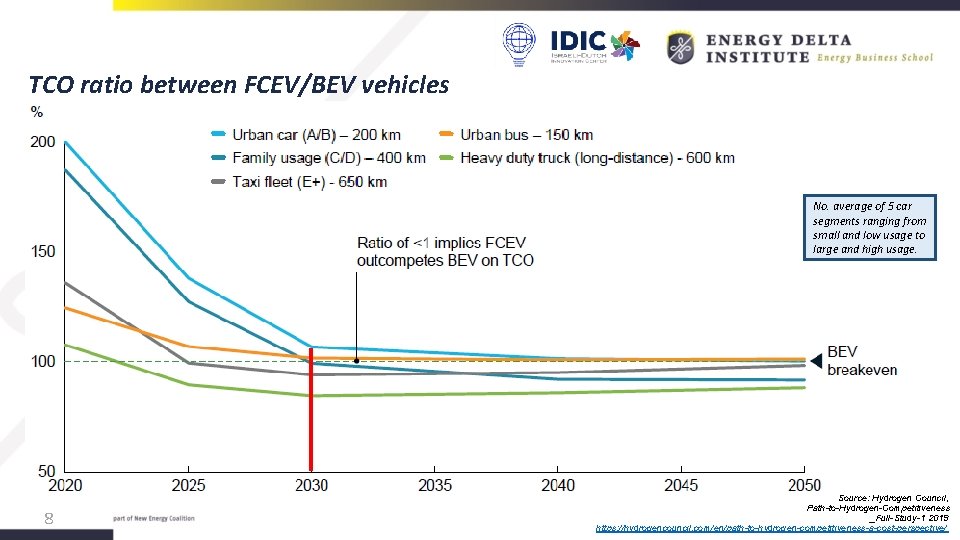
TCO ratio between FCEV/BEV vehicles No. average of 5 car segments ranging from small and low usage to large and high usage. 8 Source: Hydrogen Council, Path-to-Hydrogen-Competitiveness _Full-Study-1 2019 https: //hydrogencouncil. com/en/path-to-hydrogen-competitiveness-a-cost-perspective/
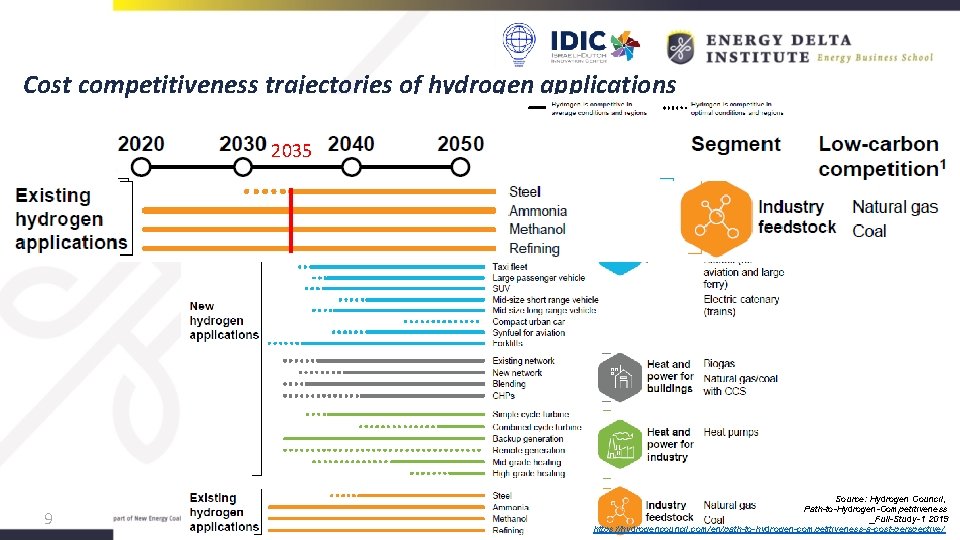
Cost competitiveness trajectories of hydrogen applications 2035 9 Source: Hydrogen Council, Path-to-Hydrogen-Competitiveness _Full-Study-1 2019 https: //hydrogencouncil. com/en/path-to-hydrogen-competitiveness-a-cost-perspective/
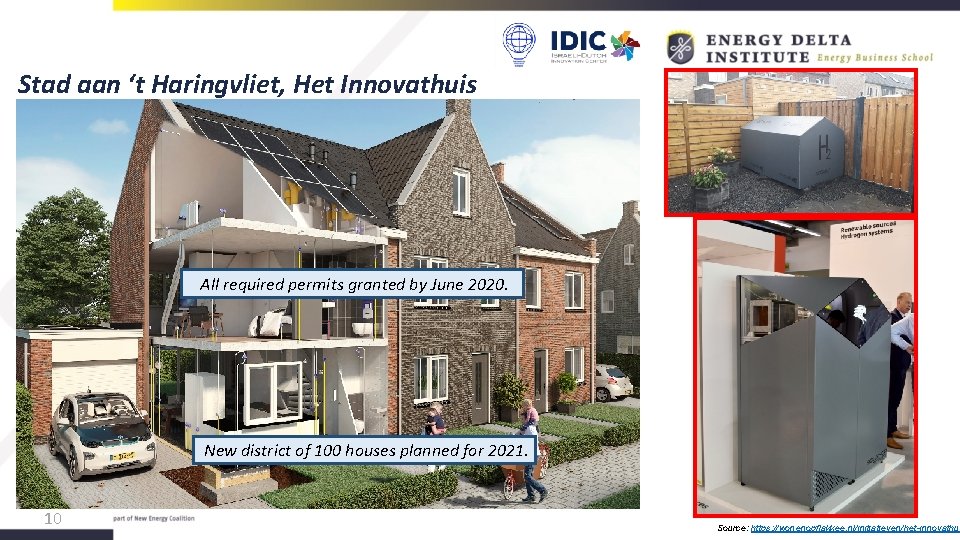
Stad aan ‘t Haringvliet, Het Innovathuis All required permits granted by June 2020. New district of 100 houses planned for 2021. 10 Source: https: //wonenopflakkee. nl/initiatieven/het-innovathui
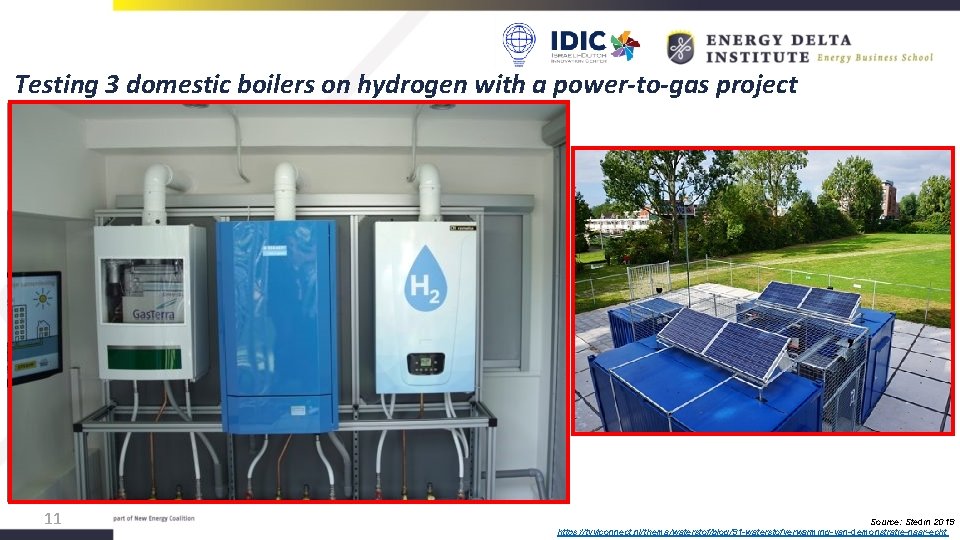
Testing 3 domestic boilers on hydrogen with a power-to-gas project 11 Source: Stedin 2019 https: //tvvlconnect. nl/thema/waterstof/blog/91 -waterstofverwarming-van-demonstratie-naar-echt
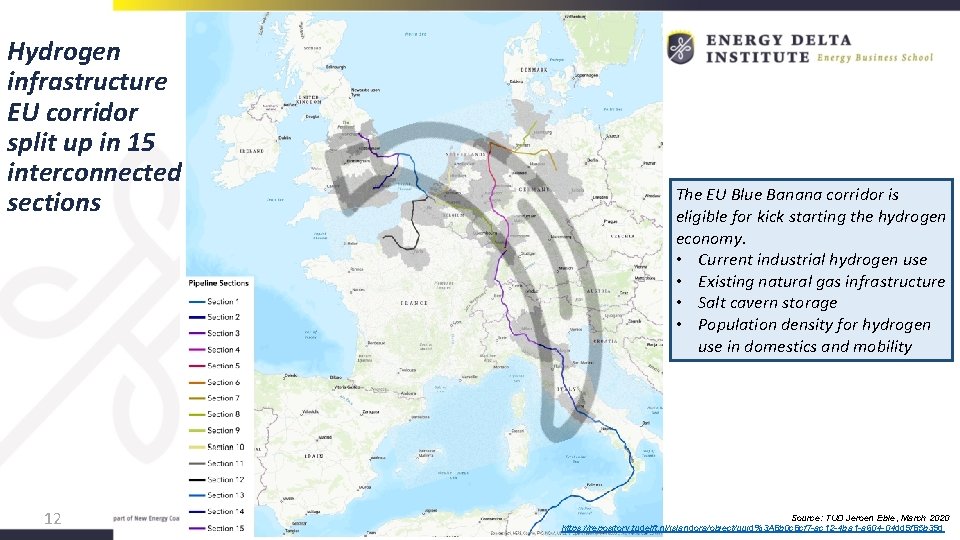
Hydrogen infrastructure EU corridor split up in 15 interconnected sections 12 The EU Blue Banana corridor is eligible for kick starting the hydrogen economy. • Current industrial hydrogen use • Existing natural gas infrastructure • Salt cavern storage • Population density for hydrogen use in domestics and mobility Source: TUD Jeroen Eble, March 2020 https: //repository. tudelft. nl/islandora/object/uuid%3 A 8 b 0 c 8 cf 7 -ac 12 -4 ba 1 -a 604 -04 dd 9 f 85 b 39 d
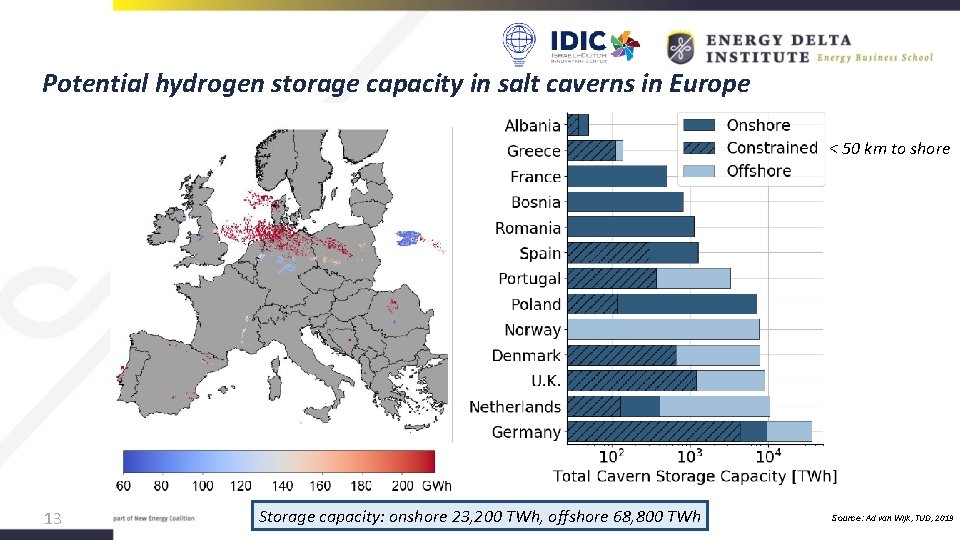
Potential hydrogen storage capacity in salt caverns in Europe < 50 km to shore 13 Storage capacity: onshore 23, 200 TWh, offshore 68, 800 TWh Source: Ad van Wijk, TUD, 2019

Thank you for your attention 14

Backup sheets 15
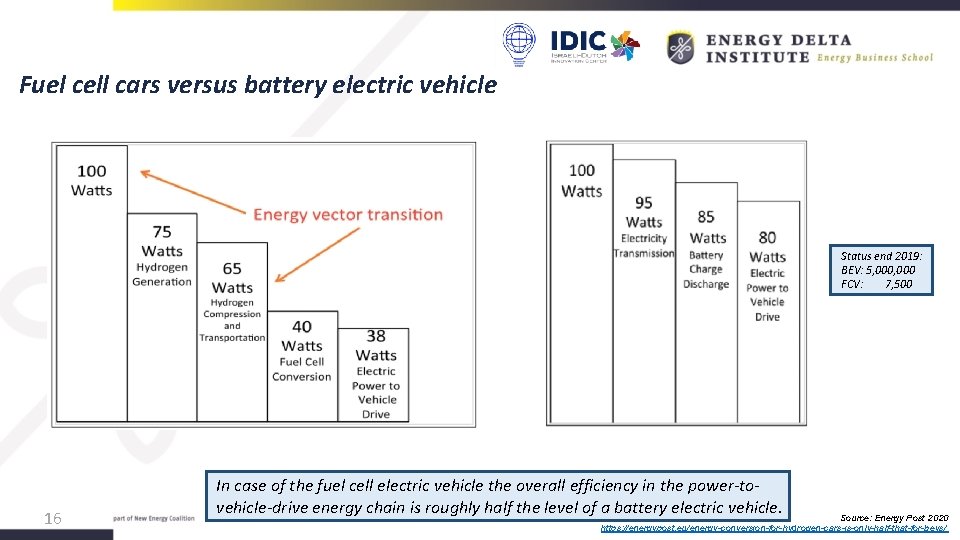
Fuel cell cars versus battery electric vehicle Status end 2019: BEV: 5, 000 FCV: 7, 500 16 In case of the fuel cell electric vehicle the overall efficiency in the power-tovehicle-drive energy chain is roughly half the level of a battery electric vehicle. Source: Energy Post 2020 https: //energypost. eu/energy-conversion-for-hydrogen-cars-is-only-half-that-for-bevs/
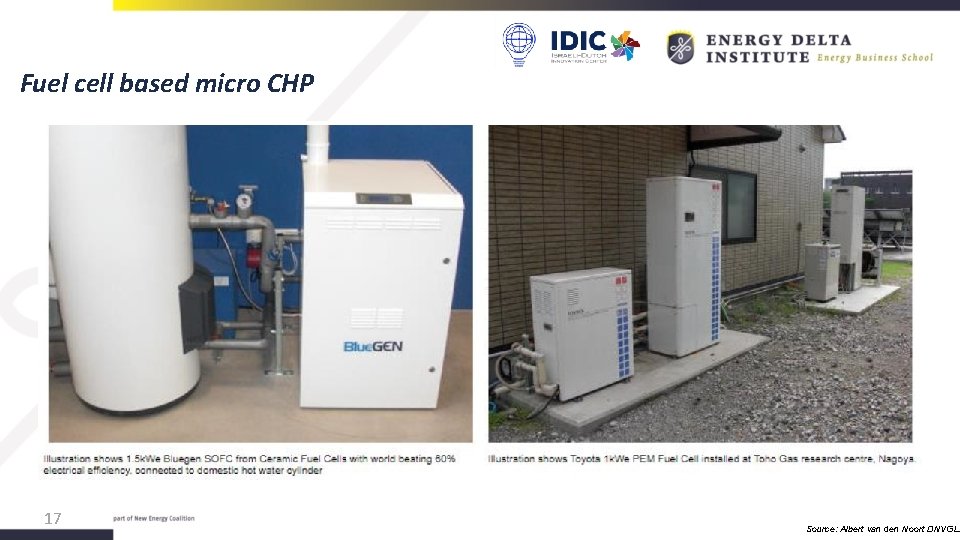
Fuel cell based micro CHP 17 Source: Albert van den Noort DNVGL
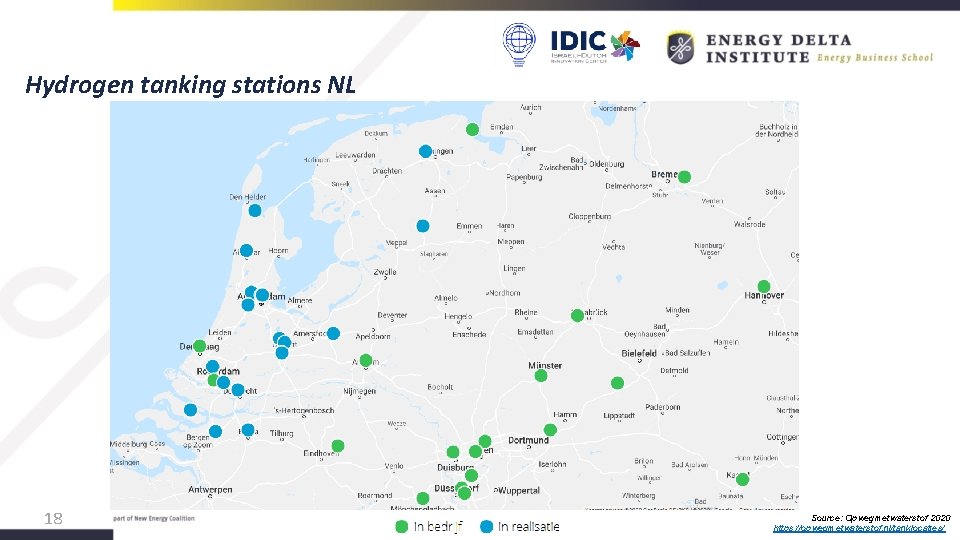
Hydrogen tanking stations NL 18 Source: Opwegmetwaterstof 2020 https: //opwegmetwaterstof. nl/tanklocaties/
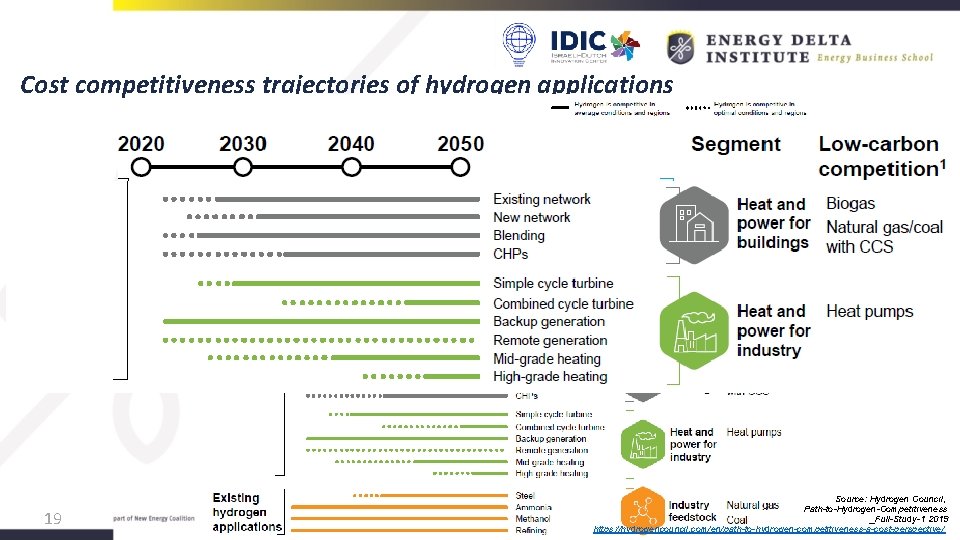
Cost competitiveness trajectories of hydrogen applications 19 Source: Hydrogen Council, Path-to-Hydrogen-Competitiveness _Full-Study-1 2019 https: //hydrogencouncil. com/en/path-to-hydrogen-competitiveness-a-cost-perspective/
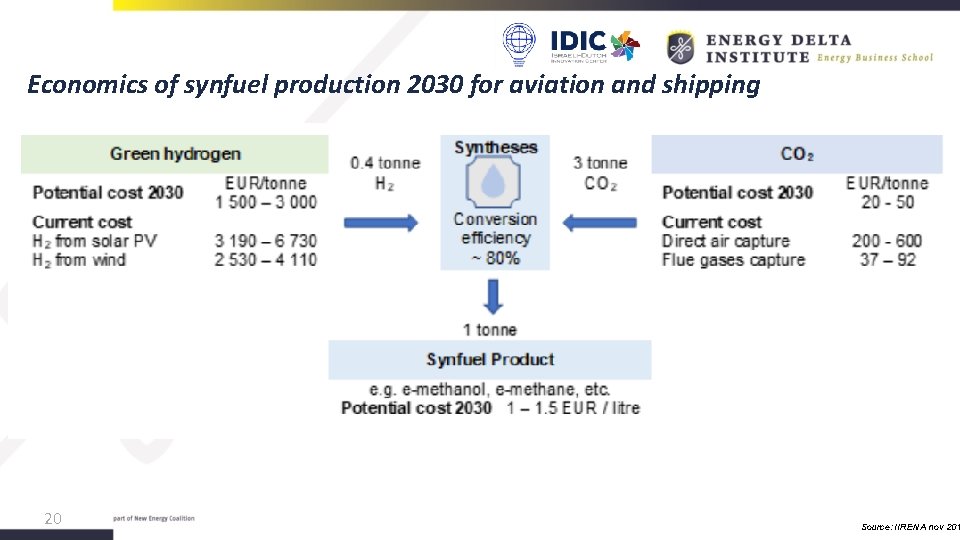
Economics of synfuel production 2030 for aviation and shipping 20 Source: IIRENA nov 201
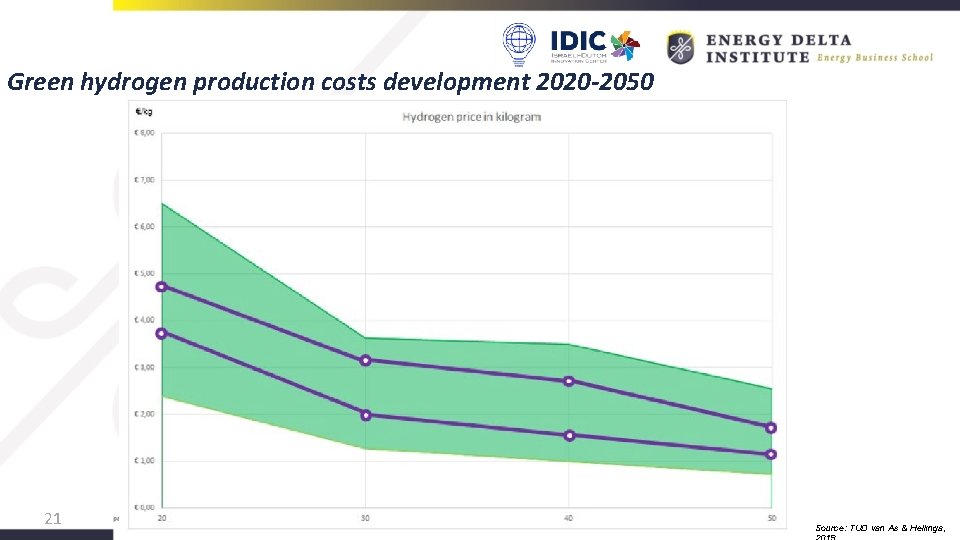
Green hydrogen production costs development 2020 -2050 21 Source: TUD van As & Hellinga,
- Slides: 21