Enabling the IBM Blue Stack with Java Practical
Enabling the IBM Blue Stack with Java Practical Lessons in Memory Analysis Prashanth K Nageshappa Venkataraghavan Lakshminarayanachar Java Technology Center, IBM Software Labs © 2010 IBM Corporation Conference materials may not be reproduced in whole or in part without the prior written permission of IBM.
Enabling the IBM Blue Stack with Java Agenda • Understanding JVM Heaps • Garbage Collection Policies Overview • Sizing the Java Heap • Java Memory Leak and it’s Diagnosis – Garbage Collection and Memory Visualizer [GCMV] – Memory Analyzer Tool [MAT] © 2009 IBM Corporation IBM Software Group | Education www. ibm. com/training/in
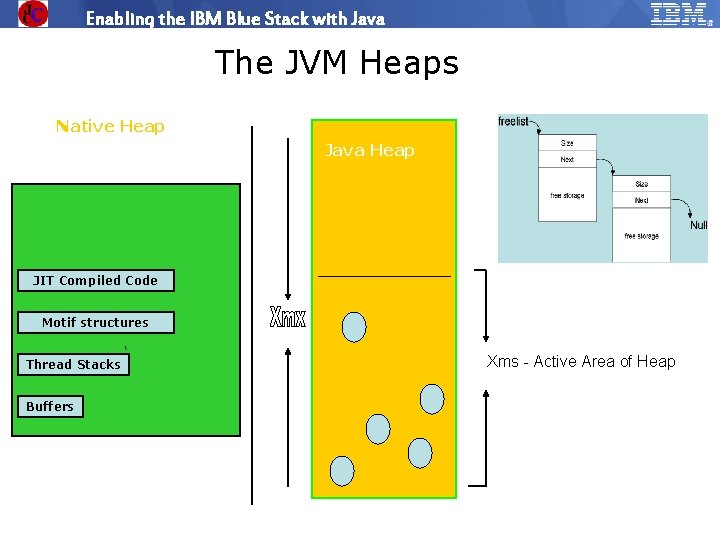
Enabling the IBM Blue Stack with Java The JVM Heaps Native Heap Java Heap JIT Compiled Code Free List Motif structures Thread Stacks ‘ Xms - Active Area of Heap Buffers © 2009 IBM Corporation IBM Software Group | Education www. ibm. com/training/in
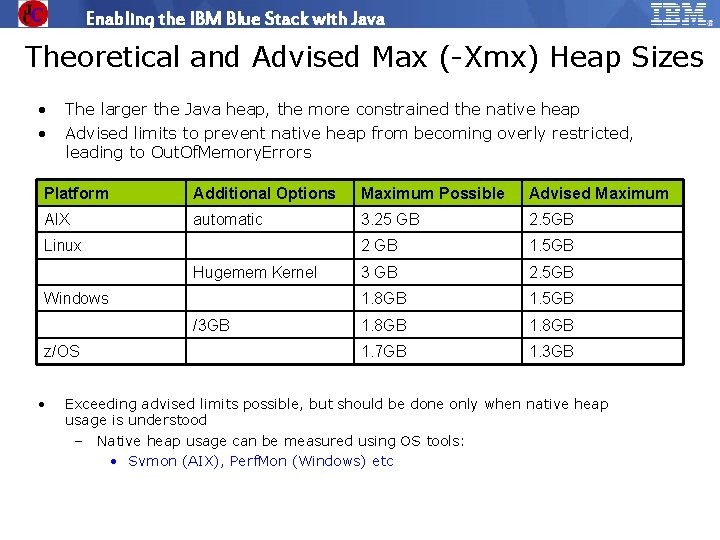
Enabling the IBM Blue Stack with Java Theoretical and Advised Max (-Xmx) Heap Sizes • • The larger the Java heap, the more constrained the native heap Advised limits to prevent native heap from becoming overly restricted, leading to Out. Of. Memory. Errors Platform Additional Options Maximum Possible Advised Maximum AIX automatic 3. 25 GB 2. 5 GB 2 GB 1. 5 GB 3 GB 2. 5 GB 1. 8 GB 1. 7 GB 1. 3 GB Linux Hugemem Kernel Windows /3 GB z/OS • Exceeding advised limits possible, but should be done only when native heap usage is understood – Native heap usage can be measured using OS tools: • Svmon (AIX), Perf. Mon (Windows) etc © 2009 IBM Corporation IBM Software Group | Education www. ibm. com/training/in
Enabling the IBM Blue Stack with Java Effect of wrong –Xms & -Xmx settings Too small heap = Too frequent GC. Too big heap = Too much GC pause time. (Irrespective of amount of physical memory on the system) Heap size > physical memory size = paging/swapping = bad for your application. It is desirable to have the Xms much less than Xmx if you are encountering fragmentation issues. What about Xms=Xmx? It means no heap expansion or shrinkage will ever occur. Not normally recommended. It may be good for a few apps which require constant high heap storage space. Hurts apps which show a varying load. May lead to more fragmentation © 2009 IBM Corporation IBM Software Group | Education www. ibm. com/training/in
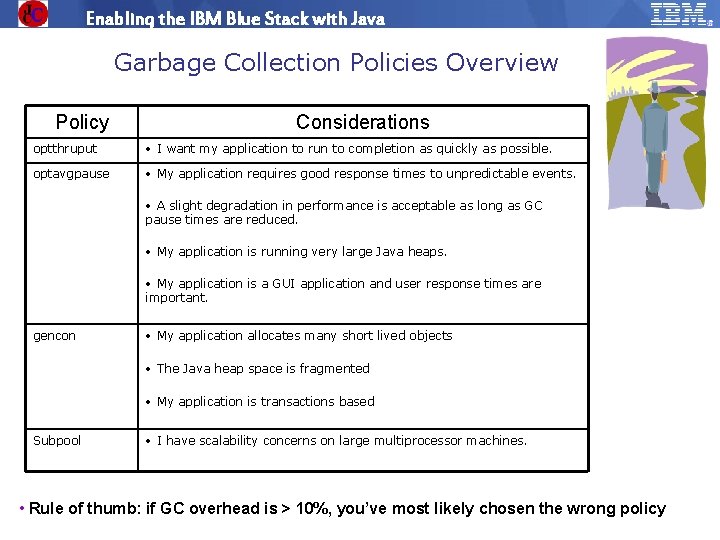
Enabling the IBM Blue Stack with Java Garbage Collection Policies Overview Policy Considerations optthruput • I want my application to run to completion as quickly as possible. optavgpause • My application requires good response times to unpredictable events. • A slight degradation in performance is acceptable as long as GC pause times are reduced. • My application is running very large Java heaps. • My application is a GUI application and user response times are important. gencon • My application allocates many short lived objects • The Java heap space is fragmented • My application is transactions based Subpool • I have scalability concerns on large multiprocessor machines. • Rule of thumb: if GC overhead is > 10%, you’ve most likely chosen the wrong policy © 2009 IBM Corporation IBM Software Group | Education www. ibm. com/training/in
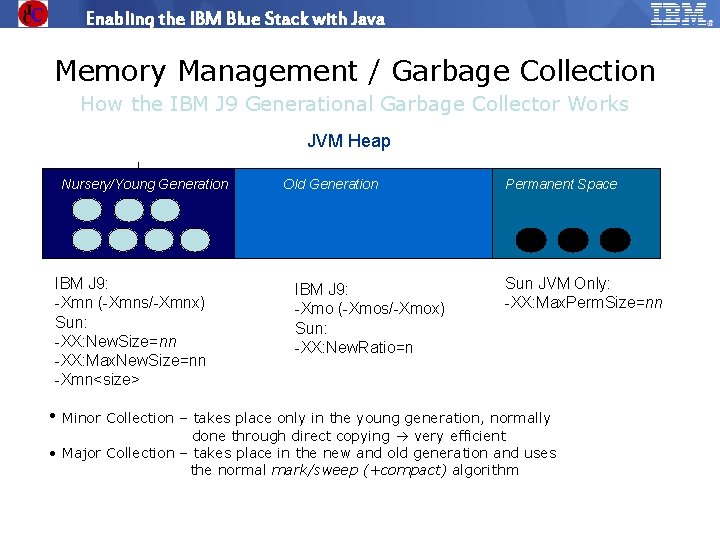
Enabling the IBM Blue Stack with Java Memory Management / Garbage Collection How the IBM J 9 Generational Garbage Collector Works JVM Heap Nursery/Young Generation IBM J 9: -Xmn (-Xmns/-Xmnx) Sun: -XX: New. Size=nn -XX: Max. New. Size=nn -Xmn<size> Old Generation IBM J 9: -Xmo (-Xmos/-Xmox) Sun: -XX: New. Ratio=n Permanent Space Sun JVM Only: -XX: Max. Perm. Size=nn • Minor Collection – takes place only in the young generation, normally done through direct copying very efficient • Major Collection – takes place in the new and old generation and uses the normal mark/sweep (+compact) algorithm © 2009 IBM Corporation IBM Software Group | Education www. ibm. com/training/in
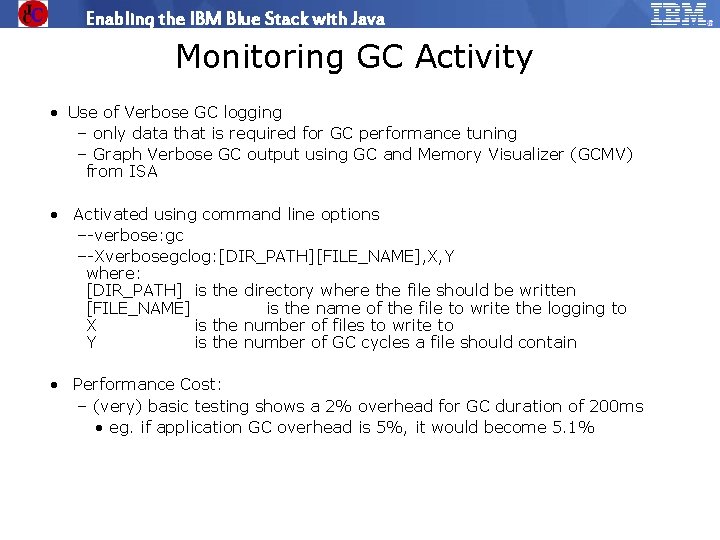
Enabling the IBM Blue Stack with Java Monitoring GC Activity • Use of Verbose GC logging – only data that is required for GC performance tuning – Graph Verbose GC output using GC and Memory Visualizer (GCMV) from ISA • Activated using command line options –-verbose: gc –-Xverbosegclog: [DIR_PATH][FILE_NAME], X, Y where: [DIR_PATH] is the directory where the file should be written [FILE_NAME] is the name of the file to write the logging to X is the number of files to write to Y is the number of GC cycles a file should contain • Performance Cost: – (very) basic testing shows a 2% overhead for GC duration of 200 ms • eg. if application GC overhead is 5%, it would become 5. 1% © 2009 IBM Corporation IBM Software Group | Education www. ibm. com/training/in
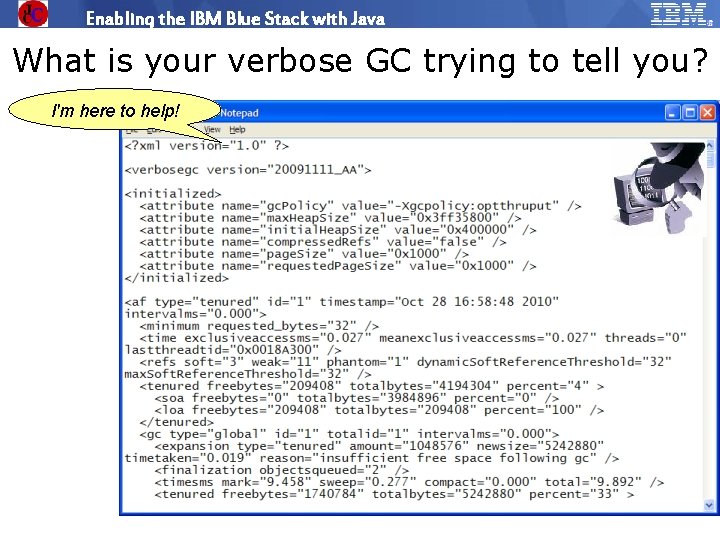
Enabling the IBM Blue Stack with Java What is your verbose GC trying to tell you? I'm here to help! © 2009 IBM Corporation IBM Software Group | Education www. ibm. com/training/in
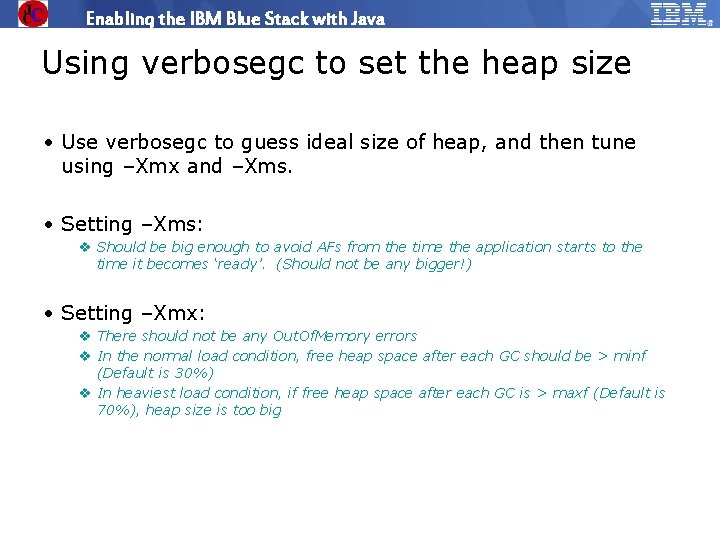
Enabling the IBM Blue Stack with Java Using verbosegc to set the heap size • Use verbosegc to guess ideal size of heap, and then tune using –Xmx and –Xms. • Setting –Xms: v Should be big enough to avoid AFs from the time the application starts to the time it becomes ‘ready’. (Should not be any bigger!) • Setting –Xmx: v There should not be any Out. Of. Memory errors v In the normal load condition, free heap space after each GC should be > minf (Default is 30%) v In heaviest load condition, if free heap space after each GC is > maxf (Default is 70%), heap size is too big © 2009 IBM Corporation IBM Software Group | Education www. ibm. com/training/in
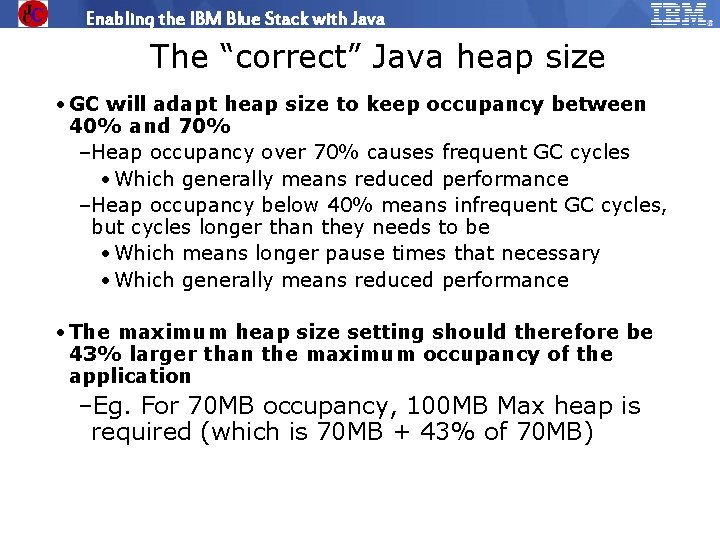
Enabling the IBM Blue Stack with Java The “correct” Java heap size • GC will adapt heap size to keep occupancy between 40% and 70% –Heap occupancy over 70% causes frequent GC cycles • Which generally means reduced performance –Heap occupancy below 40% means infrequent GC cycles, but cycles longer than they needs to be • Which means longer pause times that necessary • Which generally means reduced performance • The maximum heap size setting should therefore be 43% larger than the maximum occupancy of the application –Eg. For 70 MB occupancy, 100 MB Max heap is required (which is 70 MB + 43% of 70 MB) © 2009 IBM Corporation IBM Software Group | Education www. ibm. com/training/in
Enabling the IBM Blue Stack with Java Memory Leaks: Catch me if you Can 12 © 2010 IBM Corporation
Enabling the IBM Blue Stack with Java What is a “Java Memory leak” § Live reference(s) to objects that are not used during the rest of its life – Memory could have been freed and reused § GC won't reclaim as reference(s) are being held by the program – A Java program could run out of memory due to such leaks § Java memory leaks are mostly a result of non-obvious programming errors" 13 © 2010 IBM Corporation
Enabling the IBM Blue Stack with Java How to interpret the Memory Leak Analysis Results? What is leaking? – What is the object (e. g. a Hash. Map) holding all the leaking objects i. e. leak container. – What are the objects getting added to the leak container i. e. leak unit. – Who is holding the leak container in memory? What are the object types and package names of objects on the chain of references from a root object to the leak container i. e. owner chain. 14 © 2010 IBM Corporation
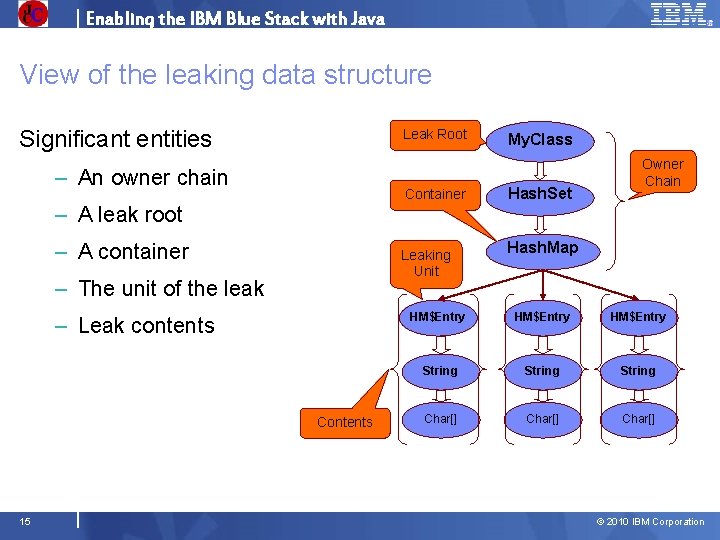
Enabling the IBM Blue Stack with Java View of the leaking data structure Significant entities Leak Root – An owner chain Container – A leak root – A container Leaking Unit – The unit of the leak – Leak contents Contents 15 My. Class Hash. Set Owner Chain Hash. Map HM$Entry String Char[] © 2010 IBM Corporation
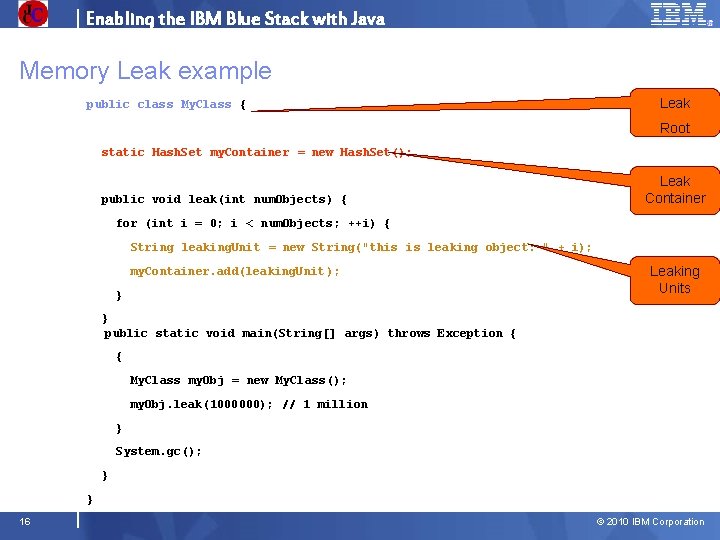
Enabling the IBM Blue Stack with Java Memory Leak example public class My. Class { Leak Root static Hash. Set my. Container = new Hash. Set(); public void leak(int num. Objects) { Leak Container for (int i = 0; i < num. Objects; ++i) { String leaking. Unit = new String("this is leaking object: " + i); my. Container. add(leaking. Unit ); } Leaking Units } public static void main(String[] args) throws Exception { { My. Class my. Obj = new My. Class(); my. Obj. leak(1000000); // 1 million } System. gc(); } } 16 © 2010 IBM Corporation
Enabling the IBM Blue Stack with Java Determining memory leak using GCMV 17 © 2010 IBM Corporation
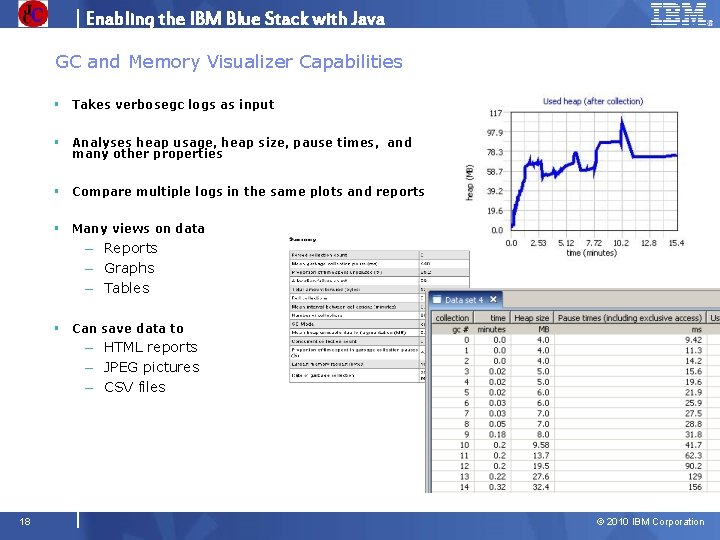
Enabling the IBM Blue Stack with Java GC and Memory Visualizer Capabilities § Takes verbosegc logs as input § Analyses heap usage, heap size, pause times, and many other properties § Compare multiple logs in the same plots and reports § Many views on data – Reports – Graphs – Tables § Can save data to – HTML reports – JPEG pictures – CSV files 18 © 2010 IBM Corporation
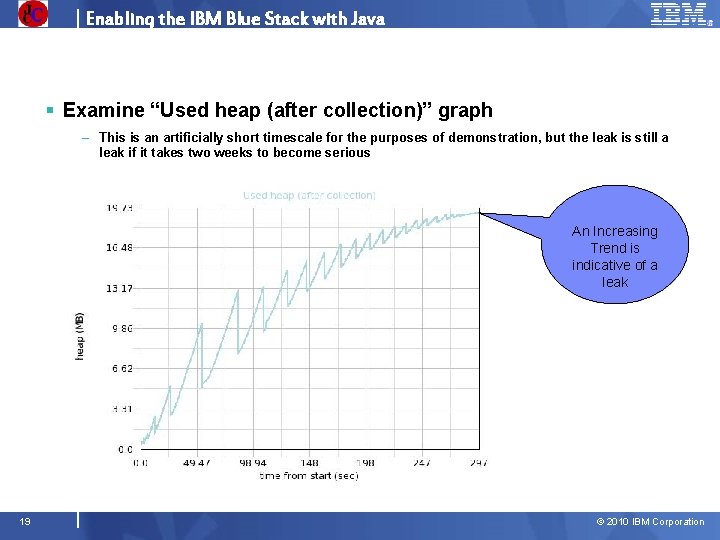
Enabling the IBM Blue Stack with Java § Examine “Used heap (after collection)” graph – This is an artificially short timescale for the purposes of demonstration, but the leak is still a leak if it takes two weeks to become serious An Increasing Trend is indicative of a leak 19 © 2010 IBM Corporation

Enabling the IBM Blue Stack with Java Demo 20 © 2010 IBM Corporation
Enabling the IBM Blue Stack with Java Diagnosing memory leak using MAT 21 © 2010 IBM Corporation
Enabling the IBM Blue Stack with Java What is MAT? § The Eclipse Memory Analyzer Tool (MAT) is a powerful, feature rich, interactive tool which helps developers find and fix memory leaks quickly in simple steps § Helps to find Memory leaks in a click away § Uses less memory to analyze millions of objects quickly and helps you find who is preventing the GC from collecting an object § Gives us reports in the form of pie charts § And more. . § MAT can be downloaded here: – http: //www. ibm. com/developerworks/java/jdk/tools/mat. html 22 © 2010 IBM Corporation
Enabling the IBM Blue Stack with Java When to use? § Useful to analyze – Memory related problems – Identify leak – Heap Fragmentation – In order to understand what the dump has 23 © 2010 IBM Corporation
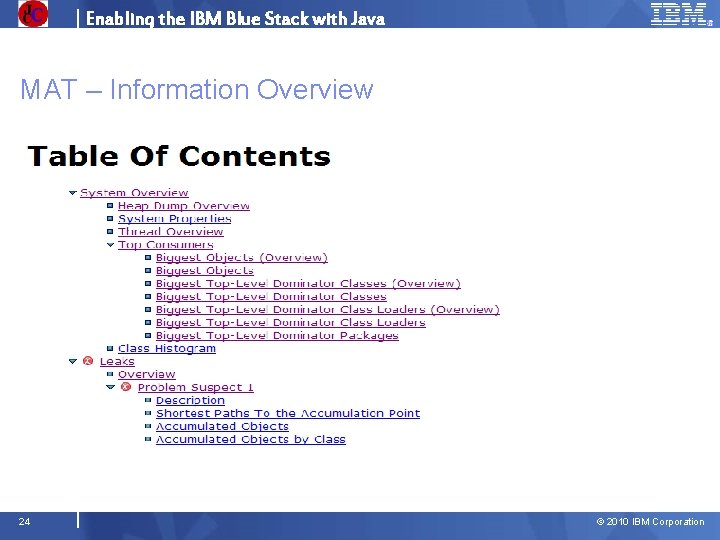
Enabling the IBM Blue Stack with Java MAT – Information Overview 24 © 2010 IBM Corporation
Enabling the IBM Blue Stack with Java Demo 25 © 2010 IBM Corporation
Enabling the IBM Blue Stack with Java References § Java technology, IBM style: Garbage collection policies – http: //www. ibm. com/developerworks/java/library/j-ibmjava 2/ – http: //www. ibm. com/developerworks/java/library/j-ibmjava 3/ § Elusive Bandits : What are Java Memory Leaks ? – http: //www. ibm. com/developerworks/rational/library/05/0816_Gupta. Palanki/ § Want Java Monitoring and Diagnostics Tools ? – https: //www. ibm. com/developerworks/java/jdk/tools/ § Want Java Diagnostics Information ? – http: //www. ibm. com/developerworks/java/jdk/diagnosis § IBM Support Assistant – www. ibm. com/software/support/isa § IBM Java Native Memory – http: //publib. boulder. ibm. com/infocenter/ieduasst/v 1 r 1 m 0/topic/com. ibm. iea. ja va/java/6. 0/Monitor. Debug/2 -Monitoring. Native. Memory. Usage. pdf 26 © 2010 IBM Corporation
Enabling the IBM Blue Stack with Java Russian Gracias Spanish Obrigado Brazilian Portuguese Thank You Simplified Chinese Japanese 27 French Arabic Traditional Chinese Korean Merci Thai Questions? Email: prashanth. k. n@in. ibm. com lvenkata@in. ibm. com Grazie Italian Danke German © 2010 IBM Corporation
Enabling the IBM Blue Stack with Java Disclaimer © IBM Corporation 2010. All Rights Reserved. The workshops, sessions and materials have been prepared by IBM or the session speakers and reflect their own views. They are provided for informational purposes only, and are neither intended to, nor shall have the effect of being, legal or other guidance or advice to any participant. While efforts were made to verify the completeness and accuracy of the information contained in this presentation, it is provided AS IS without warranty of any kind, express or implied. IBM shall not be responsible for any damages arising out of the use of, or otherwise related to, this presentation or any other materials. Nothing contained in this presentation is intended to, nor shall have the effect of, creating any warranties or representations from IBM or its suppliers or licensors, or altering the terms and conditions of the applicable license agreement governing the use of IBM software. References in this presentation to IBM products, programs, or services do not imply that they will be available in all countries in which IBM operates. Product release dates and/or capabilities referenced in this presentation may change at any time at IBM’s sole discretion based on market opportunities or other factors, and are not intended to be a commitment to future product or feature availability in any way. Nothing contained in these materials is intended to, nor shall have the effect of, stating or implying that any activities undertaken by you will result in any specific sales, revenue growth or other results. Performance is based on measurements and projections using standard IBM benchmarks in a controlled environment. The actual throughput or performance that any user will experience will vary depending upon many factors, including considerations such as the amount of multiprogramming in the user's job stream, the I/O configuration, the storage configuration, and the workload processed. Therefore, no assurance can be given that an individual user will achieve results similar to those stated here. All customer examples described are presented as illustrations of how those customers have used IBM products and the results they may have achieved. Actual environmental costs and performance characteristics may vary by customer. The following are trademarks of the International Business Machines Corporation in the United States and/or other countries: ibm. com/legal/copytrade. shtml. AIX, CICSPlex, Data. Power, DB 2 Universal Database, i 5/OS, IBM, the IBM logo, IMS/ESA, Power Systems, Lotus, OMEGAMON, OS/390, Parallel Sysplex, pure. XML, Rational, Redbooks, Sametime, SMART SOA, System z , Tivoli, Web. Sphere, and z/OS. A current list of IBM trademarks is available on the Web at “Copyright and trademark information” at ibm. com/legal/copytrade. shtml. Adobe, the Adobe logo, Post. Script, and the Post. Script logo are either registered trademarks or trademarks of Adobe Systems Incorporated in the United States, and/or other countries. IT Infrastructure Library is a registered trademark of the Central Computer and Telecommunications Agency which is now part of the Office of Government Commerce Java and all Java-based trademarks are trademarks of Sun Microsystems, Inc. in the United States, other countries, or both. Microsoft and Windows are trademarks of Microsoft Corporation in the United States, other countries, or both. ITIL is a registered trademark, and a registered community trademark of the Office of Government Commerce, and is registered in the U. S. Patent and Trademark Office Intel and Pentium are trademarks or registered trademarks of Intel Corporation or its subsidiaries in the United States and other countries. UNIX is a registered trademark of The Open Group in the United States and other countries. Linux is a registered trademark of Linus Torvalds in the United States, other countries, or both. © 2009 IBM Corporation IBM Software Group | Education www. ibm. com/training/in
- Slides: 28