
Enabling biomarker validation in breast cancer molecular subtypes
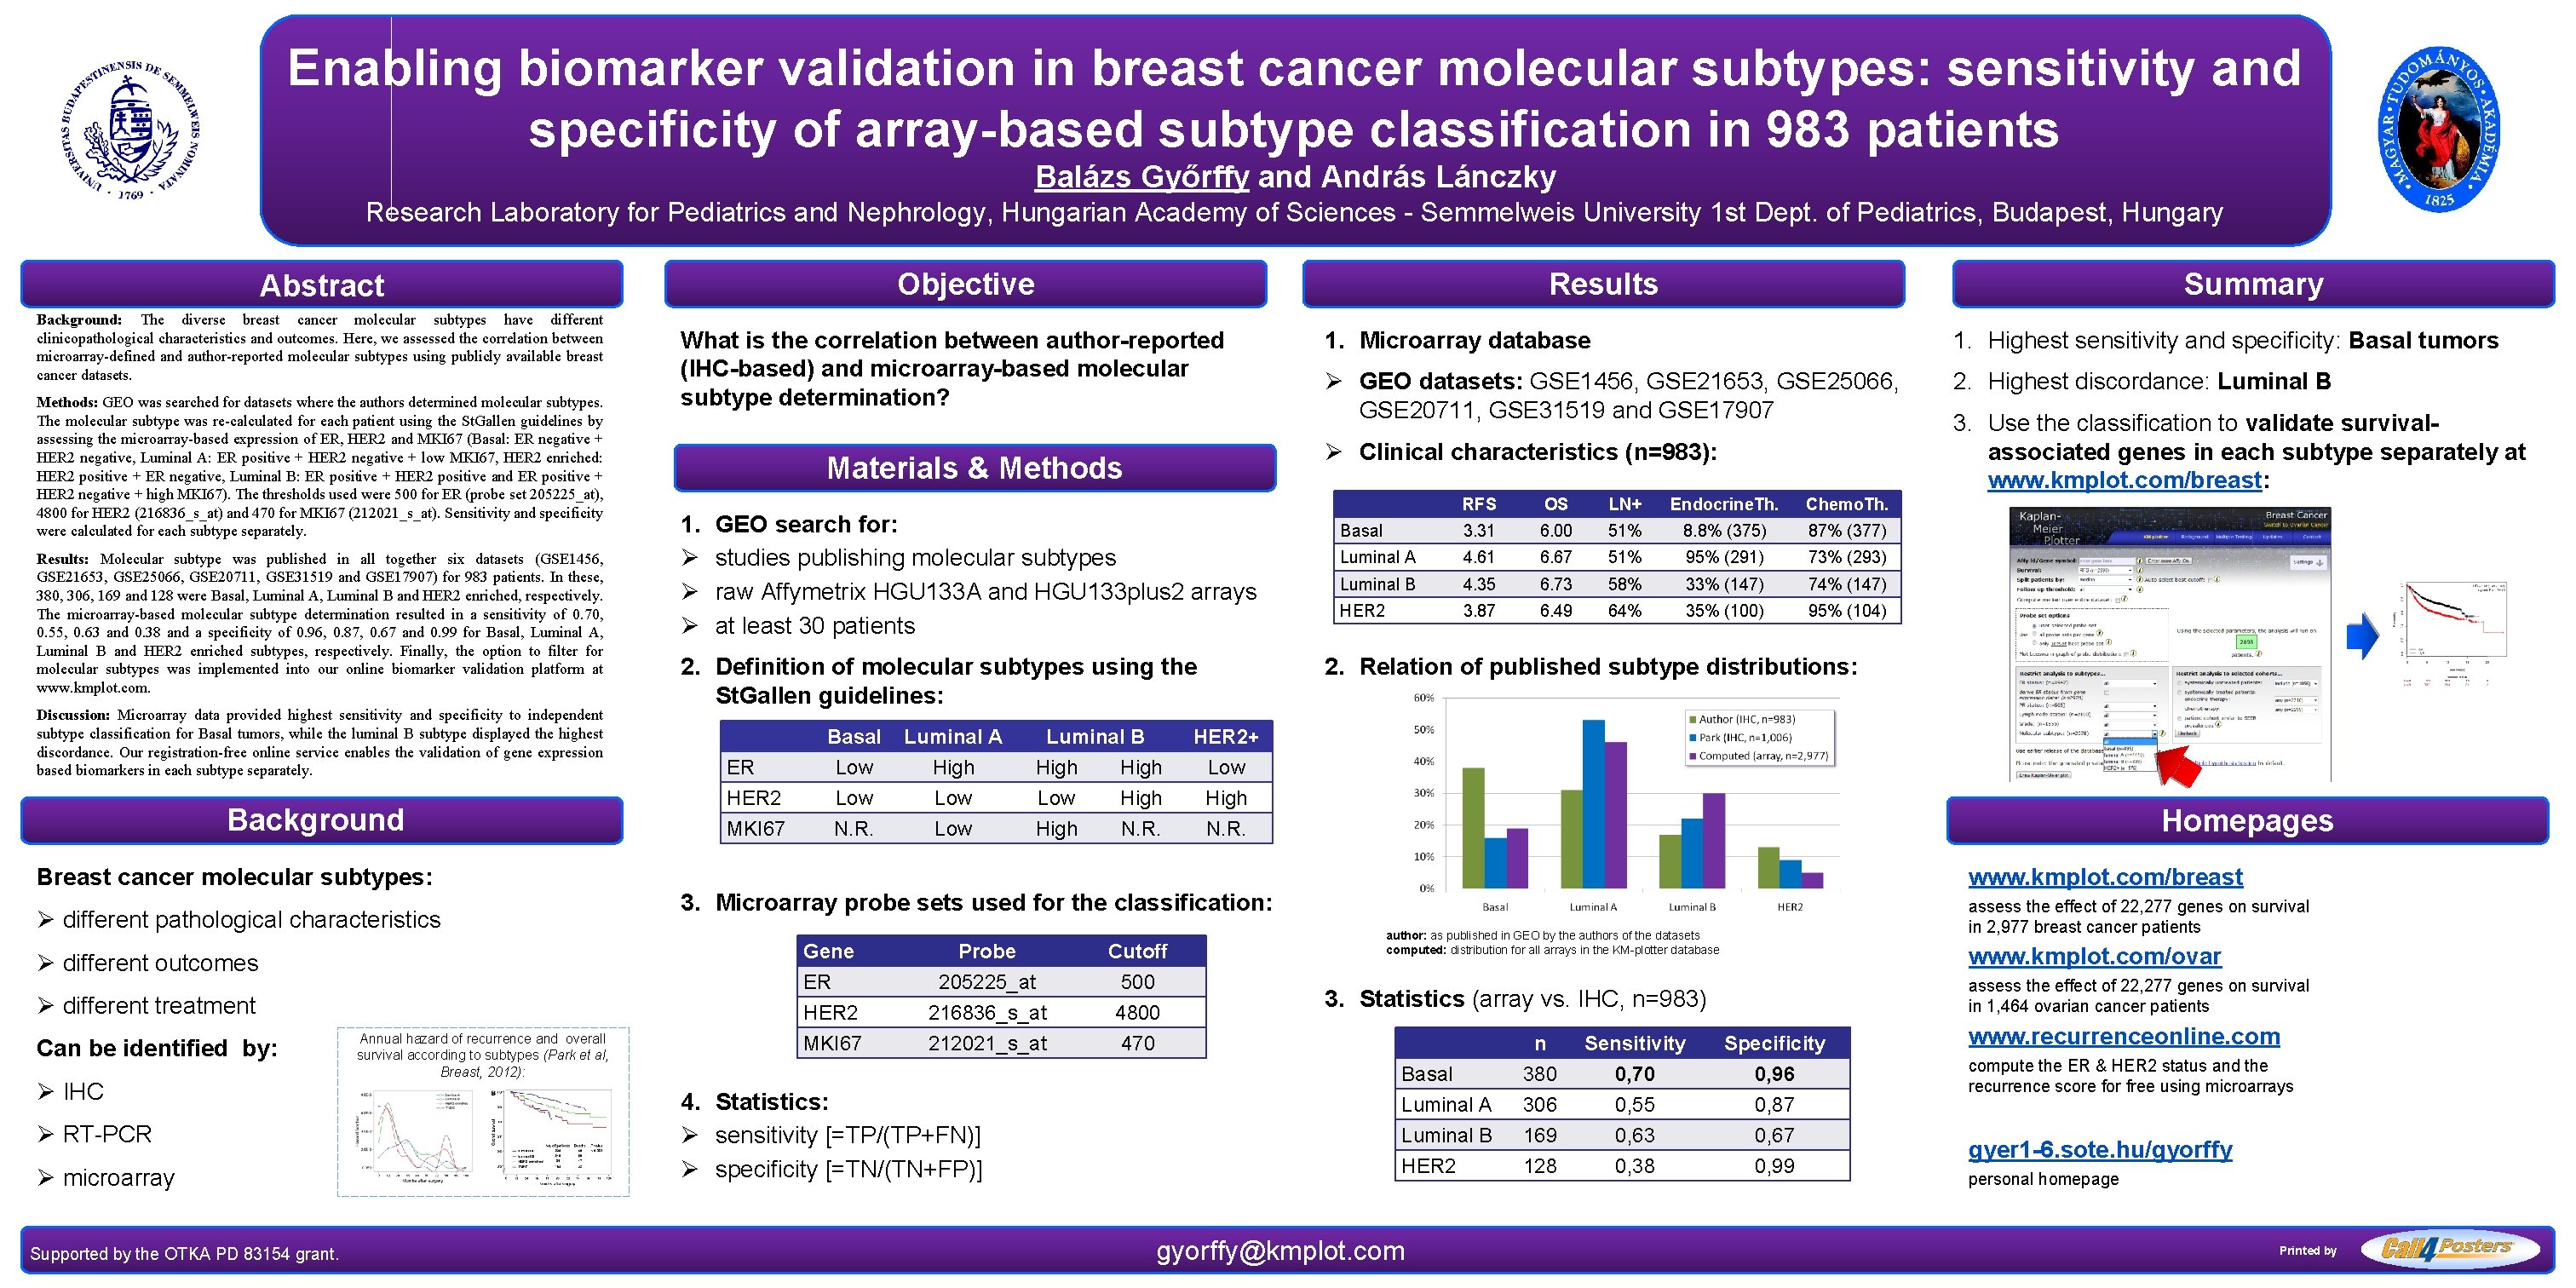
Enabling biomarker validation in breast cancer molecular subtypes: sensitivity and specificity of array-based subtype classification in 983 patients Balázs Győrffy and András Lánczky Research Laboratory for Pediatrics and Nephrology, Hungarian Academy of Sciences - Semmelweis University 1 st Dept. of Pediatrics, Budapest, Hungary Objective Abstract Background: The diverse breast cancer molecular subtypes have different clinicopathological characteristics and outcomes. Here, we assessed the correlation between microarray-defined and author-reported molecular subtypes using publicly available breast cancer datasets. Methods: GEO was searched for datasets where the authors determined molecular subtypes. The molecular subtype was re-calculated for each patient using the St. Gallen guidelines by assessing the microarray-based expression of ER, HER 2 and MKI 67 (Basal: ER negative + HER 2 negative, Luminal A: ER positive + HER 2 negative + low MKI 67, HER 2 enriched: HER 2 positive + ER negative, Luminal B: ER positive + HER 2 positive and ER positive + HER 2 negative + high MKI 67). The thresholds used were 500 for ER (probe set 205225_at), 4800 for HER 2 (216836_s_at) and 470 for MKI 67 (212021_s_at). Sensitivity and specificity were calculated for each subtype separately. Results: Molecular subtype was published in all together six datasets (GSE 1456, GSE 21653, GSE 25066, GSE 20711, GSE 31519 and GSE 17907) for 983 patients. In these, 380, 306, 169 and 128 were Basal, Luminal A, Luminal B and HER 2 enriched, respectively. The microarray-based molecular subtype determination resulted in a sensitivity of 0. 70, 0. 55, 0. 63 and 0. 38 and a specificity of 0. 96, 0. 87, 0. 67 and 0. 99 for Basal, Luminal A, Luminal B and HER 2 enriched subtypes, respectively. Finally, the option to filter for molecular subtypes was implemented into our online biomarker validation platform at www. kmplot. com. Discussion: Microarray data provided highest sensitivity and specificity to independent subtype classification for Basal tumors, while the luminal B subtype displayed the highest discordance. Our registration-free online service enables the validation of gene expression based biomarkers in each subtype separately. Background Breast cancer molecular subtypes: Ø different pathological characteristics Ø different outcomes Ø different treatment Can be identified by: Ø IHC Ø RT-PCR Ø microarray Supported by the OTKA PD 83154 grant. Annual hazard of recurrence and overall survival according to subtypes (Park et al, Breast, 2012): Results What is the correlation between author-reported (IHC-based) and microarray-based molecular subtype determination? GEO search for: studies publishing molecular subtypes raw Affymetrix HGU 133 A and HGU 133 plus 2 arrays at least 30 patients 2. Definition of molecular subtypes using the St. Gallen guidelines: ER HER 2 MKI 67 Basal Low N. R. Luminal A High Low 1. Microarray database 1. Highest sensitivity and specificity: Basal tumors Ø GEO datasets: GSE 1456, GSE 21653, GSE 25066, GSE 20711, GSE 31519 and GSE 17907 2. Highest discordance: Luminal B Ø Clinical characteristics (n=983): Materials & Methods 1. Ø Ø Ø Summary Luminal B High Low High N. R. RFS OS LN+ Endocrine. Th. Chemo. Th. Basal 3. 31 6. 00 51% 8. 8% (375) 87% (377) Luminal A 4. 61 6. 67 51% 95% (291) 73% (293) Luminal B 4. 35 6. 73 58% 33% (147) 74% (147) HER 2 3. 87 6. 49 64% 35% (100) 95% (104) 2. Relation of published subtype distributions: HER 2+ Low High N. R. Homepages www. kmplot. com/breast 3. Microarray probe sets used for the classification: Gene ER HER 2 MKI 67 Probe 205225_at 216836_s_at 212021_s_at 4. Statistics: Ø sensitivity [=TP/(TP+FN)] Ø specificity [=TN/(TN+FP)] Cutoff 500 4800 470 3. Use the classification to validate survivalassociated genes in each subtype separately at www. kmplot. com/breast: assess the effect of 22, 277 genes on survival in 2, 977 breast cancer patients author: as published in GEO by the authors of the datasets computed: distribution for all arrays in the KM-plotter database www. kmplot. com/ovar assess the effect of 22, 277 genes on survival in 1, 464 ovarian cancer patients 3. Statistics (array vs. IHC, n=983) Basal Luminal A Luminal B HER 2 gyorffy@kmplot. com n 380 306 169 128 Sensitivity 0, 70 0, 55 0, 63 0, 38 Specificity 0, 96 0, 87 0, 67 0, 99 www. recurrenceonline. compute the ER & HER 2 status and the recurrence score for free using microarrays gyer 1 -6. sote. hu/gyorffy personal homepage Printed by
- Slides: 1