
en Testbed and Finnish national observation network Jani
en Testbed and Finnish national observation network Jani Poutiainen sh Meteorological Institute (FMI) Observation Services 12. 2. 2007
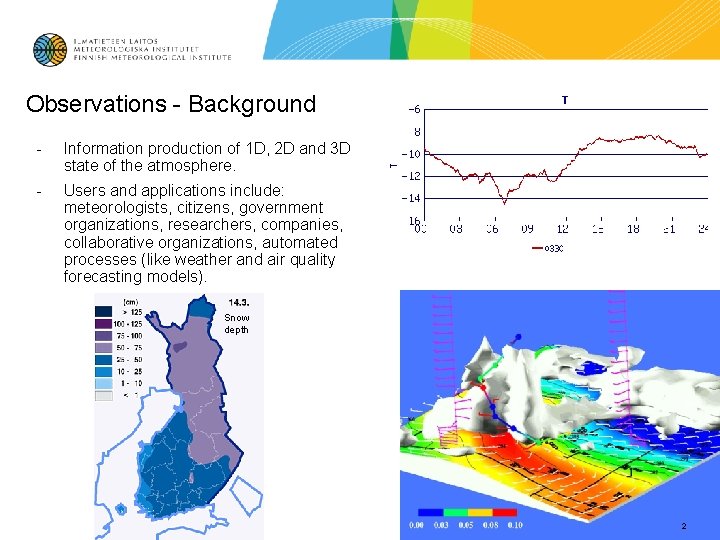
Observations - Background - Information production of 1 D, 2 D and 3 D state of the atmosphere. - Users and applications include: meteorologists, citizens, government organizations, researchers, companies, collaborative organizations, automated processes (like weather and air quality forecasting models). Snow depth 2
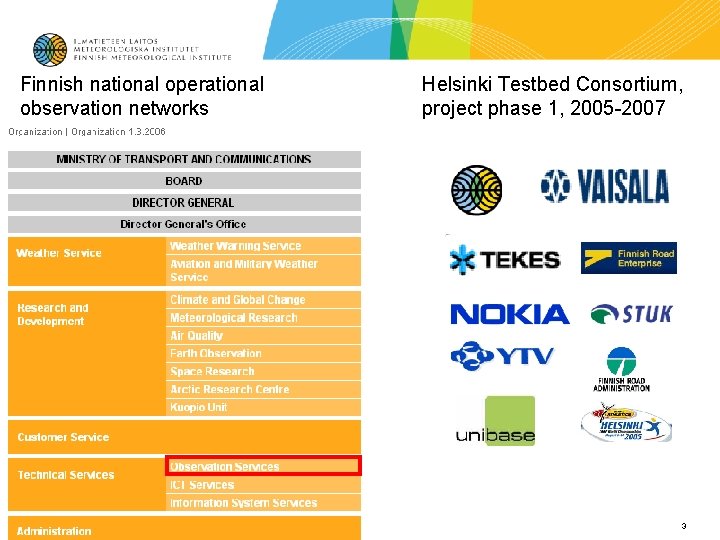
Finnish national operational observation networks Helsinki Testbed Consortium, project phase 1, 2005 -2007 3
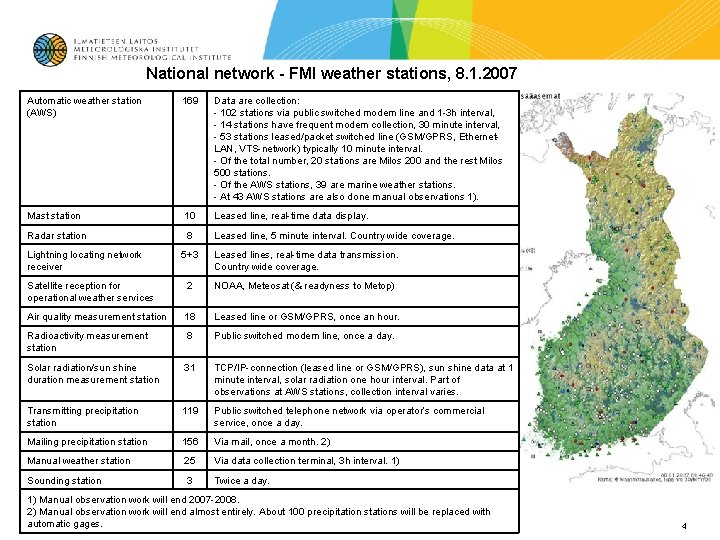
National network - FMI weather stations, 8. 1. 2007 Automatic weather station (AWS) 169 Data are collection: - 102 stations via public switched modem line and 1 -3 h interval, - 14 stations have frequent modem collection, 30 minute interval, - 53 stations leased/packet switched line (GSM/GPRS, Ethernet. LAN, VTS-network) typically 10 minute interval. - Of the total number, 20 stations are Milos 200 and the rest Milos 500 stations. - Of the AWS stations, 39 are marine weather stations. - At 43 AWS stations are also done manual observations 1). Mast station 10 Leased line, real-time data display. Radar station 8 Leased line, 5 minute interval. Country wide coverage. Lightning locating network receiver 5+3 Leased lines, real-time data transmission. Country wide coverage. Satellite reception for operational weather services 2 NOAA, Meteosat (& readyness to Metop) Air quality measurement station 18 Leased line or GSM/GPRS, once an hour. Radioactivity measurement station 8 Public switched modem line, once a day. Solar radiation/sun shine duration measurement station 31 TCP/IP-connection (leased line or GSM/GPRS), sun shine data at 1 minute interval, solar radiation one hour interval. Part of observations at AWS stations, collection interval varies. Transmitting precipitation station 119 Public switched telephone network via operator’s commercial service, once a day. Mailing precipitation station 156 Via mail, once a month. 2) Manual weather station 25 Via data collection terminal, 3 h interval. 1) Sounding station 3 Twice a day. 1) Manual observation work will end 2007 -2008. 2) Manual observation work will end almost entirely. About 100 precipitation stations will be replaced with automatic gages. 4
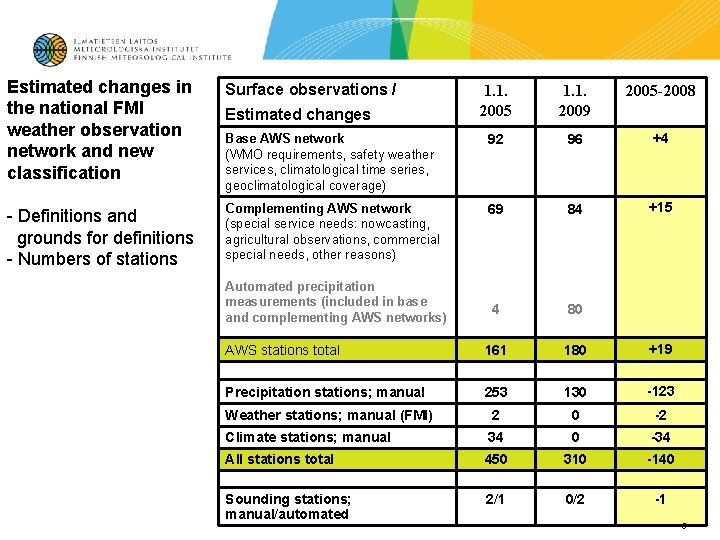
Estimated changes in the national FMI weather observation network and new classification Surface observations / - Definitions and grounds for definitions - Numbers of stations 1. 1. 2005 1. 1. 2009 2005 -2008 Base AWS network (WMO requirements, safety weather services, climatological time series, geoclimatological coverage) 92 96 +4 Complementing AWS network (special service needs: nowcasting, agricultural observations, commercial special needs, other reasons) 69 84 +15 4 80 AWS stations total 161 180 +19 Precipitation stations; manual 253 130 -123 Weather stations; manual (FMI) 2 0 -2 Climate stations; manual 34 0 -34 All stations total 450 310 -140 Sounding stations; manual/automated 2/1 0/2 -1 Estimated changes Automated precipitation measurements (included in base and complementing AWS networks) 5
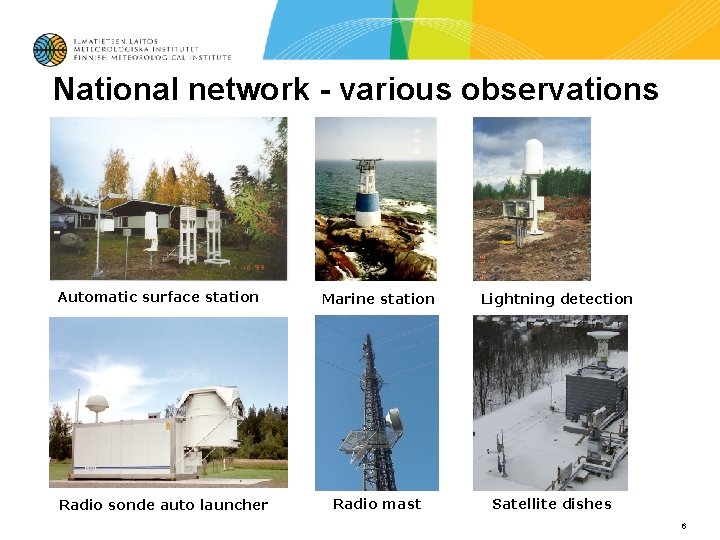
National network - various observations Automatic surface station Radio sonde auto launcher Marine station Radio mast Lightning detection Satellite dishes 6
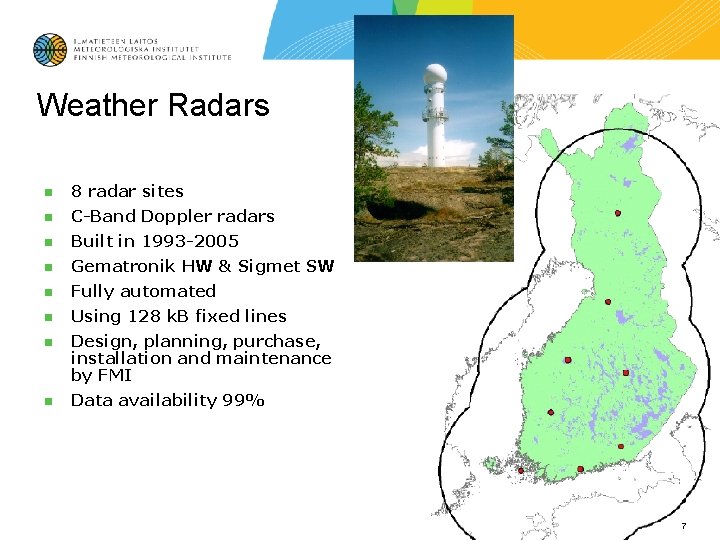
Weather Radars n 8 radar sites n C-Band Doppler radars n Built in 1993 -2005 n Gematronik HW & Sigmet SW n Fully automated n Using 128 k. B fixed lines n Design, planning, purchase, installation and maintenance by FMI n Data availability 99% 7
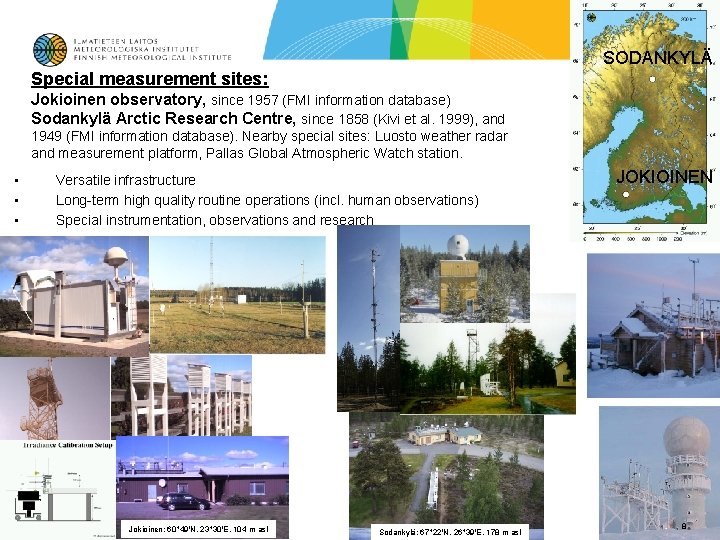
SODANKYLÄ Special measurement sites: Jokioinen observatory, since 1957 (FMI information database) Sodankylä Arctic Research Centre, since 1858 (Kivi et al. 1999), and 1949 (FMI information database). Nearby special sites: Luosto weather radar and measurement platform, Pallas Global Atmospheric Watch station. • • • Versatile infrastructure Long-term high quality routine operations (incl. human observations) Special instrumentation, observations and research Jokioinen: 60 49'N, 23 30'E, 104 m asl Sodankylä: 67 22'N, 26 39'E, 178 m asl JOKIOINEN 8
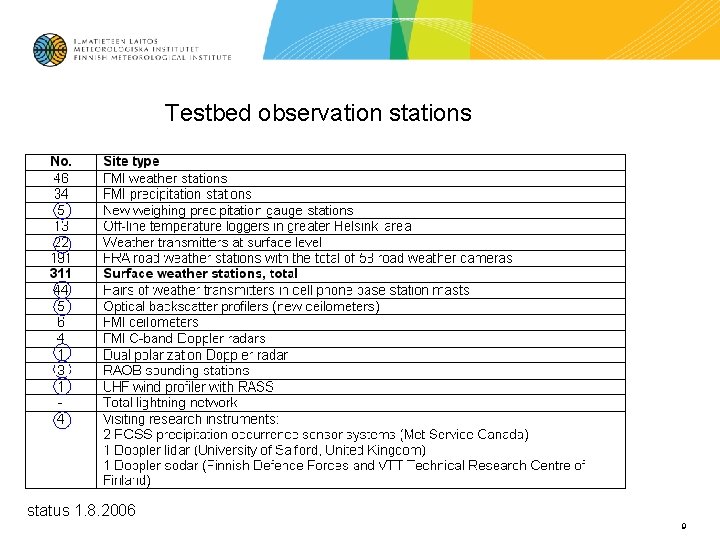
Testbed observation stations status 1. 8. 2006 9
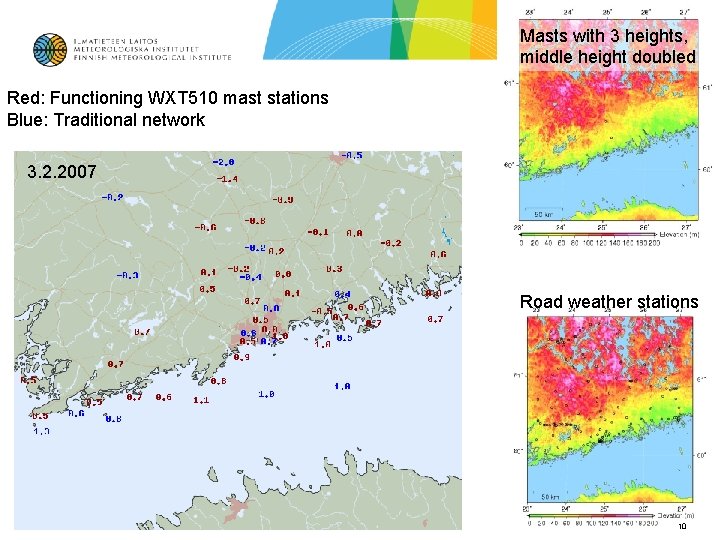
Masts with 3 heights, middle height doubled Red: Functioning WXT 510 mast stations Blue: Traditional network 3. 2. 2007 Road weather stations 10
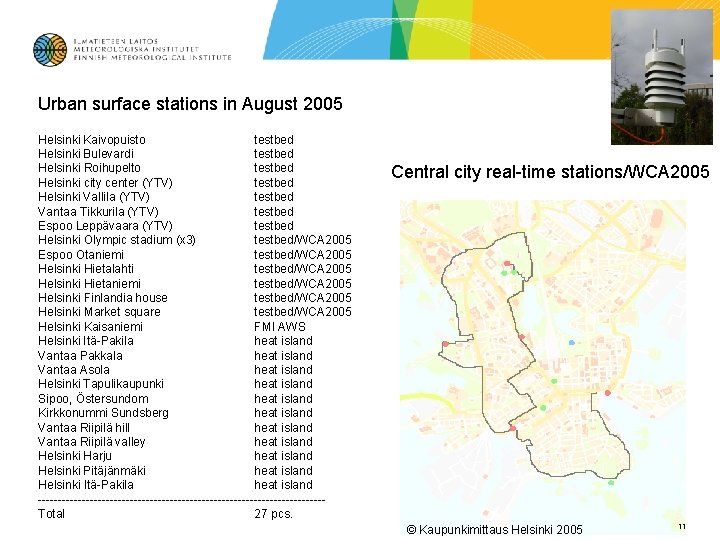
Urban surface stations in August 2005 Helsinki Kaivopuisto testbed Helsinki Bulevardi testbed Helsinki Roihupelto testbed Helsinki city center (YTV) testbed Helsinki Vallila (YTV) testbed Vantaa Tikkurila (YTV) testbed Espoo Leppävaara (YTV) testbed Helsinki Olympic stadium (x 3) testbed/WCA 2005 Espoo Otaniemi testbed/WCA 2005 Helsinki Hietalahti testbed/WCA 2005 Helsinki Hietaniemi testbed/WCA 2005 Helsinki Finlandia house testbed/WCA 2005 Helsinki Market square testbed/WCA 2005 Helsinki Kaisaniemi FMI AWS Helsinki Itä-Pakila heat island Vantaa Pakkala heat island Vantaa Asola heat island Helsinki Tapulikaupunki heat island Sipoo, Östersundom heat island Kirkkonummi Sundsberg heat island Vantaa Riipilä hill heat island Vantaa Riipilä valley heat island Helsinki Harju heat island Helsinki Pitäjänmäki heat island Helsinki Itä-Pakila heat island ------------------------------------Total 27 pcs. Central city real-time stations/WCA 2005 © Kaupunkimittaus Helsinki 2005 11
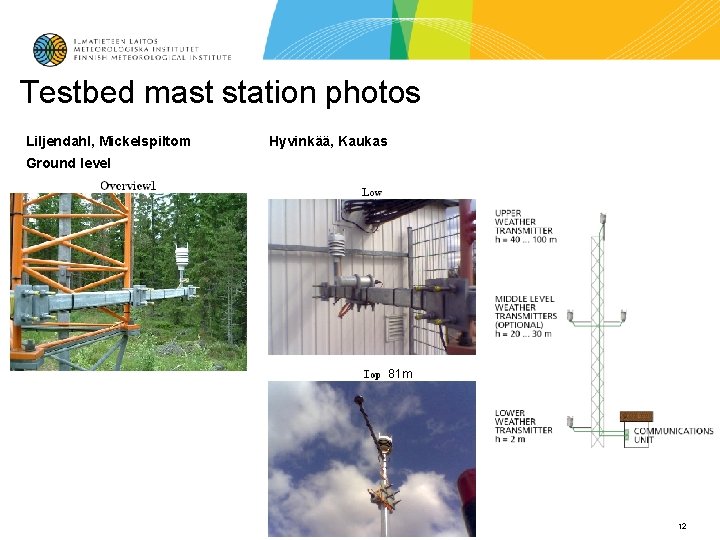
Testbed mast station photos Liljendahl, Mickelspiltom Hyvinkää, Kaukas Ground level 81 m 12
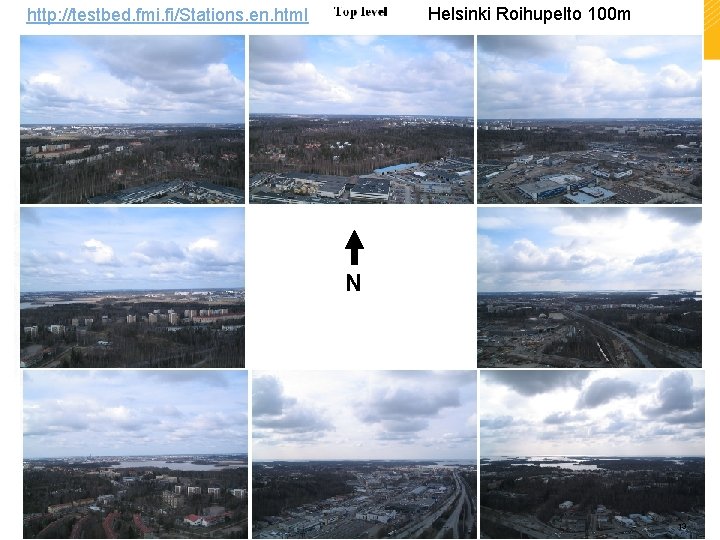
Helsinki Roihupelto 100 m http: //testbed. fmi. fi/Stations. en. html N 13
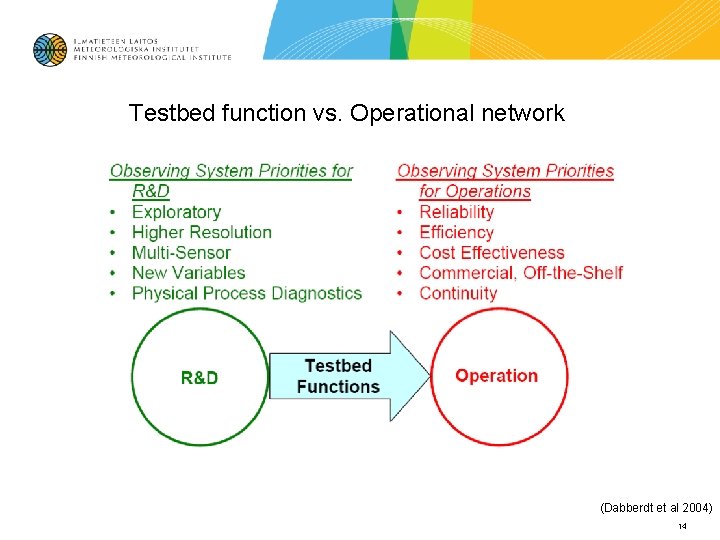
Testbed function vs. Operational network (Dabberdt et al 2004) 14
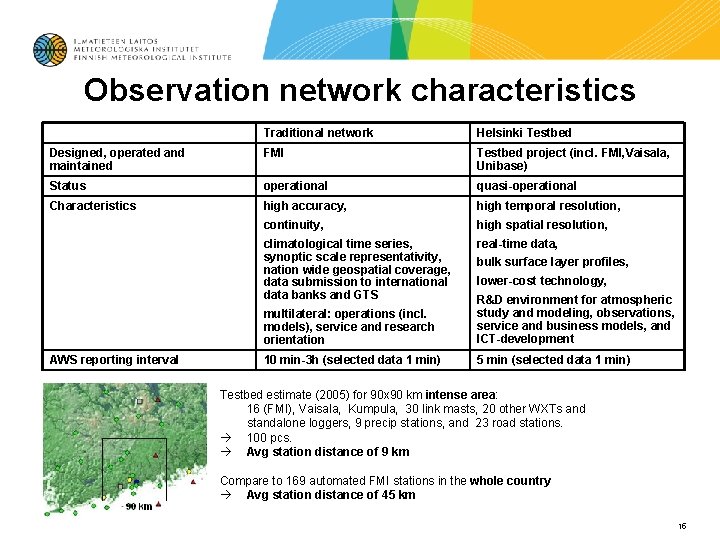
Observation network characteristics Traditional network Helsinki Testbed Designed, operated and maintained FMI Testbed project (incl. FMI, Vaisala, Unibase) Status operational quasi-operational Characteristics high accuracy, high temporal resolution, continuity, high spatial resolution, climatological time series, synoptic scale representativity, nation wide geospatial coverage, data submission to international data banks and GTS real-time data, AWS reporting interval bulk surface layer profiles, lower-cost technology, multilateral: operations (incl. models), service and research orientation R&D environment for atmospheric study and modeling, observations, service and business models, and ICT-development 10 min-3 h (selected data 1 min) 5 min (selected data 1 min) Testbed estimate (2005) for 90 x 90 km intense area: 16 (FMI), Vaisala, Kumpula, 30 link masts, 20 other WXTs and standalone loggers, 9 precip stations, and 23 road stations. 100 pcs. Avg station distance of 9 km Compare to 169 automated FMI stations in the whole country Avg station distance of 45 km 15
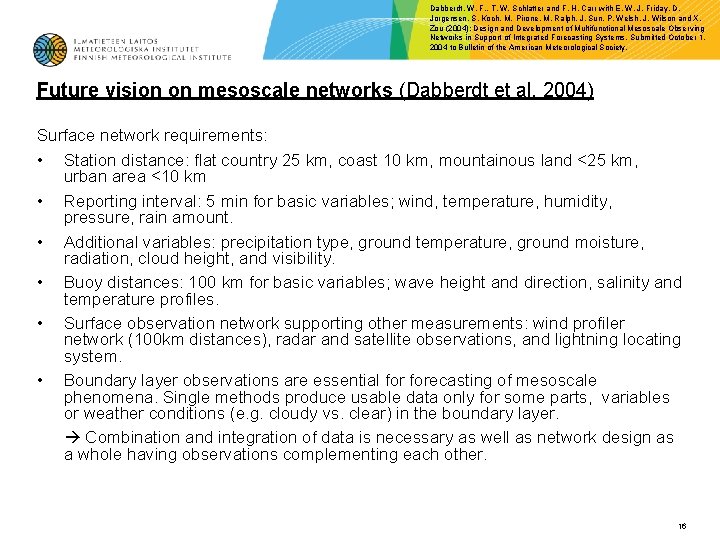
Dabberdt, W. F. , T. W. Schlatter and F. H. Carr with E. W. J. Friday, D. Jorgensen, S. Koch, M. Pirone, M. Ralph, J. Sun, P. Welsh, J. Wilson and X. Zou (2004): Design and Development of Multifunctional Mesoscale Observing Networks in Support of Integrated Forecasting Systems, Submitted October 1, 2004 to Bulletin of the American Meteorological Society. Future vision on mesoscale networks (Dabberdt et al. 2004) Surface network requirements: • Station distance: flat country 25 km, coast 10 km, mountainous land <25 km, urban area <10 km • Reporting interval: 5 min for basic variables; wind, temperature, humidity, pressure, rain amount. • Additional variables: precipitation type, ground temperature, ground moisture, radiation, cloud height, and visibility. • Buoy distances: 100 km for basic variables; wave height and direction, salinity and temperature profiles. • Surface observation network supporting other measurements: wind profiler network (100 km distances), radar and satellite observations, and lightning locating system. • Boundary layer observations are essential forecasting of mesoscale phenomena. Single methods produce usable data only for some parts, variables or weather conditions (e. g. cloudy vs. clear) in the boundary layer. Combination and integration of data is necessary as well as network design as a whole having observations complementing each other. 16
Future visions cont’d / challenges and steering ideas for network evolution: Mesoscale data-assimilation and modeling requirements: • In temporal and space scale it is needed at least 6 -8 measurements with respect to the size of the phenomenon • 3 D distribution (mass, wind, humidity) 10 km (200 m) in horizontal (in vertical) resolution in the lower troposphere, and 10 -100 km (500 m) upper troposphere; temporal resolution 1 -3 hours. • More precise rain intensity measurements including quality control • 3 D distribution of hydrometeors • Diabatic heating profile in cloud • Cloud and other microphysical measurements (e. g. mixing rate, drop size distribution) • Ground temperature and moisture profiles at daily level, canopy type and condition, snow cover observation and snow depth, sea surface temperature • Turbulent flow, fluxes, and stability at 0 -2 km level; temporal resolution 15 minutes • Boundary layer height and structure • More detailed observations in coastal and mountainous areas • Tropopause topology with 10 km horizontal resolution • O 3, CO 2, H 2 O and cloudiness for radiative transfer models • E. g. aerosols, chemical compounds, and surface temperature • Preceding list excludes the types of observations considered to be detailed enough (in US), i. e. radio soundings, weather radars, wind profilers. 17
- Slides: 17