EMT 480 RELIABILITY AND FAILURE ANALYSIS Ramzan Mat

EMT 480 RELIABILITY : AND FAILURE ANALYSIS Ramzan Mat Ayub Institute of Nano Electronic Engineering Email: ramzan@unimap. edu. my Tel: 012 -2749986

Lecturers 1. 2. Class 1. 2. Lab Dr Ramzan; Week 1 - 7 Dr Hasnizah Aris (Course Coordinator): The rest Monday: 8. 30 – 10. 30 am (DK 7) Thursday: 11 – 12 am (DK 9) 1. Monday: 2. 30 - 4. 30 pm. 2. Wednesday: 8. 30 - 10. 30 am, 10. 30 -12. 30 pm, 3 -5 pm 3. Thursday: 2. 30 - 4. 30 pm. 2 Lab entries per students (Curve tracer & de-capsulation). Evaluation will be done during lab session. No report, only rubric

Course Evaluation Examination: 70% • Final Exam: 50% • Mid Term /End Term Exams : 20% Penilaian Berterusan / Continual Assessment: 30% • 2 Assignments/ 2 Quizzes : 20% • Rubric PO 5 (Lab 1 & 2) : 10 %

The objectives of Reliability Engineering

COURSE OUTCOMES CO 1: • Ability to analyse and evaluate the reliability based problems CO 2: • Ability to explain types of semiconductor failures and select the most relevant techniques and tools to perform the Failure Analysis. CO 3: • Ability to recommend apply appropriate techniques and tools available in Failure Analysis.

Course Synopsis In the first section of Reliability, students will learn the concept of Reliability, its terms & definitions, the different types of Reliability Distributions and also the different types of Reliability Prediction Techniques such as Failure Modes and Effects Analysis (FMEA) & Fault Tree Analysis (FTA). In the second section of Failure Analysis, students will be exposed to the different types of FA techniques commonly conducted on a failed semiconductor device and the test instrumentation associated with each technique.

Teaching Plan Week 1 2 3 Topics OVERVIEW OF RELIABILITY Appraise and understand reliability, probability, failure rate and other terms on reliability for application in electronics system RELIABILITY PREDICTION TECHNIQUES & REPORTING (FMEA and FTA) Ability to choose and select the best problem solving tools for failure analysis Lab 1 (Group 1 -5) DESIGN FOR RELIABILITY Access and support the failure analysis techniques, modes, mechanisms and process flow analysis with good argument. Lab 1 (Group 6 -10)

Week 4 5 6 Topics INTRODUCTION TO FAILURE ANALYSIS Access and support the failure analysis techniques, modes, mechanisms and process flow analysis with good argument. Lab 2 (Group 1 -5) ELECTRICAL CHARACTERIZATION Access and support the failure analysis for electrical failures and characterization with good argument. Lab 2 (Group 6 -10) PACKAGE ANALYSIS Access and support the failure analysis techniques for package failures with good argument. Choose and select good analysis FA techniques using imaging of radiography and acoustic.

Week 7 8 9 Topics FAULT LOCALIZATION Access and support the importance of fault localization, its common techniques coupled with thermal and photon based method. DIE EXPOSURE Ability to access and evaluate difference between decapsulation and de-lidding, its method using backside process preparation. DIE DEPROCESSING Ability to access and evaluate different de-processing techniques and also its advantages and disadvantages.

Week 10 11 -12 13 -14 Topics METALLOGRAPHIC CROSSSECTIONING Ability to access and evaluate concepts of metallographic and cross sectioning techniques. INSPECTION TECHNIQUES Ability to access and evaluate concepts and principles of SEM, SPM and also their advantages and disadvantages. Ability to access and evaluate secondary ion mass spectrometer (SIMS) and x-ray photoelectron spectroscopy (XPS) for FA application. FAILURE ANALYSIS CHALLENGES Ability to predict and choose challenges and trend of FA analysis in the advancement of technology.
. Practical Reliability Engineering, Wiley 2. Ebeling,")
References � � � 1. Patrick O’Connor (2002). Practical Reliability Engineering, Wiley 2. Ebeling, C. E. (1997). Reliability and Maintainability Engineering, Mc. Graw Hill 3. Lawrence C. Wagner, (1999). Failure Analysis of Integrated Circuits: Tools and Techniques. : Kluwer Academic Publishers. 4. Perry L. Martin (1999). Electronic Failure Analysis Handbook. : Mc. Graw Hill 5. E. Ajith Amerasekera and Farid N. Najm (1997). Failure Mechanisms in Semiconductor Devices. 2 nd Ed. : John Wiley & Sons 6. Friedrich Beck (1998). Integrated Circuit Failure Analysis: A Guide to Preparation Techniques. : John Wiley & Sons
")
Lecture 1: Overview of Reliability (for electronic systems)

What is Electronic ? The science of controlling electrical energy electrically, in which the electrons have a fundamental role. Where the electrical energy come from? Electronics deals with electrical circuits that involve active electrical components such as vacuum tubes, transistors, diodes, integrated circuits, associated passive electrical components, and interconnection technologies.

Vacuum Tubes – one of electronic components that built early computer
. Was")
Forefather of today's all-electronic digital computers named ENIAC (Electronic Numerical Integrator and Calculator). Was built at the University of Pennsylvania between 1943 and 1945. ENIAC filled a 20 by 40 foot room, weighed 30 tons, and used more than 18, 000 vacuum tubes.

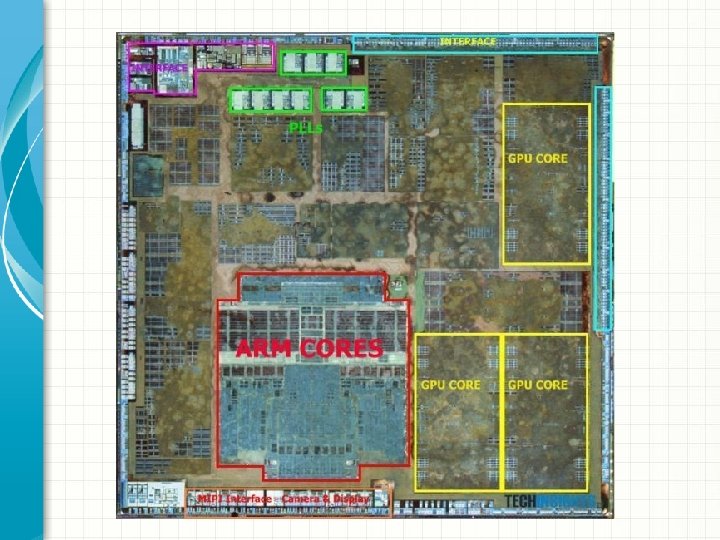
What is Microelectronics ? Microelectronics is a subfield of electronics. As the name suggests, microelectronics relates to the study and manufacture (or microfabrication) of very small electronic designs and components. Usually, but not always, this means micrometre-scale or smaller. These devices are typically made from semiconductor materials. Many components of normal electronic design are available in a microelectronic equivalent. These include transistors, capacitors, inductors, resistors, diodes and insulators and conductors can all be found in microelectronic devices They are designed and fabricated by monolithic approach – Monolithic Integrated Circuits (thus the cheapest and most popular approach).
 –")
Business Model Of Semiconductor Industry Foundry (TSMC, UMC, Silterra, Infineon, 1 st Silicon) – only manufacture Design House (Alterra, My. MS) - only design Integrated Design Manufacturing (Intel, Motorola, IBM, MIMOS) - design and manufacture
 etc)")
Semiconductor Manufacturing Processes • Design (Digital, analog, full custom, semi custom (gate array) etc) – Tape out (design to Mask Shop) • Mask making • Backend Process • Individual process development • Deposition (oxide, nitride etc) • Front-end Processes (individual transistor) • Metalization – Deposition • Rapid Thermal Process – Oxidation • Lithography & Etch – Diffusion • – Photolithography • Test (Parametric and Functional) – Etch (wet and dry) – Implantation • Packaging
, Non Volatile Memory (Flash, EEPROM),")
Type of ICs P, FPGAs, Volatile Memory (DRAM, SRAM), Non Volatile Memory (Flash, EEPROM), ASICs Digital μ Analog op-amps, linear regulators, phase locked loops, oscillators, active filters.


 Insulator 1. Band")
Review on Semiconductor Material Solid Materials Classification (based on electrical conductivity) Insulator 1. Band gap evergy Semiconductor Metal The ability to control material’s conductivity is the key to modern electronic devices. Lattice of Unit Cell Simple cubic Body centered Face centered Diamond and Zincblende Unit Cell Arrangement (based on atomic arrangement) 2. Energy states density 3. Carriers mobility 4. Phonon scattering 5. Traps density (defect) Amorphous Poly crystalline Single crystal Crystal Orientation Miller Indices 111 100

Intrinsic Semiconductor Energy Bands Semiconductor Extrinsic Semiconductor Electrons / holes concentration ni = pi and nipi = ni 2 (MASS ACTION LAW) – the product of n p is always a constant for a given semiconductor material at given temperature Doping n-type Semiconductor Typical doping 1016 – 1019 / cm 3 p-type Semiconductor 1 per 50, 000 atoms Si

Elementary semiconductor Compound Semiconductor Silicon Germanium II-IV III-VI Si. Ge Ga. As, In. P etc Cd. S, Zn. Te etc Electron mobility Optical properties Offer high performance devices (optical characteristics, higher frequency and power) Binary Ternary Quaternary Si. Ge, Ga. As Alx. Ga 1 -x. As Inx. Ga 1 -x. Asy. P 1 -y
 Diodes and P/N junction (as rectifier)")
Review on Semiconductor Device (Lecture 2) Diodes and P/N junction (as rectifier)

Depletion region – charge is stored in this region Forward bias Reverse bias Junction breakdown BJT Unipolar, Bipolar Devices MESFET or MOSFET Capacitors, Resistors ICs

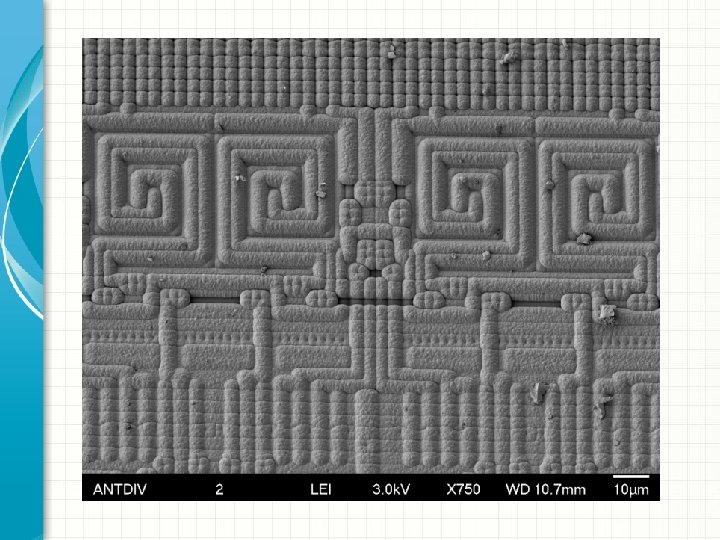
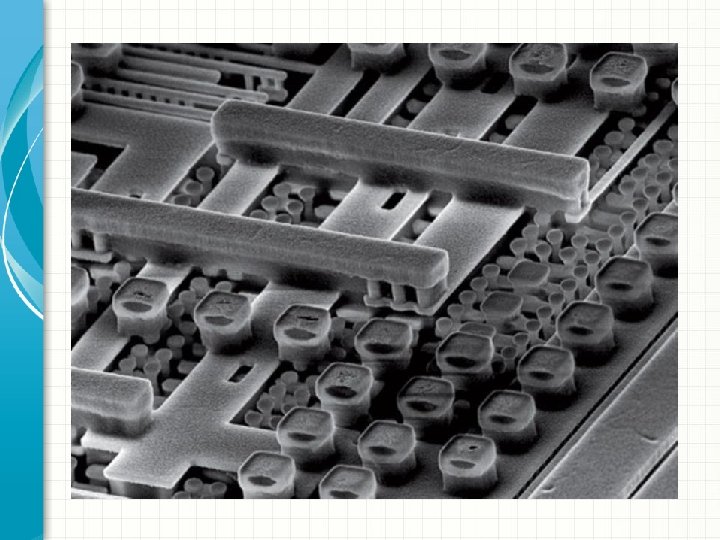
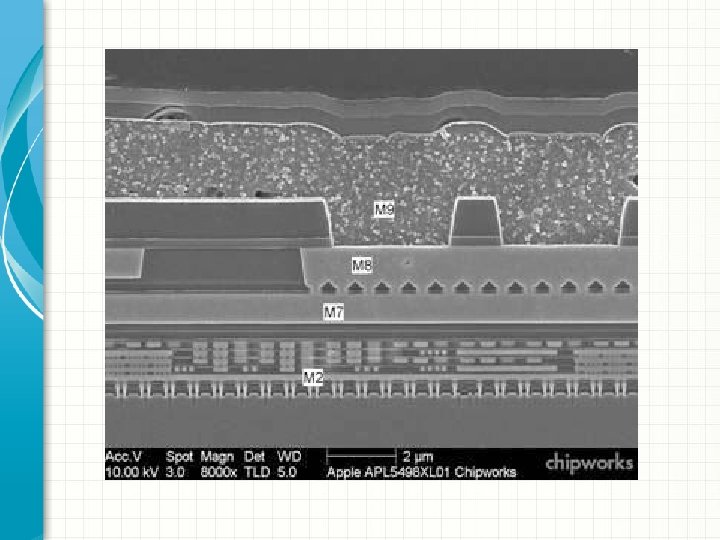
Review on Semiconductor Process Technology

Design rules Logic design Analog design Device model Layout IC μP, Flash Technology Library of certain foundaries Bipolar Tech CMOS Tech Bi. CMOS Tech Mask Inverter Other logic block Memory (volatile, nonvolatile) P/N junction Capacitor CMOS NMOS Device Physics Diode BJT Resistor PMOS Memory Cell CMOS Process Technology (integration) Well Technology Gate Technology Multi level Inter Process Tech Isolation Technology Contact Technology Connect Tech Cleaning Oxidation Ion implantation PVD CVD Solid material classification Periodic arrangement Lattice Crystallic orientation Unit cell Energy band & diagram Photolithography Deposition Intrinsic and extrinsic semiconductor Material doping Material
 Mean")
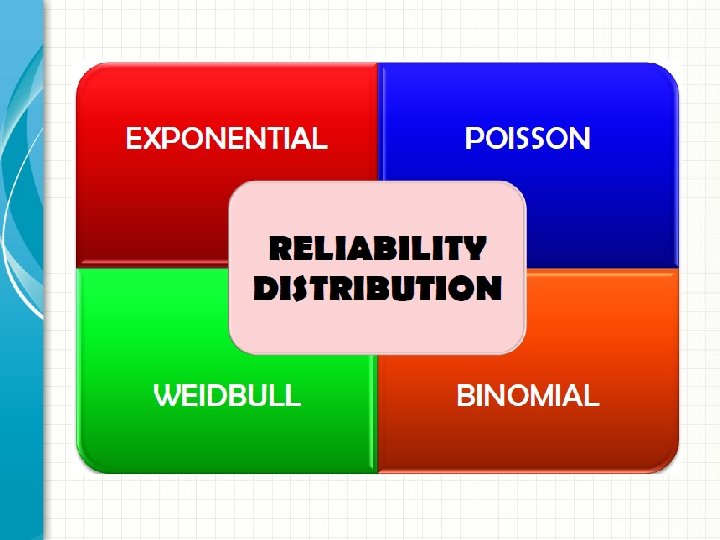
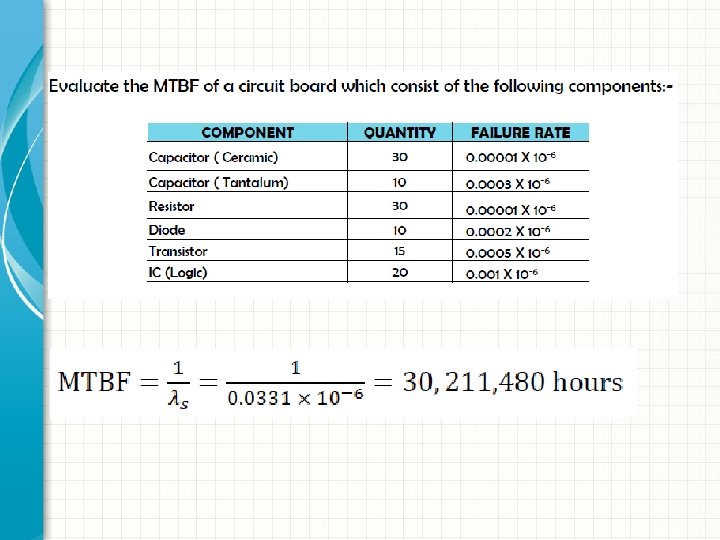
TERMS AND DEFINITION • • Reliability Failure Rate Mean Time Between Failure (MTBF) Mean Time to Repair (MTTR) PROBABILITY DISTRIBUTION FUNCTION • • Exponential Distribution Binomial Distribution Poisson Distribution Weibull Distribution SYSTEM MODEL • • Serial Reliability Model Parallel Reliability Model k of n Reliability Model Combination Reliability Model

1. 1 TERMS & DEFINITION : • “Reliability is defined as probability of a device performing its purpose adequately for a period of time intended under the specified condition” • “Reliability refers to the probability that a component or a system will perform a required function for a given period of time when used under stated operating condition”

Operating temperature

SUBJECT + OUTPUT+ TIME + CONDITION

“i. Phone found to be 300% more reliable than Samsung smartphones”

How does the score been calculated ? IMPRESSION RATIO ���������� ������������

1. 2 TERMS & DEFINITION :
 � MTTR is")
1. 2 TERMS & DEFINITION : MEAN TIME TO REPAIR (MTTR) � MTTR is the mean (average) time between failures and being returned to service. AVAILABILITY � Availability of a module is the percentage of time when system is operated.

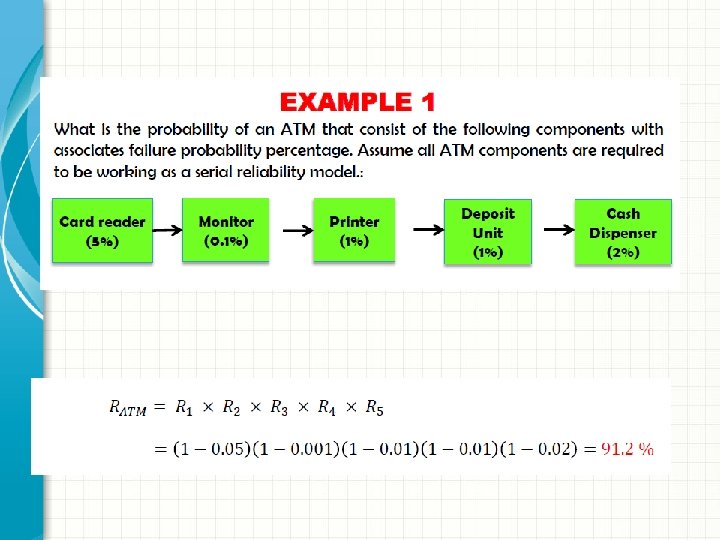
EXAMPLE 1 Evaluate the Failure Rate and MTBF for washing machine that has accumulated 5 failures that resulted in five service calls during 1, 200 hours of operation. SOLUTION FR(λ) = 5 Failures/ 1, 200 hours = 4. 167 x 10 -3 failures/hour = 4167 x 10 -6 failures/hour MTBF = 1/ λ = 1/(0. 00417) = 240 hours Conclusion : The machine is expected to break down after 240 hours of usage, and this information is crucially needed to establish spare part requirement

2. 1 Exponential Distribution •

EXAMPLE 2 Evaluate the reliability of an electrical device that has an exponential reliability distribution with a failure rate of 9 x 10 -6 over time t = 1, 000 hours. SOLUTION Reliability or functional −���� −(�� �� 10− 6�� ���� )=�� �� (�� )= ��. ����� Unreliability or failure −���� �� (�� )= �� −�� (�� )=�� − �� = 1 – 0. 99104 = 0. 000896

2. 2 Binomial Distribution •

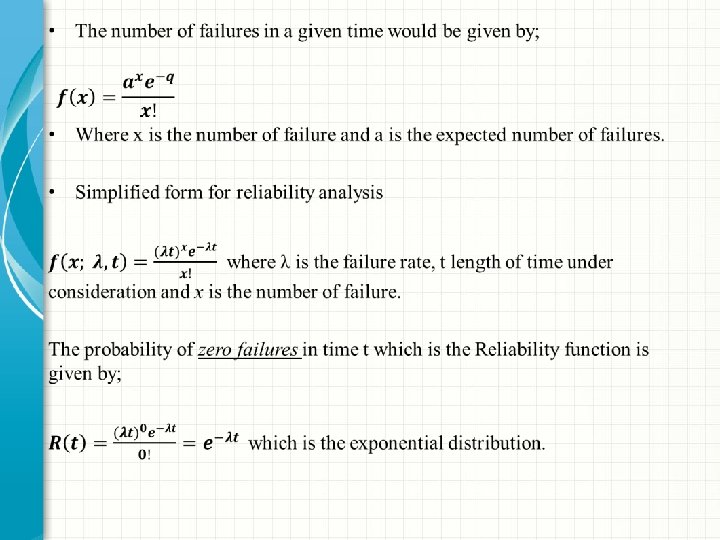
2. 3 Poisson Distribution • Poisson Reliability Distribution is a discrete distribution by taking consideration of time interval / time domain. • The extension of binomial function for the large n (n >20) i. e. large system. • If the failures are Poisson distributed, they occur at a constant average rate and the number of events occurring in any time interval are independent (parallel system) of the number of events occurring in any other time interval.


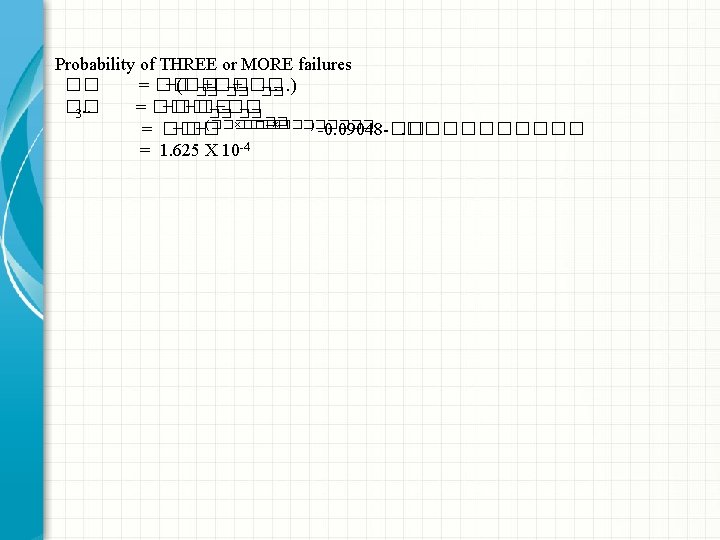
EXAMPLE 3 What is the probability of : i. One failure ii. Two failures iii. Three or more failures occurs during a time period of 1000 hours for an electronic device with failure rate of 100 x 10 -6 SOLUTION Given t = 1000 hours and λ = 100 x 10 -6 � i. Probability of exactly ONE failure −���� �� (�� )=������ �� =(100 x 10− 6)(1000)e−(100 x 10− 6)(1000) = 0. 0905 ii. Probability of exactly TWO failures �� −���� �� (�� )=���� �� /�� ! �� −�� −(������ ×���� )/�� =(������ ×���� )�� �� ! =��. ���� �

2. 4 Weibull Distribution � Complex continuous random reliability distributions, failure rates are not CONSTANT all the time. � Weibull reliability distribution is similar to exponential reliability function with additional shaping parameter. −(���� )�� ���� = �� � where as α : failure rate β : shape parameter (it indicates whether the FR decrease/increase) � If β < 1. 0 , failure rate is decreasing β = 1. 0 , failure rate is constant β > 1. 0 , failure rate is increasing
 K of n configuration Combination")
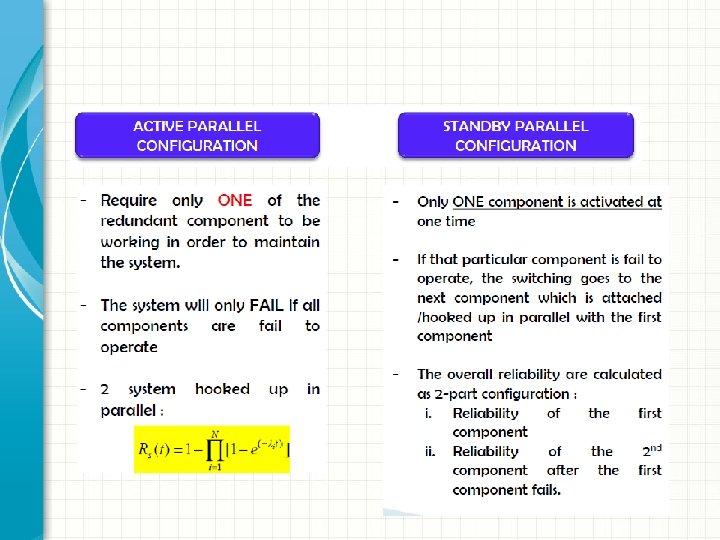
Serial Parallel SYSTEM MODEL (assessing multiple components) K of n configuration Combination

3. 1 SERIAL RELIABILITY MODEL • • Simplest reliability model EACH COMPONENT of the system NEED to be WORKING for overall system success • Reliability : �� = �� 1 × �� 2 × �� 3 × �� 4 × ……. × �� �� (1−�� ) 1)(1−�� 2)(1−�� 3)(1−�� 4)…. (1−�� �� Failure rate : �� = �� ∴MTBF=1/�� �� 1+ �� 2+ �� 3+ �� 4+⋯+�� �� �� •

3. 2 PARALLEL RELIABILITY MODEL

3. 3 κ of n CONFIGURATION RELIABILITY MODEL

3. 4 COMBINED RELIABILITY MODEL

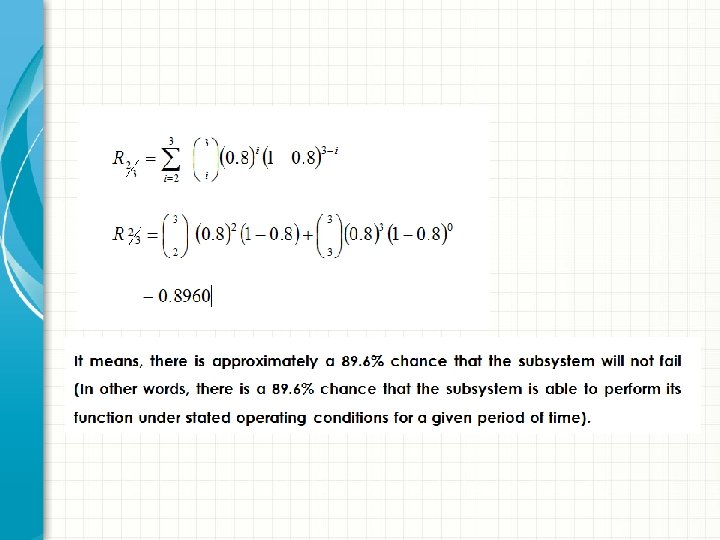
• Assume that a particular subsystem is made up of three independent and identical units in parallel and at least two units must operate normally for the subsystem success. Each unit’s probability of success is 0. 8. • (i) Calculate the subsystem reliability. • (ii) Give your interpretation of the result obtained.
- Slides: 62