
Emissions Inventories An Overview Office of Air Air
- Slides: 73
Emissions Inventories: An Overview Office of Air, Air Quality Division Presented to the Texas Commission on Environmental Quality (TCEQ) Environmental Trade Fair and Conference May 14, 2019 Air Quality Division
Overview • What is an emissions inventory (EI)? • EI role in air quality • Types of emissions inventories – – – Point Area On-road Non-road Biogenic • Anthropogenic emissions trends TCEQ Environmental Trade Fair and Conference • Emissions Inventories: An Overview • May 14, 2019 • Page 2
What is an EI? • Accounts for the amount of air pollutants released into the atmosphere • Includes the following data: – – – Who: Sources creating air pollution What: Chemical or physical identity of the pollutants Where: Geographic area covered When: Time period emissions are released Why: Types of activities that cause emissions How: Specific release information § Location § Height § Velocity § Temperature TCEQ Environmental Trade Fair and Conference • Emissions Inventories: An Overview • May 14, 2019 • Page 3
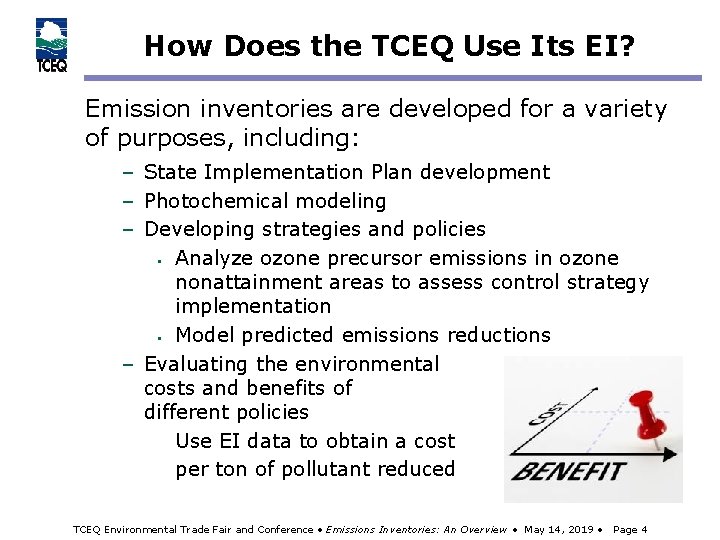
How Does the TCEQ Use Its EI? Emission inventories are developed for a variety of purposes, including: – State Implementation Plan development – Photochemical modeling – Developing strategies and policies § Analyze ozone precursor emissions in ozone nonattainment areas to assess control strategy implementation § Model predicted emissions reductions – Evaluating the environmental costs and benefits of different policies Use EI data to obtain a cost per ton of pollutant reduced TCEQ Environmental Trade Fair and Conference • Emissions Inventories: An Overview • May 14, 2019 • Page 4
How Does the TCEQ Use Its EI? (cont. ) Emission inventories are developed for a variety of purposes. – Tracking progress of air quality standards Compare emissions trends to ambient air monitoring data – Meet required federal reporting – Fee assessment – Providing emissions information to public and private entities – Other air quality planning efforts TCEQ Environmental Trade Fair and Conference • Emissions Inventories: An Overview • May 14, 2019 • Page 5
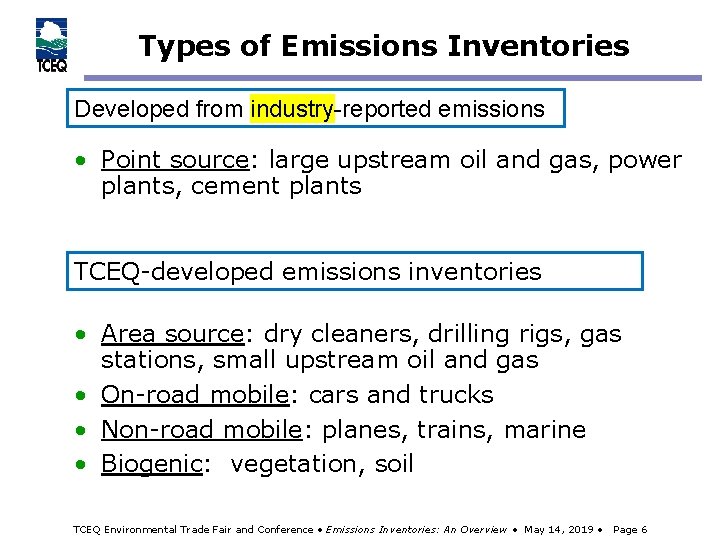
Types of Emissions Inventories Developed from industry-reported emissions • Point source: large upstream oil and gas, power plants, cement plants TCEQ-developed emissions inventories • Area source: dry cleaners, drilling rigs, gas stations, small upstream oil and gas • On-road mobile: cars and trucks • Non-road mobile: planes, trains, marine • Biogenic: vegetation, soil TCEQ Environmental Trade Fair and Conference • Emissions Inventories: An Overview • May 14, 2019 • Page 6
30 Texas Administrative Code (TAC) Section 101. 10 EI rule organization (a) Applicability (b) Types of inventories (c) Calculations (d) Certifying statements (e) Reporting requirements (f) Enforcement TCEQ Environmental Trade Fair and Conference • Emissions Inventories: An Overview • May 14, 2019 • Page 7
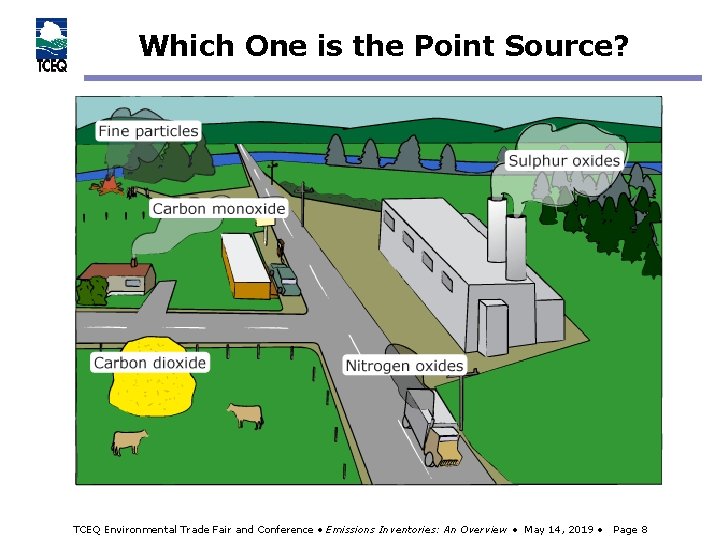
Which One is the Point Source? TCEQ Environmental Trade Fair and Conference • Emissions Inventories: An Overview • May 14, 2019 • Page 8
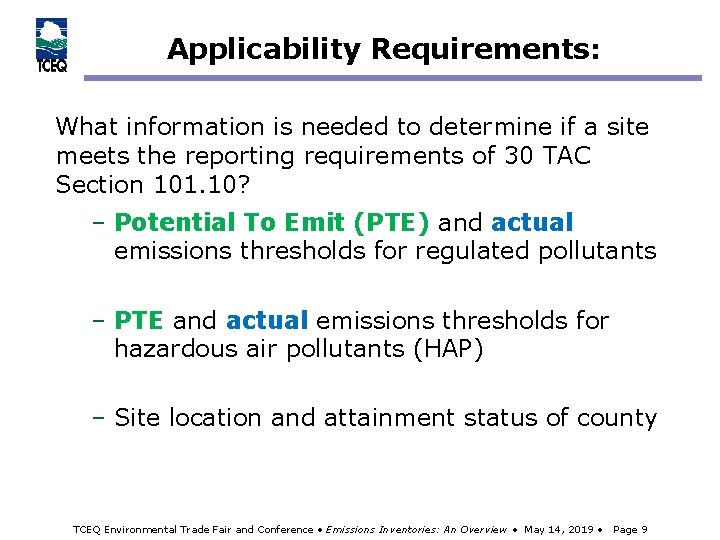
Applicability Requirements: What information is needed to determine if a site meets the reporting requirements of 30 TAC Section 101. 10? – Potential To Emit (PTE) and actual emissions thresholds for regulated pollutants – PTE and actual emissions thresholds for hazardous air pollutants (HAP) – Site location and attainment status of county TCEQ Environmental Trade Fair and Conference • Emissions Inventories: An Overview • May 14, 2019 • Page 9
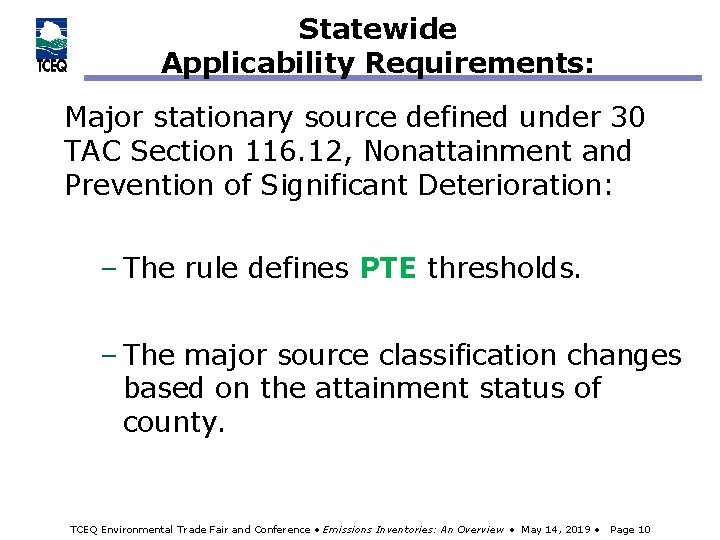
Statewide Applicability Requirements: Major stationary source defined under 30 TAC Section 116. 12, Nonattainment and Prevention of Significant Deterioration: – The rule defines PTE thresholds. – The major source classification changes based on the attainment status of county. TCEQ Environmental Trade Fair and Conference • Emissions Inventories: An Overview • May 14, 2019 • Page 10
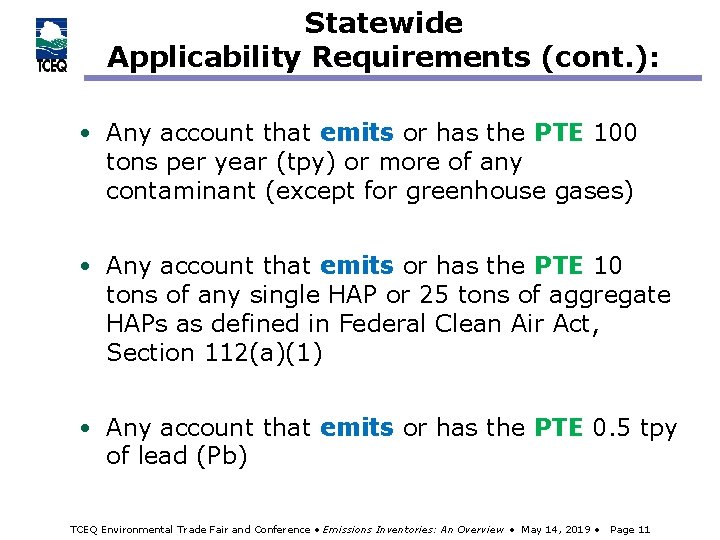
Statewide Applicability Requirements (cont. ): • Any account that emits or has the PTE 100 tons per year (tpy) or more of any contaminant (except for greenhouse gases) • Any account that emits or has the PTE 10 tons of any single HAP or 25 tons of aggregate HAPs as defined in Federal Clean Air Act, Section 112(a)(1) • Any account that emits or has the PTE 0. 5 tpy of lead (Pb) TCEQ Environmental Trade Fair and Conference • Emissions Inventories: An Overview • May 14, 2019 • Page 11
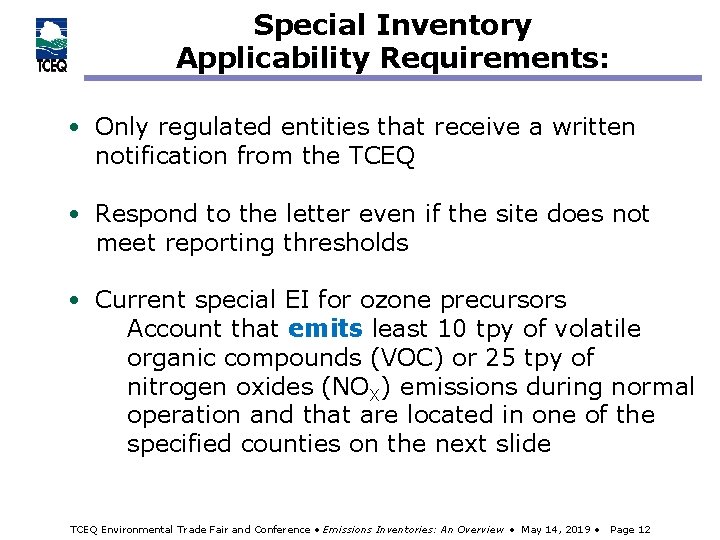
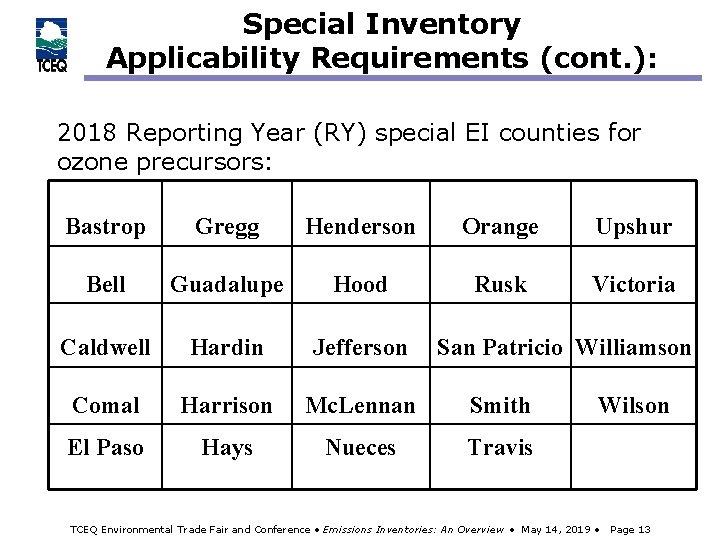
Special Inventory Applicability Requirements: • Only regulated entities that receive a written notification from the TCEQ • Respond to the letter even if the site does not meet reporting thresholds • Current special EI for ozone precursors Account that emits least 10 tpy of volatile organic compounds (VOC) or 25 tpy of nitrogen oxides (NOX) emissions during normal operation and that are located in one of the specified counties on the next slide TCEQ Environmental Trade Fair and Conference • Emissions Inventories: An Overview • May 14, 2019 • Page 12
Special Inventory Applicability Requirements (cont. ): 2018 Reporting Year (RY) special EI counties for ozone precursors: Bastrop Gregg Henderson Orange Upshur Bell Guadalupe Hood Rusk Victoria Caldwell Hardin Jefferson Comal Harrison Mc. Lennan Smith El Paso Hays Nueces Travis San Patricio Williamson Wilson TCEQ Environmental Trade Fair and Conference • Emissions Inventories: An Overview • May 14, 2019 • Page 13
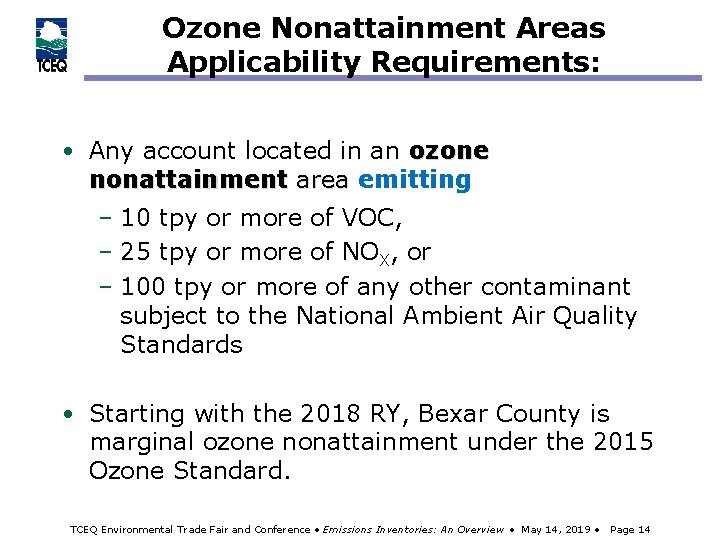
Ozone Nonattainment Areas Applicability Requirements: • Any account located in an ozone nonattainment area emitting area – 10 tpy or more of VOC, – 25 tpy or more of NOX, or – 100 tpy or more of any other contaminant subject to the National Ambient Air Quality Standards • Starting with the 2018 RY, Bexar County is marginal ozone nonattainment under the 2015 Ozone Standard. TCEQ Environmental Trade Fair and Conference • Emissions Inventories: An Overview • May 14, 2019 • Page 14
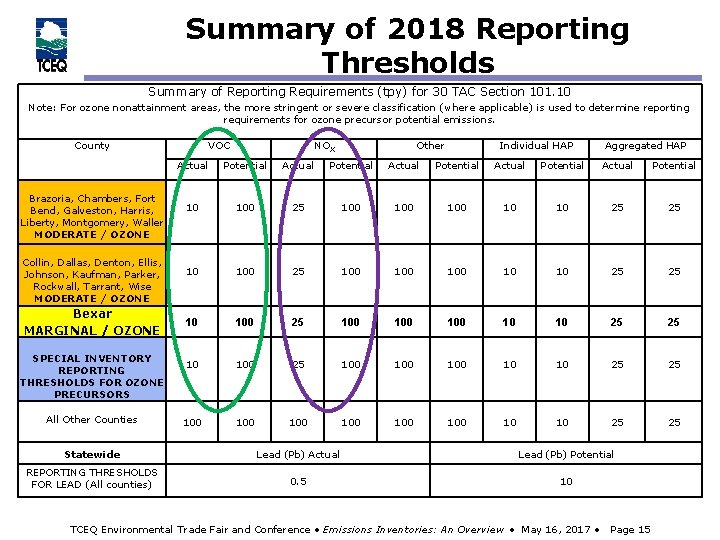
Summary of 2018 Reporting Thresholds Summary of Reporting Requirements (tpy) for 30 TAC Section 101. 10 Note: For ozone nonattainment areas, the more stringent or severe classification (where applicable) is used to determine reporting requirements for ozone precursor potential emissions. County VOC Actual Brazoria, Chambers, Fort Bend, Galveston, Harris, Liberty, Montgomery, Waller MODERATE / OZONE Collin, Dallas, Denton, Ellis, Johnson, Kaufman, Parker, Rockwall, Tarrant, Wise MODERATE / OZONE Bexar MARGINAL / OZONE SPECIAL INVENTORY REPORTING THRESHOLDS FOR OZONE PRECURSORS All Other Counties 10 Potential 10 10 100 NOX 100 Actual 100 100 25 Potential 25 25 Other 100 Actual 100 100 Potential 100 100 Individual HAP 100 Actual 100 100 10 Potential 10 10 10 Aggregated HAP 10 Actual 10 10 10 25 Potential 25 25 Lead (Pb) Actual Lead (Pb) Potential REPORTING THRESHOLDS FOR LEAD (All counties) 0. 5 10 25 25 Statewide 25 TCEQ Environmental Trade Fair and Conference • Emissions Inventories: An Overview • May 16, 2017 • Page 15 25 25
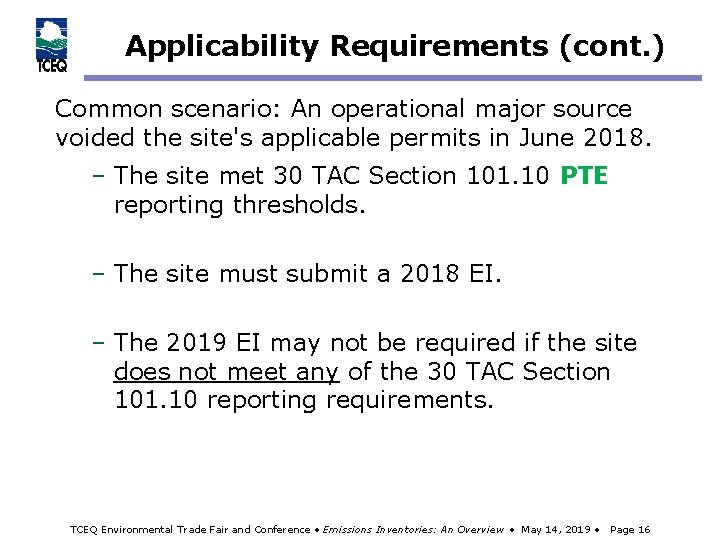
Applicability Requirements (cont. ) Common scenario: An operational major source voided the site's applicable permits in June 2018. – The site met 30 TAC Section 101. 10 PTE reporting thresholds. – The site must submit a 2018 EI. – The 2019 EI may not be required if the site does not meet any of the 30 TAC Section 101. 10 reporting requirements. TCEQ Environmental Trade Fair and Conference • Emissions Inventories: An Overview • May 14, 2019 • Page 16
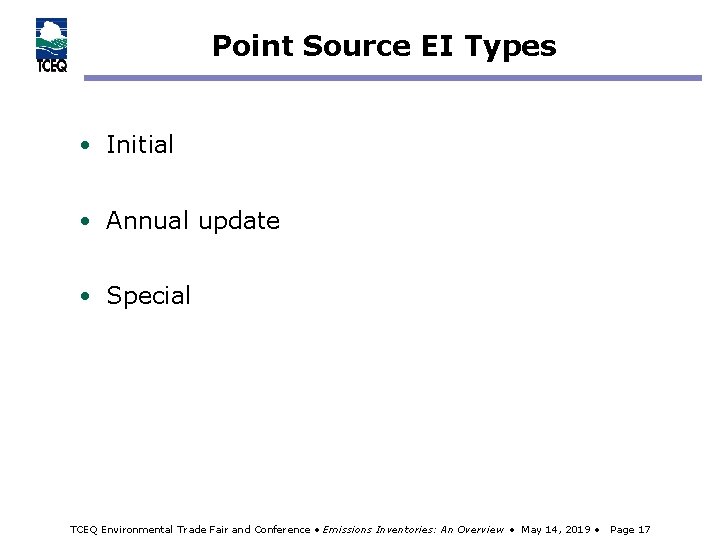
Point Source EI Types • Initial • Annual update • Special TCEQ Environmental Trade Fair and Conference • Emissions Inventories: An Overview • May 14, 2019 • Page 17
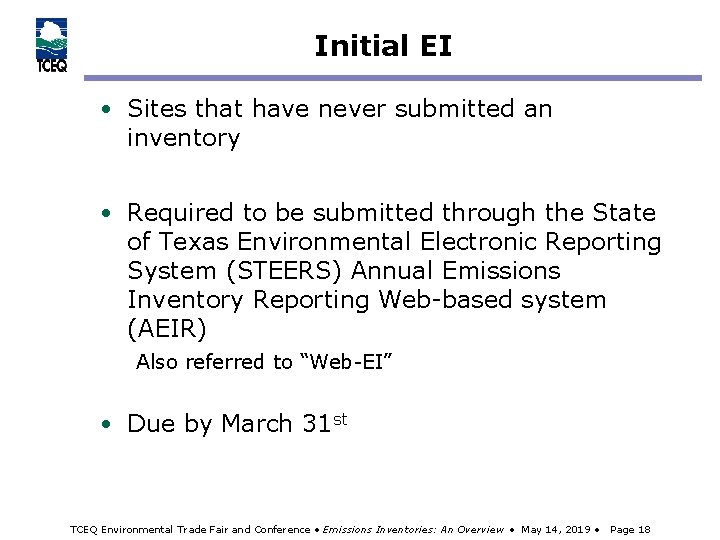
Initial EI • Sites that have never submitted an inventory • Required to be submitted through the State of Texas Environmental Electronic Reporting System (STEERS) Annual Emissions Inventory Reporting Web-based system (AEIR) Also referred to “Web-EI” • Due by March 31 st TCEQ Environmental Trade Fair and Conference • Emissions Inventories: An Overview • May 14, 2019 • Page 18
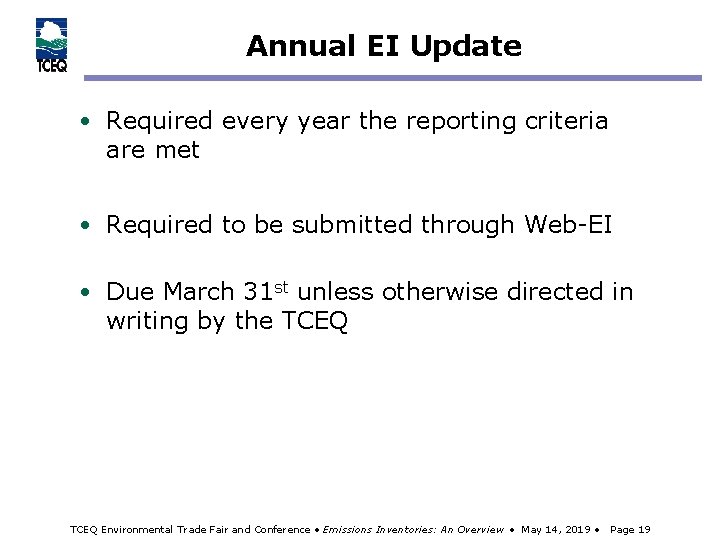
Annual EI Update • Required every year the reporting criteria are met • Required to be submitted through Web-EI • Due March 31 st unless otherwise directed in writing by the TCEQ Environmental Trade Fair and Conference • Emissions Inventories: An Overview • May 14, 2019 • Page 19
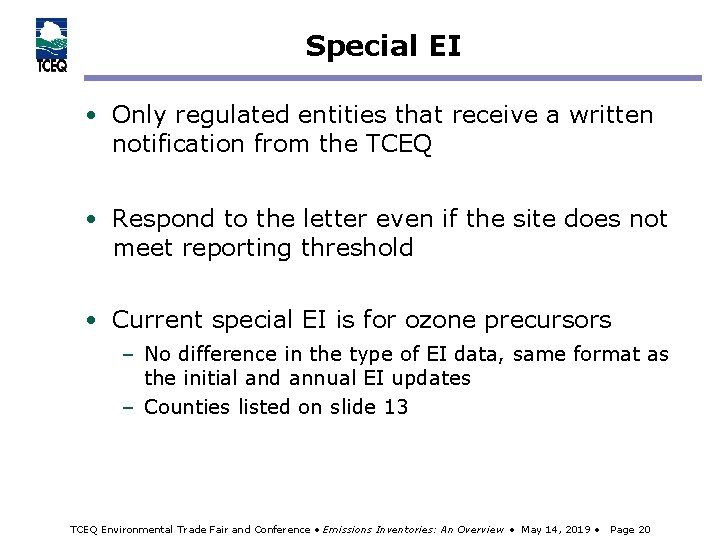
Special EI • Only regulated entities that receive a written notification from the TCEQ • Respond to the letter even if the site does not meet reporting threshold • Current special EI is for ozone precursors – No difference in the type of EI data, same format as the initial and annual EI updates – Counties listed on slide 13 TCEQ Environmental Trade Fair and Conference • Emissions Inventories: An Overview • May 14, 2019 • Page 20
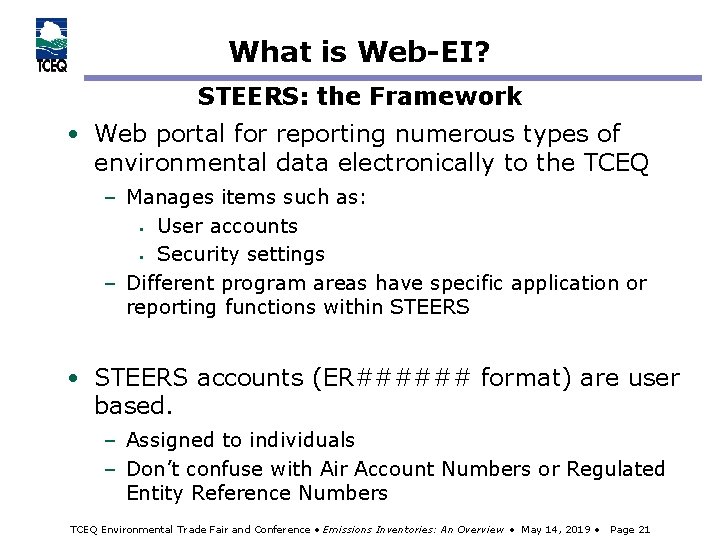
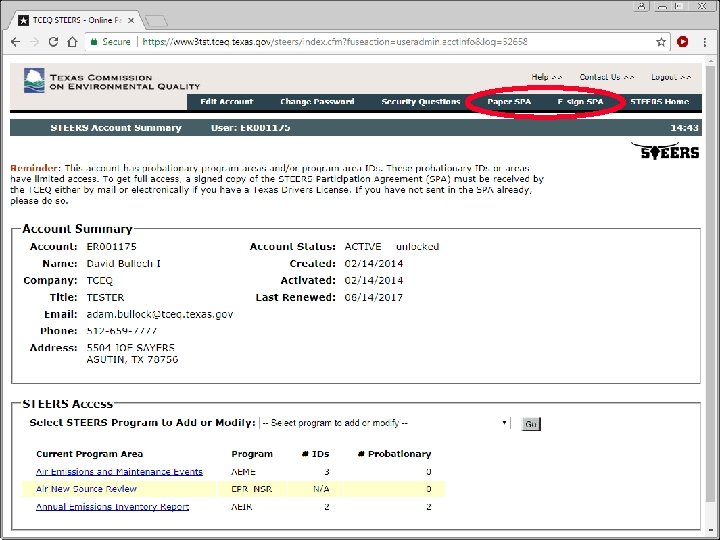
What is Web-EI? STEERS: the Framework • Web portal for reporting numerous types of environmental data electronically to the TCEQ – Manages items such as: § User accounts § Security settings – Different program areas have specific application or reporting functions within STEERS • STEERS accounts (ER###### format) are user based. – Assigned to individuals – Don’t confuse with Air Account Numbers or Regulated Entity Reference Numbers TCEQ Environmental Trade Fair and Conference • Emissions Inventories: An Overview • May 14, 2019 • Page 21
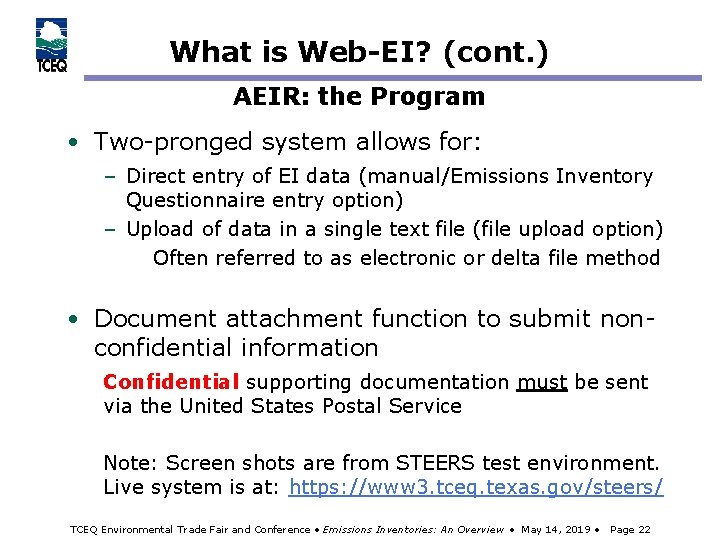
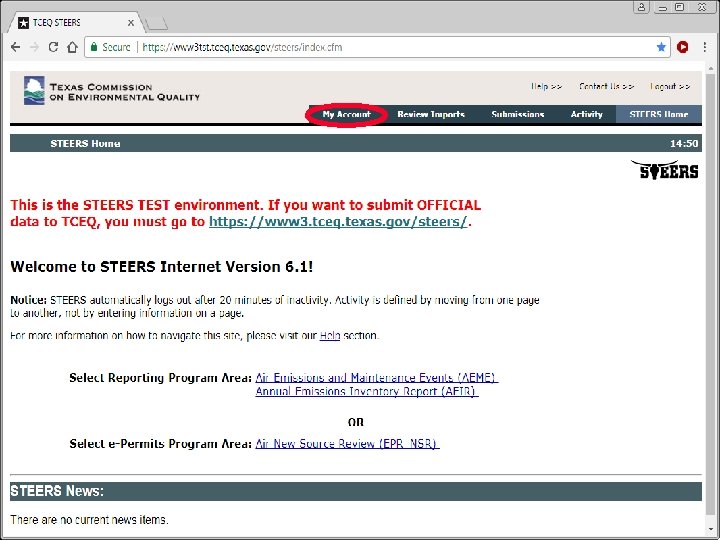
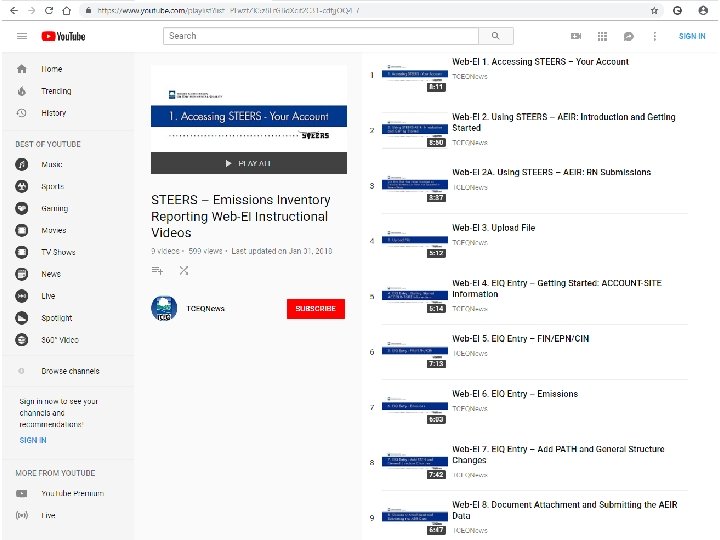
What is Web-EI? (cont. ) AEIR: the Program • Two-pronged system allows for: – Direct entry of EI data (manual/Emissions Inventory Questionnaire entry option) – Upload of data in a single text file (file upload option) Often referred to as electronic or delta file method • Document attachment function to submit nonconfidential information Confidential supporting documentation must be sent via the United States Postal Service Note: Screen shots are from STEERS test environment. Live system is at: https: //www 3. tceq. texas. gov/steers/ TCEQ Environmental Trade Fair and Conference • Emissions Inventories: An Overview • May 14, 2019 • Page 22
TCEQ Environmental Trade Fair and Conference • Emissions Inventories: An Overview • May 14, 2019 • Page 23
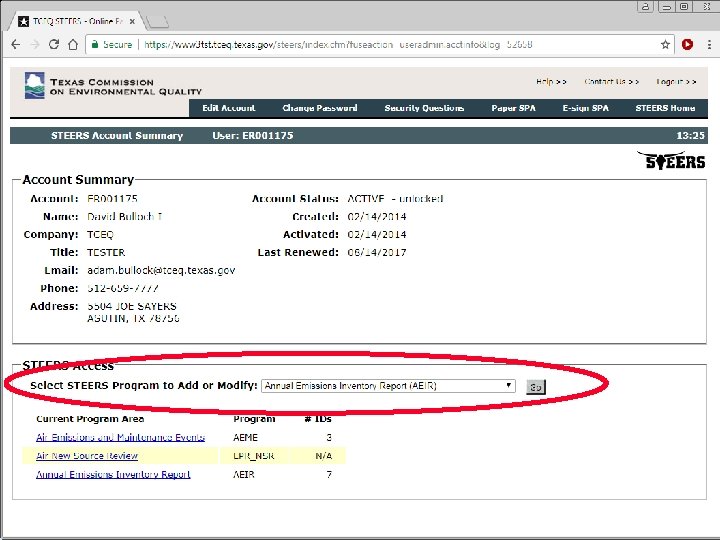
TCEQ Environmental Trade Fair and Conference • Emissions Inventories: An Overview • May 14, 2019 • Page 24
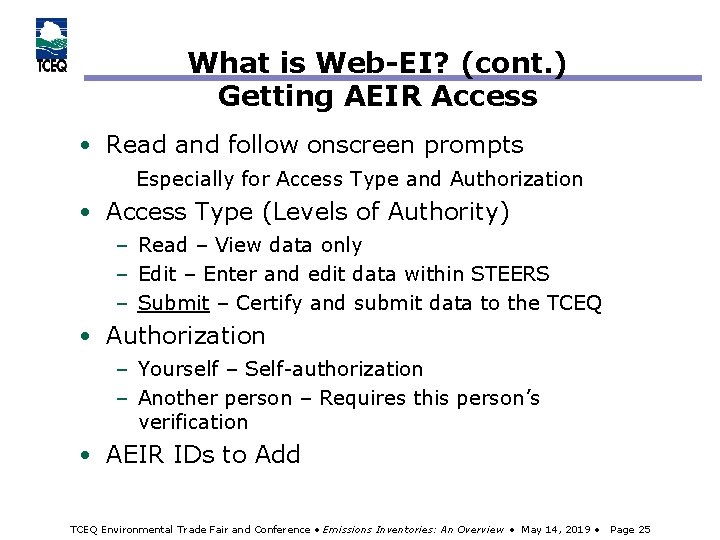
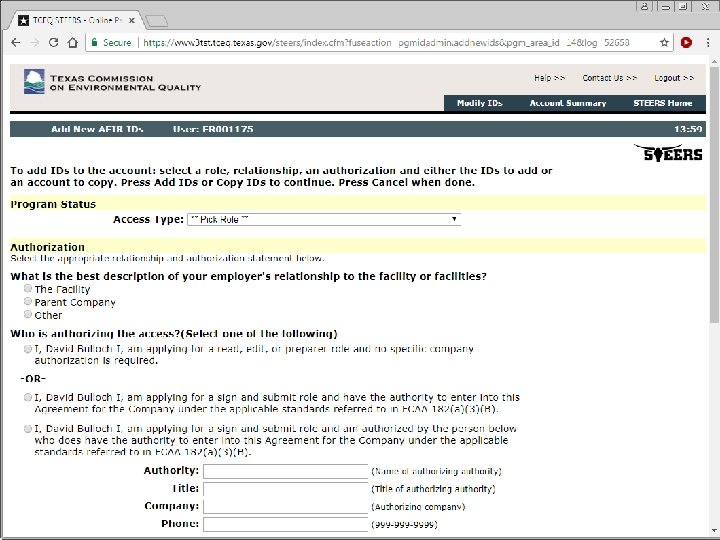
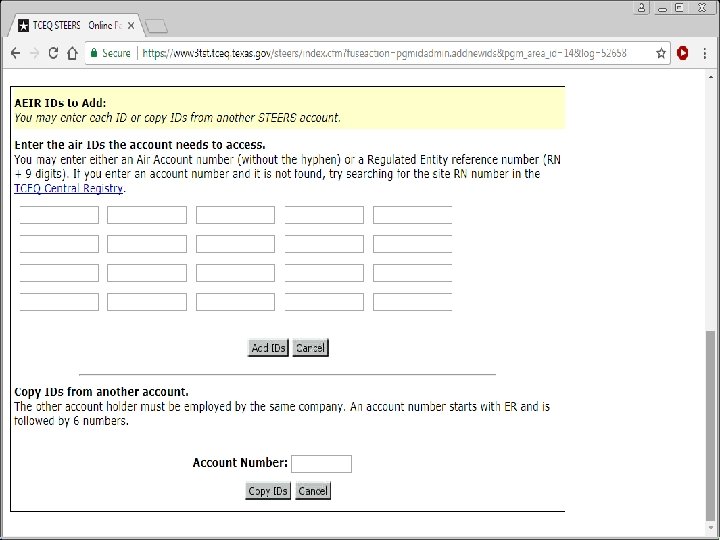
What is Web-EI? (cont. ) Getting AEIR Access • Read and follow onscreen prompts Especially for Access Type and Authorization • Access Type (Levels of Authority) – Read – View data only – Edit – Enter and edit data within STEERS – Submit – Certify and submit data to the TCEQ • Authorization – Yourself – Self-authorization – Another person – Requires this person’s verification • AEIR IDs to Add TCEQ Environmental Trade Fair and Conference • Emissions Inventories: An Overview • May 14, 2019 • Page 25
TCEQ Environmental Trade Fair and Conference • Emissions Inventories: An Overview • May 14, 2019 • Page 26
TCEQ Environmental Trade Fair and Conference • Emissions Inventories: An Overview • May 14, 2019 • Page 27
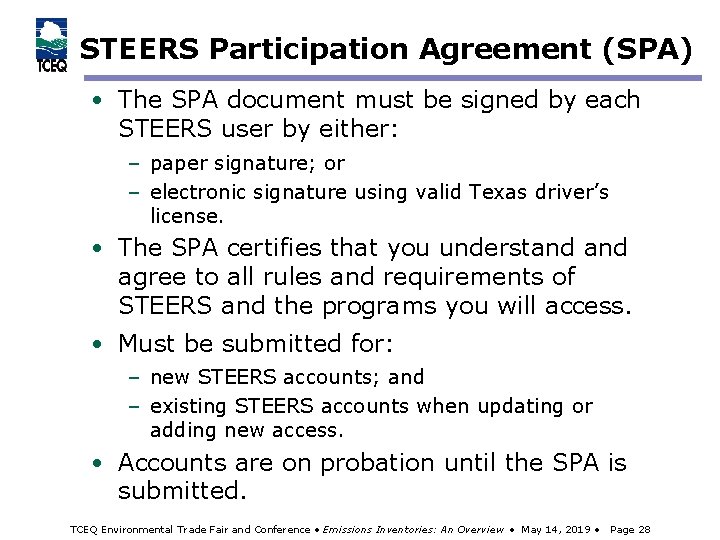
STEERS Participation Agreement (SPA) • The SPA document must be signed by each STEERS user by either: – paper signature; or – electronic signature using valid Texas driver’s license. • The SPA certifies that you understand agree to all rules and requirements of STEERS and the programs you will access. • Must be submitted for: – new STEERS accounts; and – existing STEERS accounts when updating or adding new access. • Accounts are on probation until the SPA is submitted. TCEQ Environmental Trade Fair and Conference • Emissions Inventories: An Overview • May 14, 2019 • Page 28
TCEQ Environmental Trade Fair and Conference • Emissions Inventories: An Overview • May 14, 2019 • Page 29
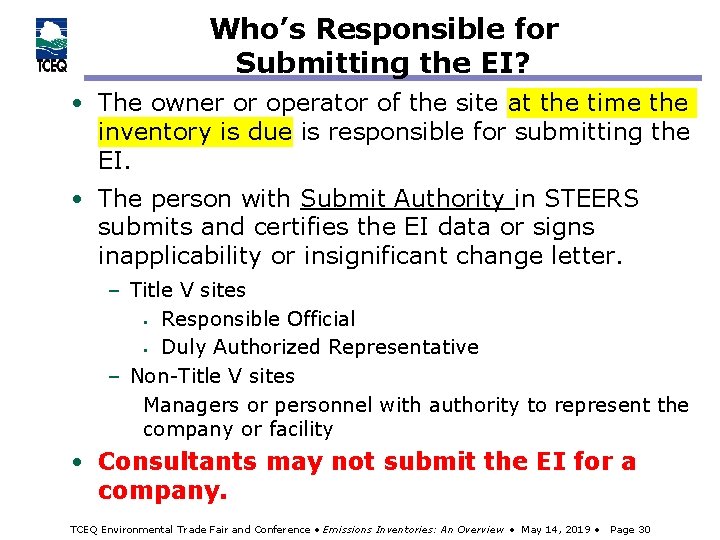
Who’s Responsible for Submitting the EI? • The owner or operator of the site at the time the inventory is due is responsible for submitting the EI. • The person with Submit Authority in STEERS submits and certifies the EI data or signs inapplicability or insignificant change letter. – Title V sites § Responsible Official § Duly Authorized Representative – Non-Title V sites Managers or personnel with authority to represent the company or facility • Consultants may not submit the EI for a company. TCEQ Environmental Trade Fair and Conference • Emissions Inventories: An Overview • May 14, 2019 • Page 30
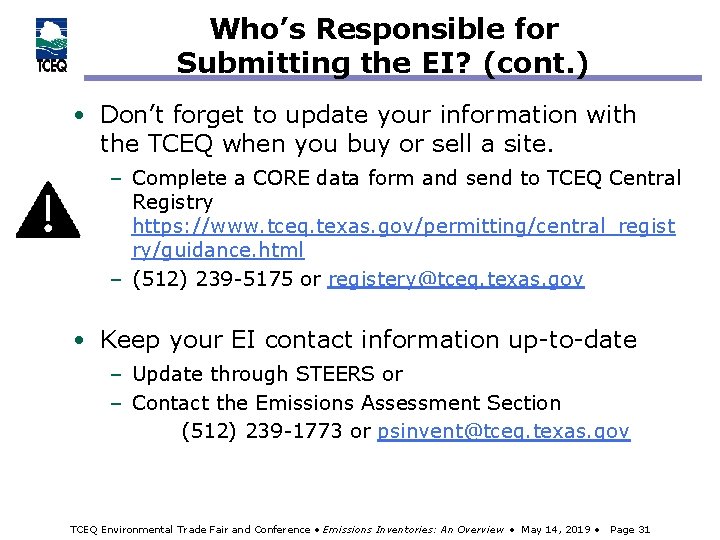
Who’s Responsible for Submitting the EI? (cont. ) • Don’t forget to update your information with the TCEQ when you buy or sell a site. – Complete a CORE data form and send to TCEQ Central Registry https: //www. tceq. texas. gov/permitting/central_regist ry/guidance. html – (512) 239 -5175 or registery@tceq. texas. gov • Keep your EI contact information up-to-date – Update through STEERS or – Contact the Emissions Assessment Section (512) 239 -1773 or psinvent@tceq. texas. gov TCEQ Environmental Trade Fair and Conference • Emissions Inventories: An Overview • May 14, 2019 • Page 31
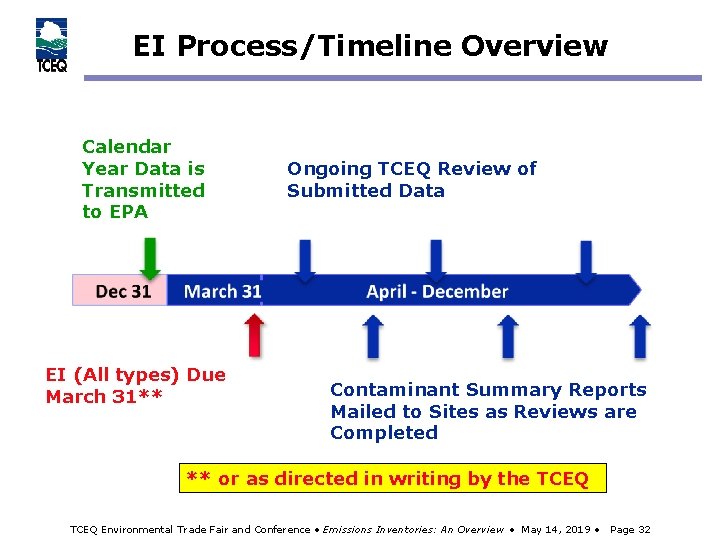
EI Process/Timeline Overview Calendar Year Data is Transmitted to EPA EI (All types) Due March 31** Ongoing TCEQ Review of Submitted Data Contaminant Summary Reports Mailed to Sites as Reviews are Completed ** or as directed in writing by the TCEQ Environmental Trade Fair and Conference • Emissions Inventories: An Overview • May 14, 2019 • Page 32
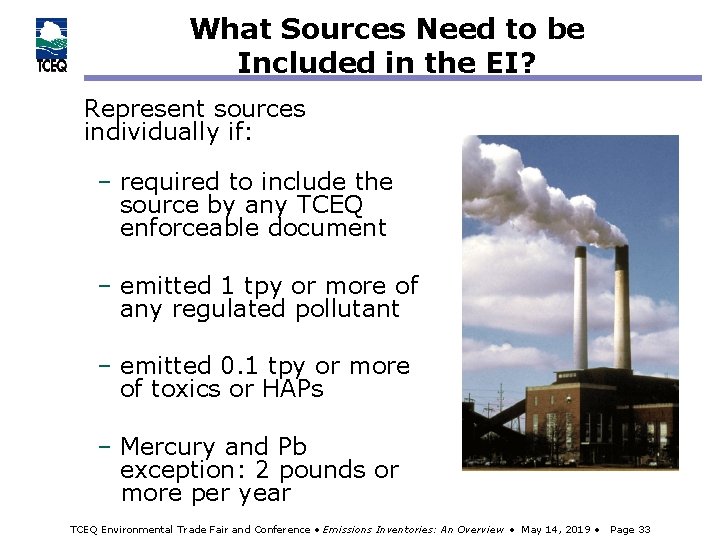
What Sources Need to be Included in the EI? Represent sources individually if: – required to include the source by any TCEQ enforceable document – emitted 1 tpy or more of any regulated pollutant – emitted 0. 1 tpy or more of toxics or HAPs – Mercury and Pb exception: 2 pounds or more per year TCEQ Environmental Trade Fair and Conference • Emissions Inventories: An Overview • May 14, 2019 • Page 33
What Sources Need to be Included in the EI? (cont. ) • Small emissions sources must be reported in the EI if the sum of the emissions meets or exceeds 5 tpy of regulated pollutants or 1 tpy of aggregate HAPs. • These sources may be added individually or as a group. TCEQ Environmental Trade Fair and Conference • Emissions Inventories: An Overview • May 14, 2019 • Page 34
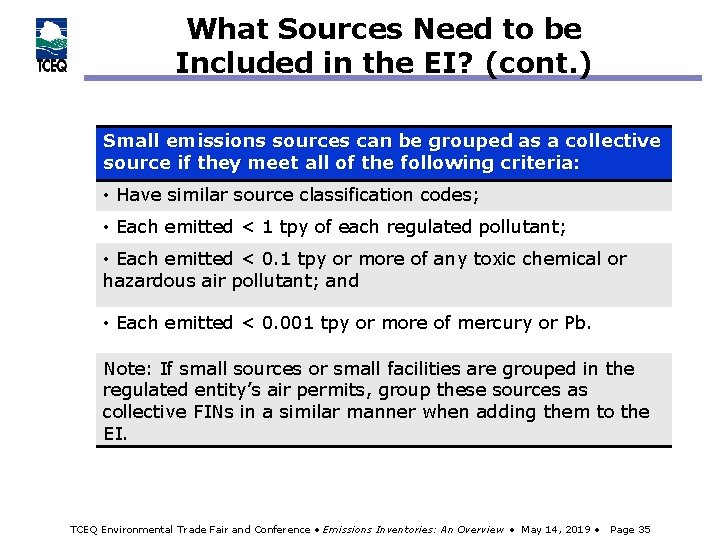
What Sources Need to be Included in the EI? (cont. ) Small emissions sources can be grouped as a collective source if they meet all of the following criteria: • Have similar source classification codes; • Each emitted < 1 tpy of each regulated pollutant; • Each emitted < 0. 1 tpy or more of any toxic chemical or hazardous air pollutant; and • Each emitted < 0. 001 tpy or more of mercury or Pb. Note: If small sources or small facilities are grouped in the regulated entity’s air permits, group these sources as collective FINs in a similar manner when adding them to the EI. TCEQ Environmental Trade Fair and Conference • Emissions Inventories: An Overview • May 14, 2019 • Page 35
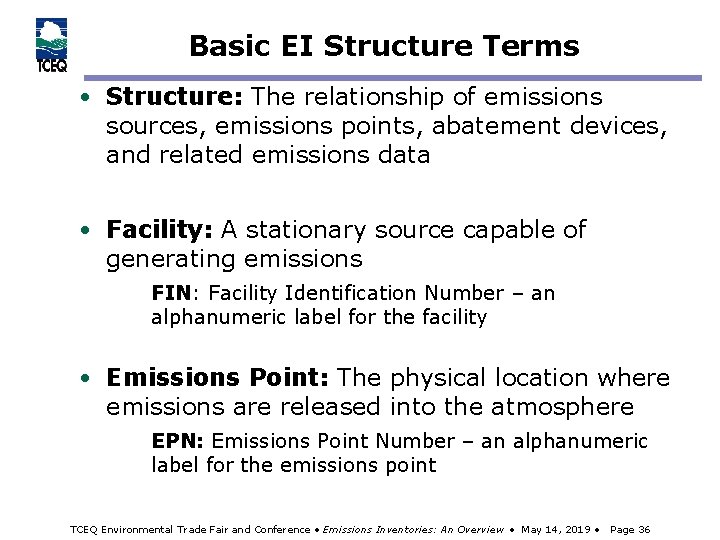
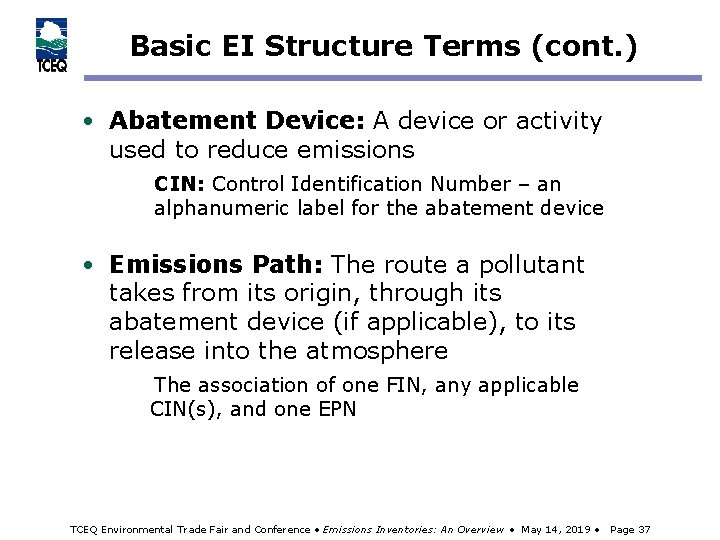
Basic EI Structure Terms • Structure: The relationship of emissions sources, emissions points, abatement devices, and related emissions data • Facility: A stationary source capable of generating emissions FIN: Facility Identification Number – an alphanumeric label for the facility • Emissions Point: The physical location where emissions are released into the atmosphere EPN: Emissions Point Number – an alphanumeric label for the emissions point TCEQ Environmental Trade Fair and Conference • Emissions Inventories: An Overview • May 14, 2019 • Page 36
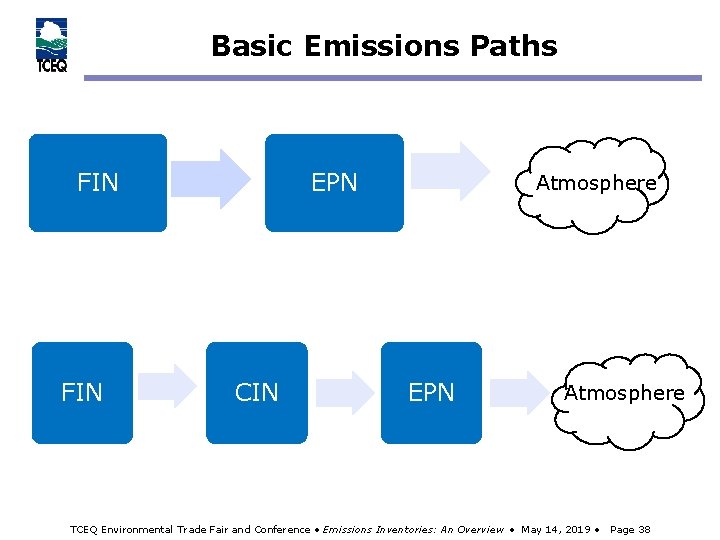
Basic EI Structure Terms (cont. ) • Abatement Device: A device or activity used to reduce emissions CIN: Control Identification Number – an alphanumeric label for the abatement device • Emissions Path: The route a pollutant takes from its origin, through its abatement device (if applicable), to its release into the atmosphere The association of one FIN, any applicable CIN(s), and one EPN TCEQ Environmental Trade Fair and Conference • Emissions Inventories: An Overview • May 14, 2019 • Page 37
Basic Emissions Paths FIN EPN CIN Atmosphere EPN Atmosphere TCEQ Environmental Trade Fair and Conference • Emissions Inventories: An Overview • May 14, 2019 • Page 38
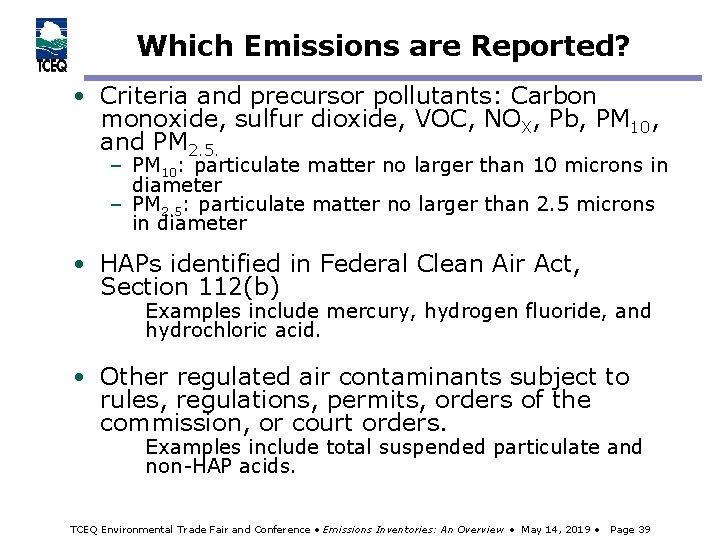
Which Emissions are Reported? • Criteria and precursor pollutants: Carbon monoxide, sulfur dioxide, VOC, NOX, Pb, PM 10, and PM 2. 5. – PM 10: particulate matter no larger than 10 microns in diameter – PM 2. 5: particulate matter no larger than 2. 5 microns in diameter • HAPs identified in Federal Clean Air Act, Section 112(b) Examples include mercury, hydrogen fluoride, and hydrochloric acid. • Other regulated air contaminants subject to rules, regulations, permits, orders of the commission, or court orders. Examples include total suspended particulate and non-HAP acids. TCEQ Environmental Trade Fair and Conference • Emissions Inventories: An Overview • May 14, 2019 • Page 39
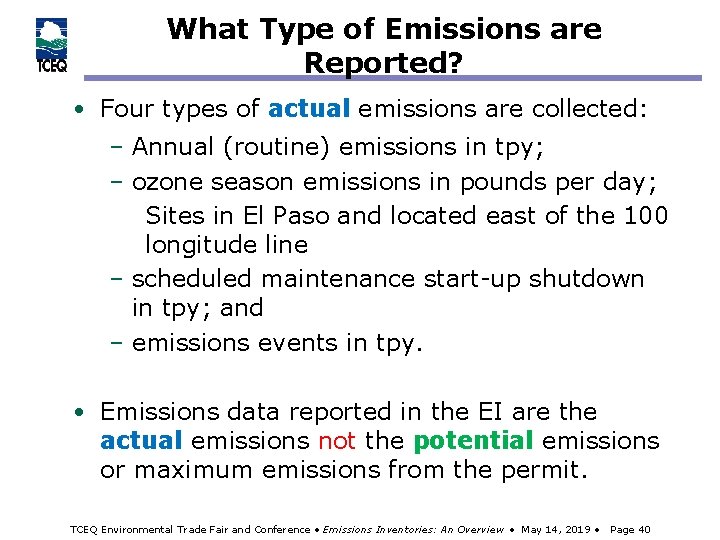
What Type of Emissions are Reported? • Four types of actual emissions are collected: – Annual (routine) emissions in tpy; – ozone season emissions in pounds per day; Sites in El Paso and located east of the 100 longitude line – scheduled maintenance start-up shutdown in tpy; and – emissions events in tpy. • Emissions data reported in the EI are the actual emissions not the potential emissions or maximum emissions from the permit. TCEQ Environmental Trade Fair and Conference • Emissions Inventories: An Overview • May 14, 2019 • Page 40
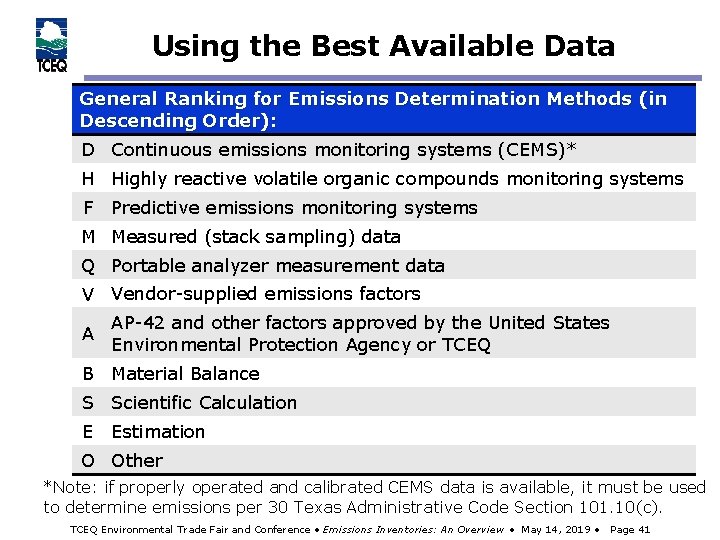
Using the Best Available Data General Ranking for Emissions Determination Methods (in Descending Order): D Continuous emissions monitoring systems (CEMS)* H Highly reactive volatile organic compounds monitoring systems F Predictive emissions monitoring systems M Measured (stack sampling) data Q Portable analyzer measurement data V Vendor-supplied emissions factors A AP-42 and other factors approved by the United States Environmental Protection Agency or TCEQ B Material Balance S Scientific Calculation E Estimation O Other *Note: if properly operated and calibrated CEMS data is available, it must be used to determine emissions per 30 Texas Administrative Code Section 101. 10(c). TCEQ Environmental Trade Fair and Conference • Emissions Inventories: An Overview • May 14, 2019 • Page 41
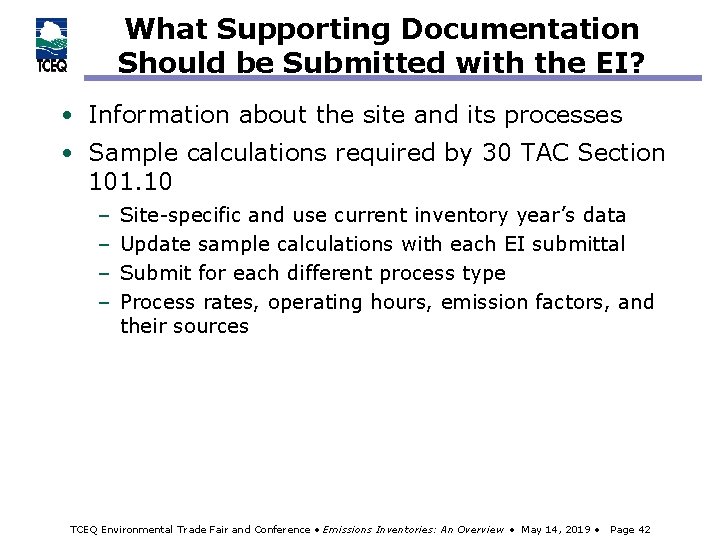
What Supporting Documentation Should be Submitted with the EI? • Information about the site and its processes • Sample calculations required by 30 TAC Section 101. 10 – – Site-specific and use current inventory year’s data Update sample calculations with each EI submittal Submit for each different process type Process rates, operating hours, emission factors, and their sources TCEQ Environmental Trade Fair and Conference • Emissions Inventories: An Overview • May 14, 2019 • Page 42
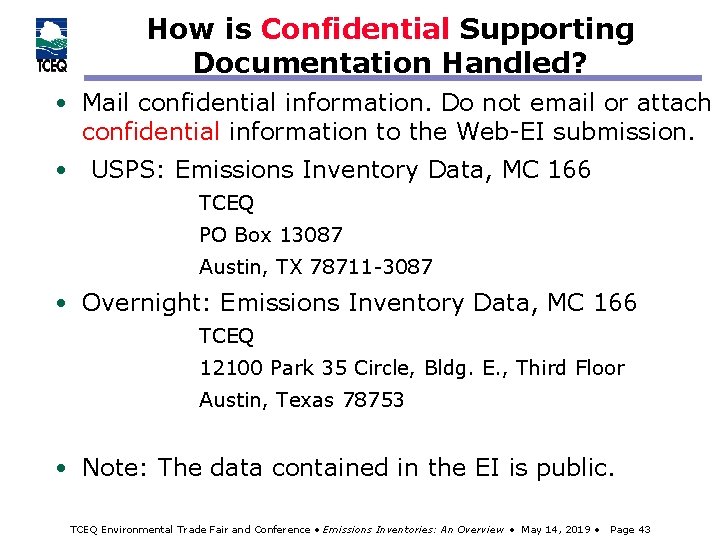
How is Confidential Supporting Documentation Handled? • Mail confidential information. Do not email or attach confidential information to the Web-EI submission. • USPS: Emissions Inventory Data, MC 166 TCEQ PO Box 13087 Austin, TX 78711 -3087 • Overnight: Emissions Inventory Data, MC 166 TCEQ 12100 Park 35 Circle, Bldg. E. , Third Floor Austin, Texas 78753 • Note: The data contained in the EI is public. TCEQ Environmental Trade Fair and Conference • Emissions Inventories: An Overview • May 14, 2019 • Page 43
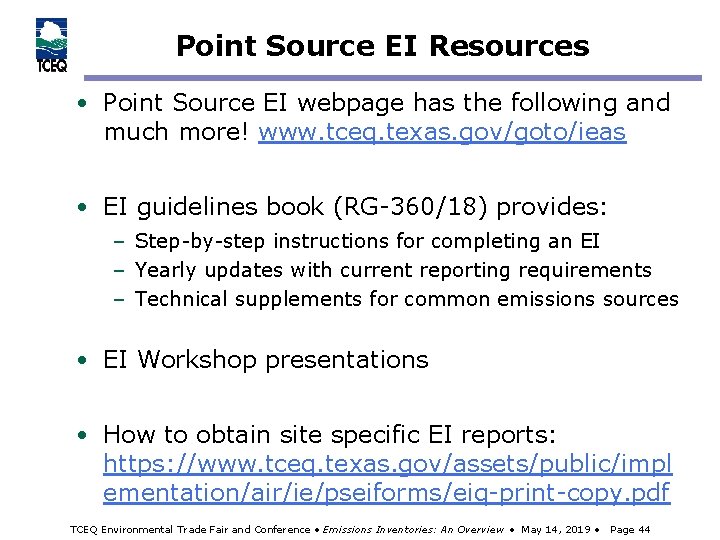
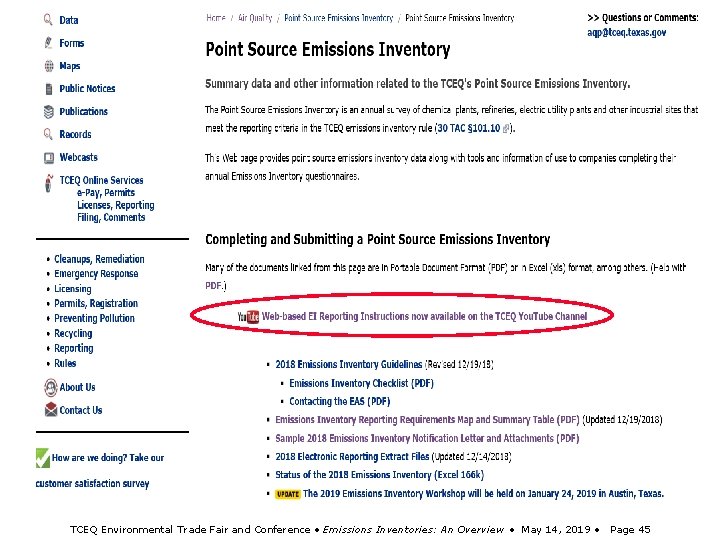
Point Source EI Resources • Point Source EI webpage has the following and much more! www. tceq. texas. gov/goto/ieas • EI guidelines book (RG-360/18) provides: – Step-by-step instructions for completing an EI – Yearly updates with current reporting requirements – Technical supplements for common emissions sources • EI Workshop presentations • How to obtain site specific EI reports: https: //www. tceq. texas. gov/assets/public/impl ementation/air/ie/pseiforms/eiq-print-copy. pdf TCEQ Environmental Trade Fair and Conference • Emissions Inventories: An Overview • May 14, 2019 • Page 44
TCEQ Environmental Trade Fair and Conference • Emissions Inventories: An Overview • May 14, 2019 • Page 45
TCEQ Environmental Trade Fair and Conference • Emissions Inventories: An Overview • May 14, 2019 • Page 46
Point Source EI Resources (cont. ) • Emissions Assessment Section Help Line: (512) 239 -1773 psinvent@tceq. texas. gov • Jill Dickey-Hull: (512) 239 -5912 jill. dickey@tceq. texas. gov • STEERS (non-AEIR items): (512) 239 -6925 steers@tceq. texas. gov TCEQ Environmental Trade Fair and Conference • Emissions Inventories: An Overview • May 14, 2019 • Page 47
Area Source and Mobile Source EI • The area and mobile source emissions inventories are developed in accordance with the requirements of the Air Emissions Reporting Requirements per 40 Code of Federal Regulations Part 51. • Emissions estimates for area and mobile sources are developed through the use of United States Environmental Protection Agency (EPA) default emissions estimates, TCEQ-contracted projects, and TCEQ staff projects. TCEQ Environmental Trade Fair and Conference • Emissions Inventories: An Overview • May 14, 2019 • Page 48
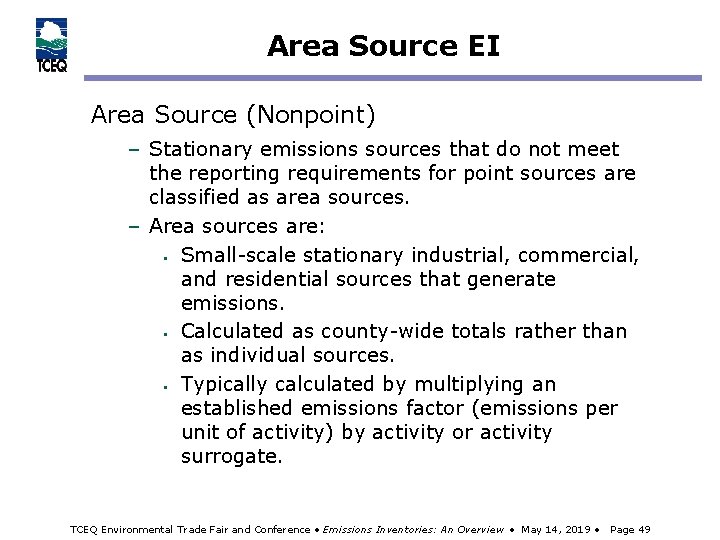
Area Source EI Area Source (Nonpoint) – Stationary emissions sources that do not meet the reporting requirements for point sources are classified as area sources. – Area sources are: § Small-scale stationary industrial, commercial, and residential sources that generate emissions. § Calculated as county-wide totals rather than as individual sources. § Typically calculated by multiplying an established emissions factor (emissions per unit of activity) by activity or activity surrogate. TCEQ Environmental Trade Fair and Conference • Emissions Inventories: An Overview • May 14, 2019 • Page 49
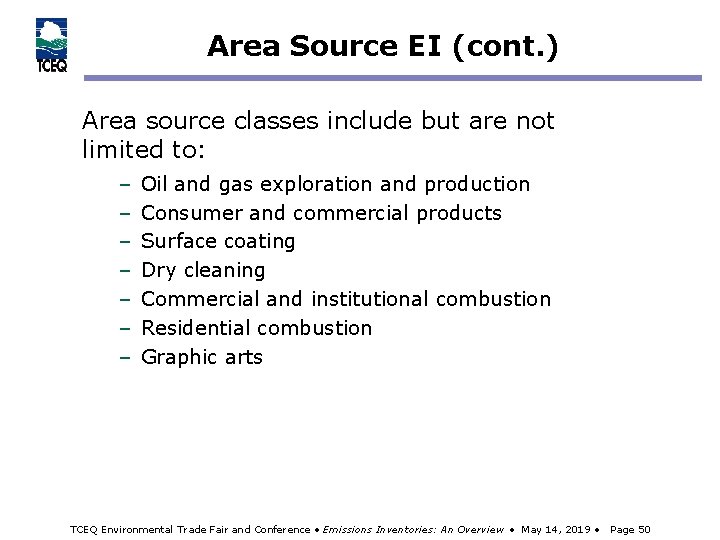
Area Source EI (cont. ) Area source classes include but are not limited to: – – – – Oil and gas exploration and production Consumer and commercial products Surface coating Dry cleaning Commercial and institutional combustion Residential combustion Graphic arts TCEQ Environmental Trade Fair and Conference • Emissions Inventories: An Overview • May 14, 2019 • Page 50
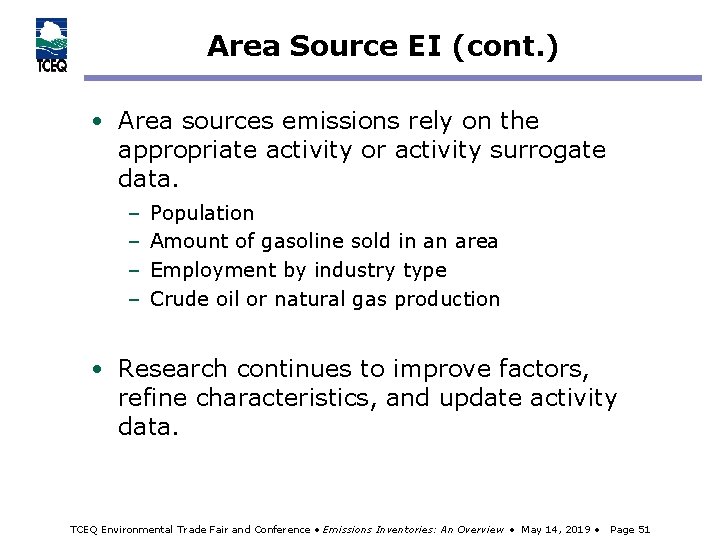
Area Source EI (cont. ) • Area sources emissions rely on the appropriate activity or activity surrogate data. – – Population Amount of gasoline sold in an area Employment by industry type Crude oil or natural gas production • Research continues to improve factors, refine characteristics, and update activity data. TCEQ Environmental Trade Fair and Conference • Emissions Inventories: An Overview • May 14, 2019 • Page 51
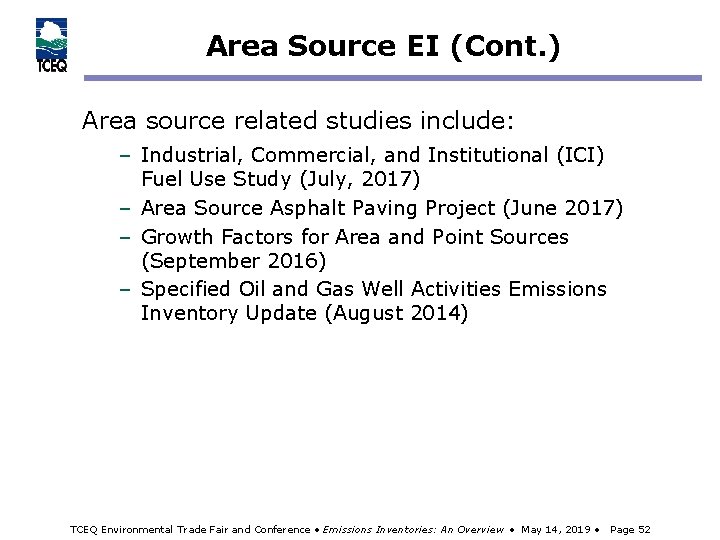
Area Source EI (Cont. ) Area source related studies include: – Industrial, Commercial, and Institutional (ICI) Fuel Use Study (July, 2017) – Area Source Asphalt Paving Project (June 2017) – Growth Factors for Area and Point Sources (September 2016) – Specified Oil and Gas Well Activities Emissions Inventory Update (August 2014) TCEQ Environmental Trade Fair and Conference • Emissions Inventories: An Overview • May 14, 2019 • Page 52
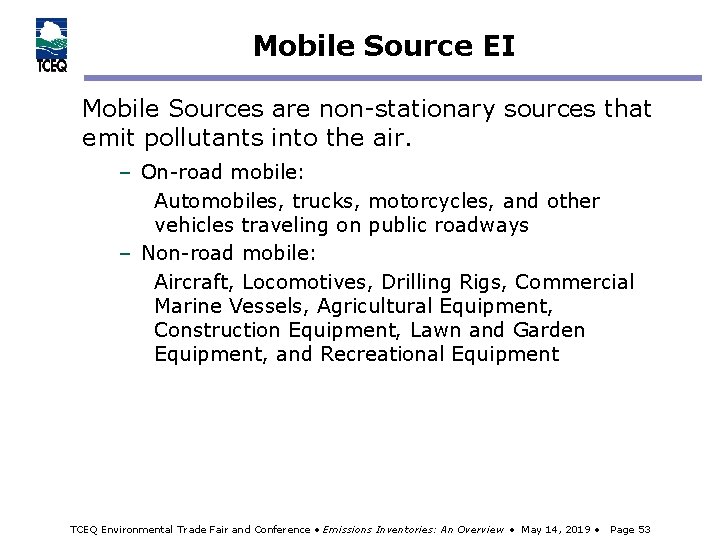
Mobile Source EI Mobile Sources are non-stationary sources that emit pollutants into the air. – On-road mobile: Automobiles, trucks, motorcycles, and other vehicles traveling on public roadways – Non-road mobile: Aircraft, Locomotives, Drilling Rigs, Commercial Marine Vessels, Agricultural Equipment, Construction Equipment, Lawn and Garden Equipment, and Recreational Equipment TCEQ Environmental Trade Fair and Conference • Emissions Inventories: An Overview • May 14, 2019 • Page 53
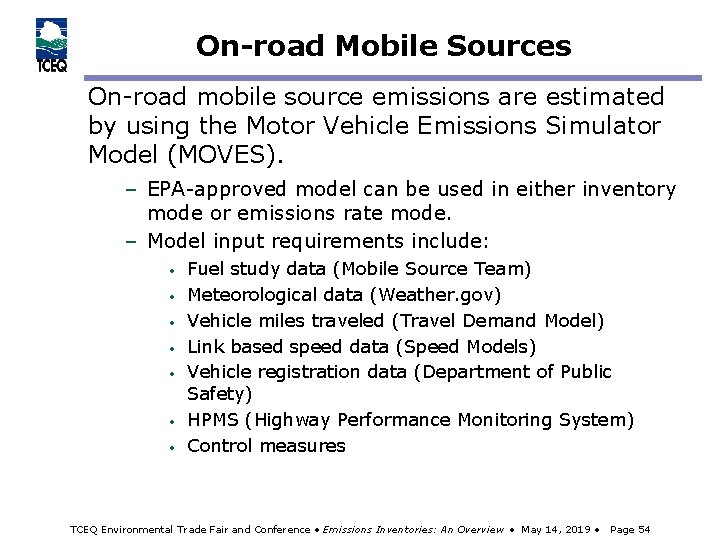
On-road Mobile Sources On-road mobile source emissions are estimated by using the Motor Vehicle Emissions Simulator Model (MOVES). – EPA-approved model can be used in either inventory mode or emissions rate mode. – Model input requirements include: • • Fuel study data (Mobile Source Team) Meteorological data (Weather. gov) Vehicle miles traveled (Travel Demand Model) Link based speed data (Speed Models) Vehicle registration data (Department of Public Safety) HPMS (Highway Performance Monitoring System) Control measures TCEQ Environmental Trade Fair and Conference • Emissions Inventories: An Overview • May 14, 2019 • Page 54
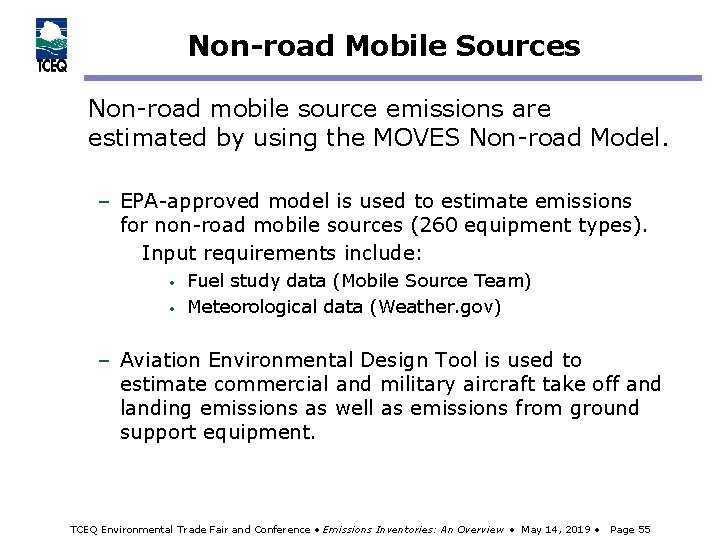
Non-road Mobile Sources Non-road mobile source emissions are estimated by using the MOVES Non-road Model. – EPA-approved model is used to estimate emissions for non-road mobile sources (260 equipment types). Input requirements include: • • Fuel study data (Mobile Source Team) Meteorological data (Weather. gov) – Aviation Environmental Design Tool is used to estimate commercial and military aircraft take off and landing emissions as well as emissions from ground support equipment. TCEQ Environmental Trade Fair and Conference • Emissions Inventories: An Overview • May 14, 2019 • Page 55
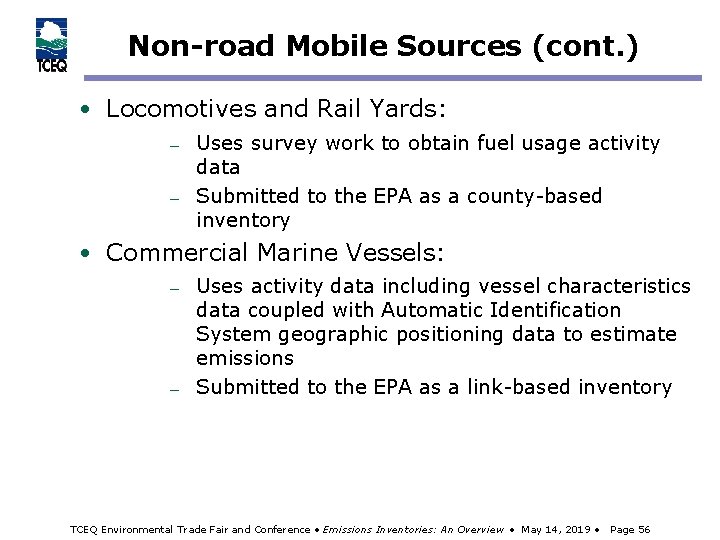
Non-road Mobile Sources (cont. ) • Locomotives and Rail Yards: — — Uses survey work to obtain fuel usage activity data Submitted to the EPA as a county-based inventory • Commercial Marine Vessels: — — Uses activity data including vessel characteristics data coupled with Automatic Identification System geographic positioning data to estimate emissions Submitted to the EPA as a link-based inventory TCEQ Environmental Trade Fair and Conference • Emissions Inventories: An Overview • May 14, 2019 • Page 56
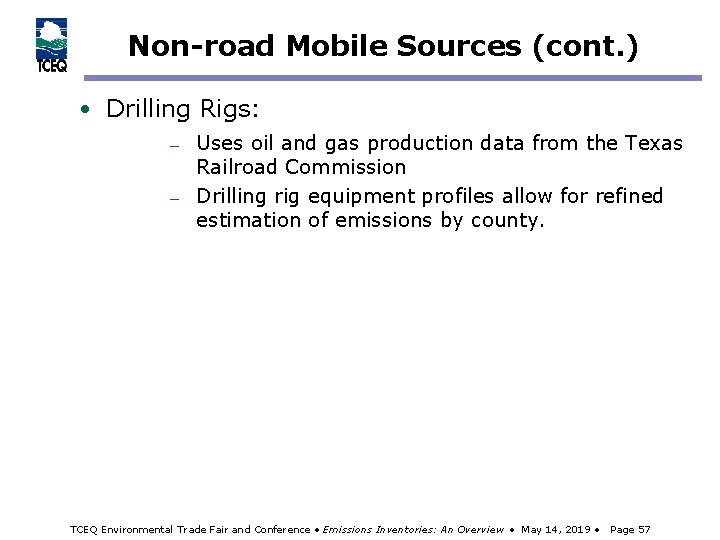
Non-road Mobile Sources (cont. ) • Drilling Rigs: — — Uses oil and gas production data from the Texas Railroad Commission Drilling rig equipment profiles allow for refined estimation of emissions by county. TCEQ Environmental Trade Fair and Conference • Emissions Inventories: An Overview • May 14, 2019 • Page 57
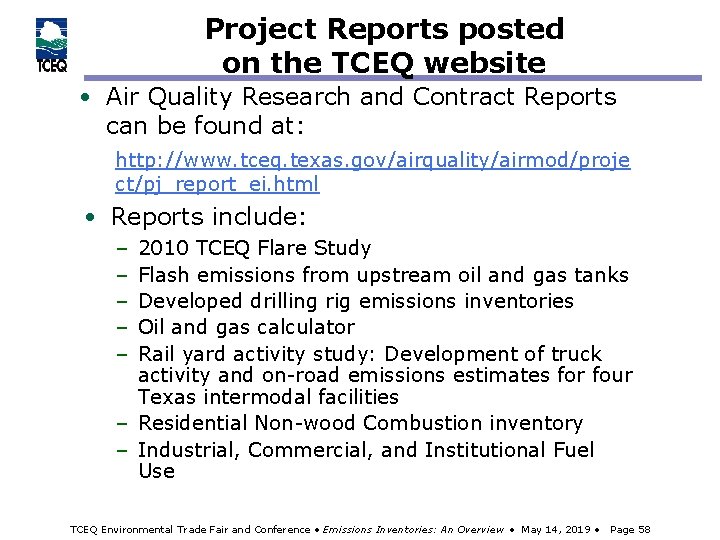
Project Reports posted on the TCEQ website • Air Quality Research and Contract Reports can be found at: http: //www. tceq. texas. gov/airquality/airmod/proje ct/pj_report_ei. html • Reports include: – – – 2010 TCEQ Flare Study Flash emissions from upstream oil and gas tanks Developed drilling rig emissions inventories Oil and gas calculator Rail yard activity study: Development of truck activity and on-road emissions estimates for four Texas intermodal facilities – Residential Non-wood Combustion inventory – Industrial, Commercial, and Institutional Fuel Use TCEQ Environmental Trade Fair and Conference • Emissions Inventories: An Overview • May 14, 2019 • Page 58
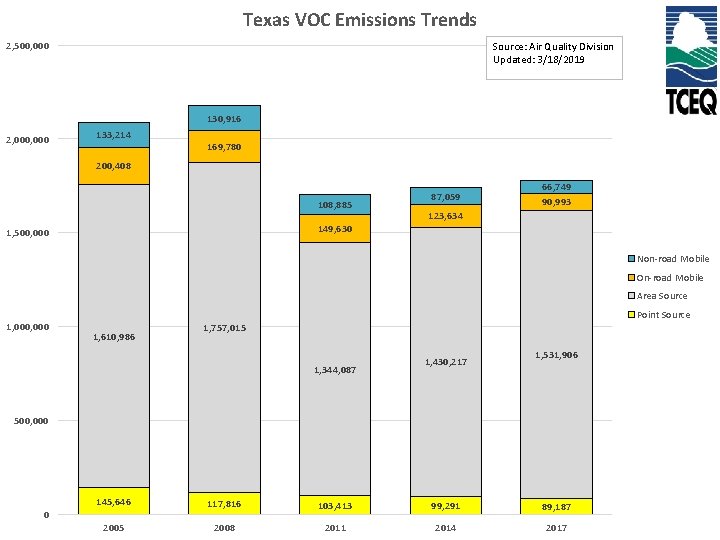
Texas VOC Emissions Trends 2, 500, 000 Source: Air Quality Division Updated: 3/18/2019 130, 916 2, 000 133, 214 169, 780 200, 408 108, 885 87, 059 66, 749 90, 993 123, 634 149, 630 1, 500, 000 Non-road Mobile On-road Mobile Area Source 1, 000 Point Source 1, 610, 986 1, 757, 015 1, 344, 087 1, 430, 217 1, 531, 906 500, 000 0 145, 646 117, 816 103, 413 99, 291 89, 187 2005 2008 2011 2014 2017
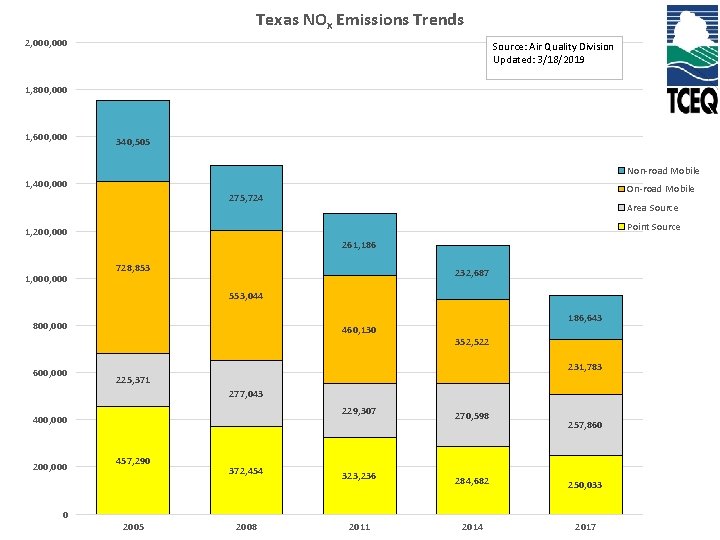
Texas NOx Emissions Trends 2, 000 Source: Air Quality Division Updated: 3/18/2019 1, 800, 000 1, 600, 000 340, 505 Non-road Mobile 1, 400, 000 On-road Mobile 275, 724 Area Source Point Source 1, 200, 000 261, 186 1, 000 728, 853 232, 687 553, 044 800, 000 600, 000 460, 130 186, 643 352, 522 231, 783 225, 371 277, 043 229, 307 400, 000 200, 000 0 457, 290 2005 372, 454 2008 270, 598 257, 860 323, 236 284, 682 250, 033 2011 2014 2017
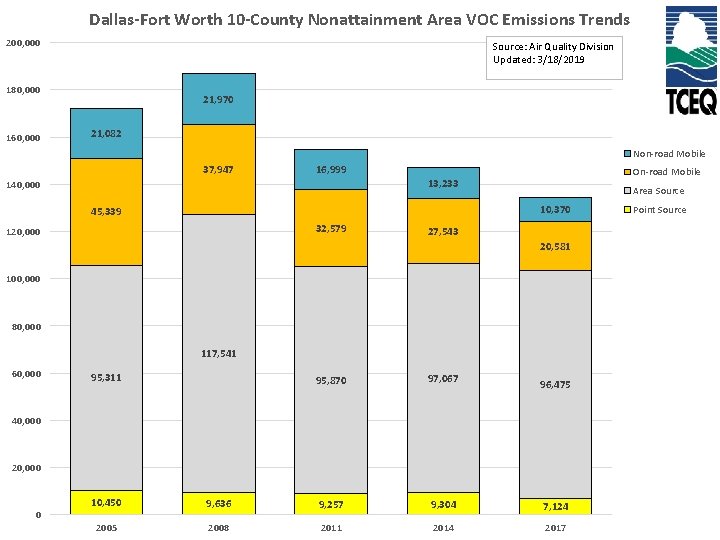
Dallas-Fort Worth 10 -County Nonattainment Area VOC Emissions Trends 200, 000 Source: Air Quality Division Updated: 3/18/2019 180, 000 160, 000 21, 970 21, 082 Non-road Mobile 37, 947 16, 999 140, 000 On-road Mobile 13, 233 Area Source 10, 370 45, 339 32, 579 120, 000 27, 543 20, 581 100, 000 80, 000 117, 541 60, 000 95, 311 95, 870 97, 067 96, 475 40, 000 20, 000 0 10, 450 9, 636 9, 257 9, 304 7, 124 2005 2008 2011 2014 2017 Point Source
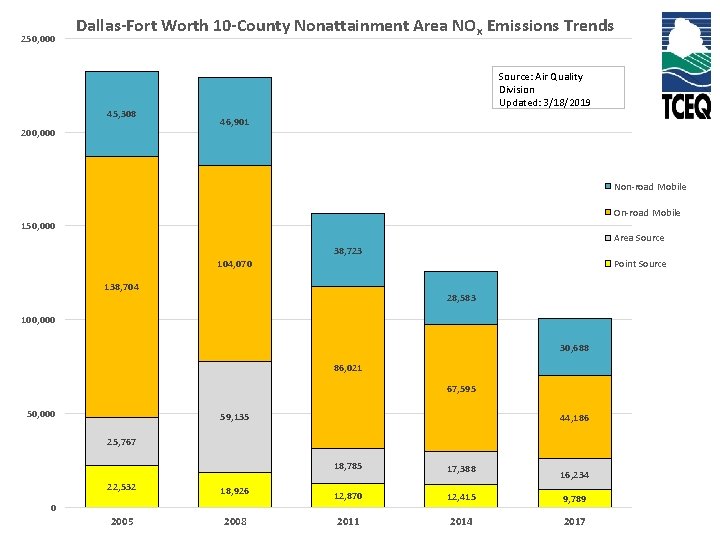
250, 000 Dallas-Fort Worth 10 -County Nonattainment Area NOx Emissions Trends 45, 308 200, 000 Source: Air Quality Division Updated: 3/18/2019 46, 901 Non-road Mobile On-road Mobile 150, 000 Area Source 38, 723 104, 070 Point Source 138, 704 28, 583 100, 000 30, 688 86, 021 67, 595 50, 000 59, 135 44, 186 25, 767 22, 532 18, 926 2005 2008 0 18, 785 17, 388 12, 870 12, 415 9, 789 2011 2014 2017 16, 234
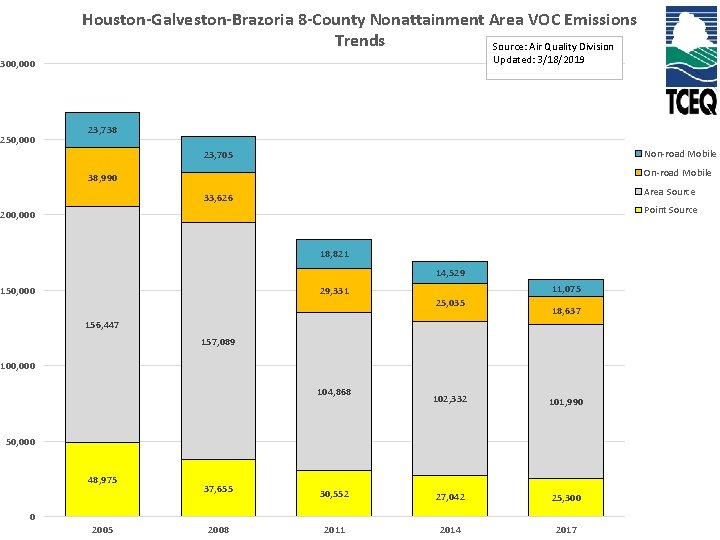
Houston-Galveston-Brazoria 8 -County Nonattainment Area VOC Emissions Trends Source: Air Quality Division Updated: 3/18/2019 300, 000 250, 000 23, 738 Non-road Mobile 23, 705 On-road Mobile 38, 990 Area Source 33, 626 Point Source 200, 000 18, 821 14, 529 29, 331 150, 000 11, 075 25, 035 18, 637 156, 447 157, 089 100, 000 104, 868 102, 332 101, 990 30, 552 27, 042 25, 300 2011 2014 2017 50, 000 48, 975 0 2005 37, 655 2008
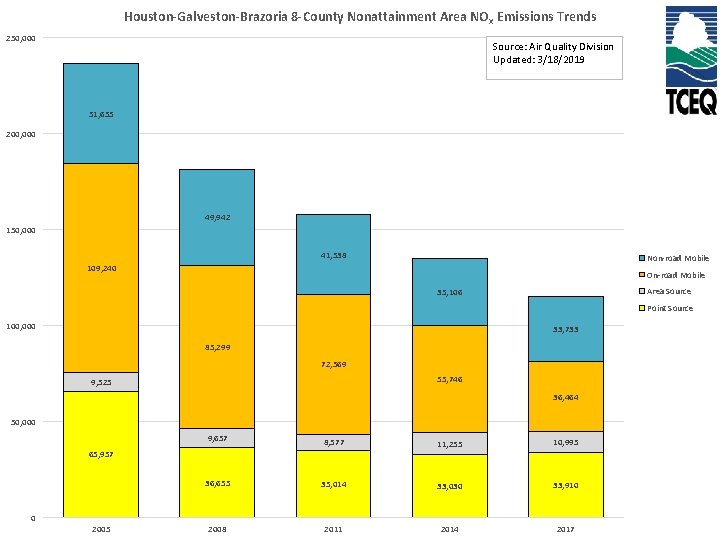
Houston-Galveston-Brazoria 8 -County Nonattainment Area NO x Emissions Trends 250, 000 Source: Air Quality Division Updated: 3/18/2019 51, 655 200, 000 49, 942 150, 000 41, 538 Non-road Mobile 109, 240 On-road Mobile Area Source 35, 106 Point Source 100, 000 33, 733 85, 299 72, 569 55, 746 9, 525 36, 464 50, 000 9, 657 8, 577 11, 255 10, 995 36, 655 35, 014 33, 030 33, 910 2008 2011 2014 2017 65, 957 0 2005
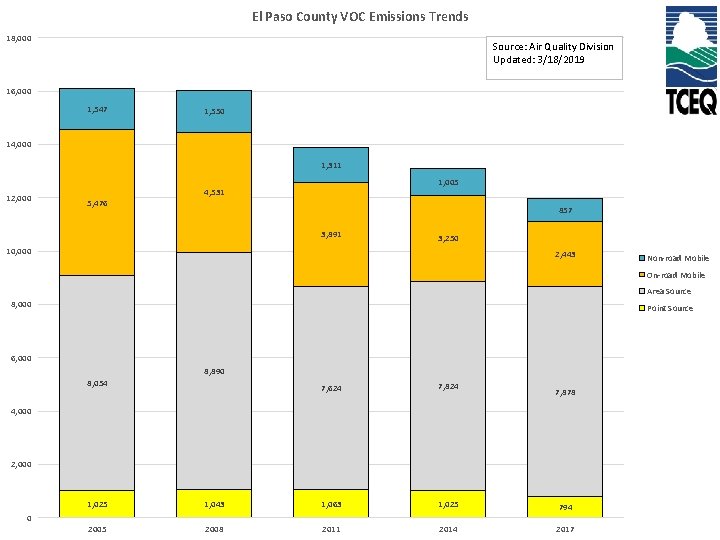
El Paso County VOC Emissions Trends 18, 000 Source: Air Quality Division Updated: 3/18/2019 16, 000 1, 547 1, 550 14, 000 1, 311 12, 000 5, 476 1, 005 4, 531 857 3, 891 3, 250 10, 000 2, 443 Non-road Mobile On-road Mobile Area Source 8, 000 Point Source 6, 000 8, 890 8, 054 7, 624 7, 878 4, 000 2, 000 0 1, 025 1, 043 1, 063 1, 025 794 2005 2008 2011 2014 2017
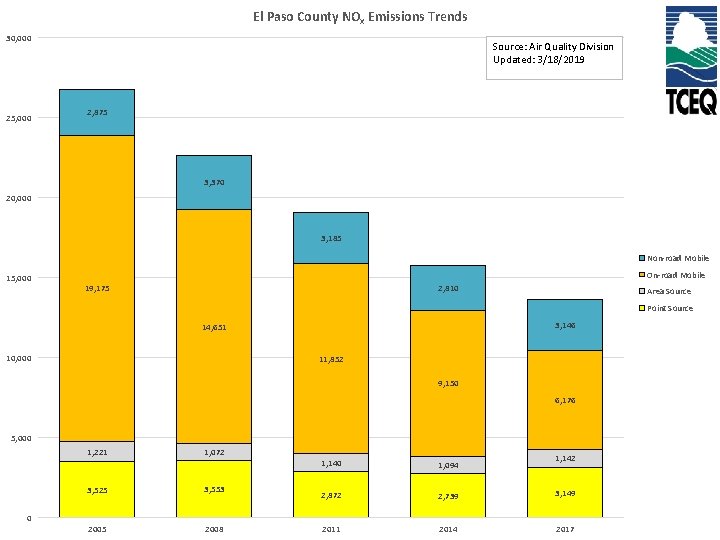
El Paso County NOx Emissions Trends 30, 000 25, 000 Source: Air Quality Division Updated: 3/18/2019 2, 875 3, 370 20, 000 3, 185 Non-road Mobile 15, 000 On-road Mobile 2, 810 19, 175 Area Source Point Source 3, 146 14, 651 10, 000 11, 852 9, 150 6, 176 5, 000 1, 221 0 1, 072 3, 525 3, 553 2005 2008 1, 142 1, 140 1, 094 2, 872 2, 739 3, 149 2011 2014 2017
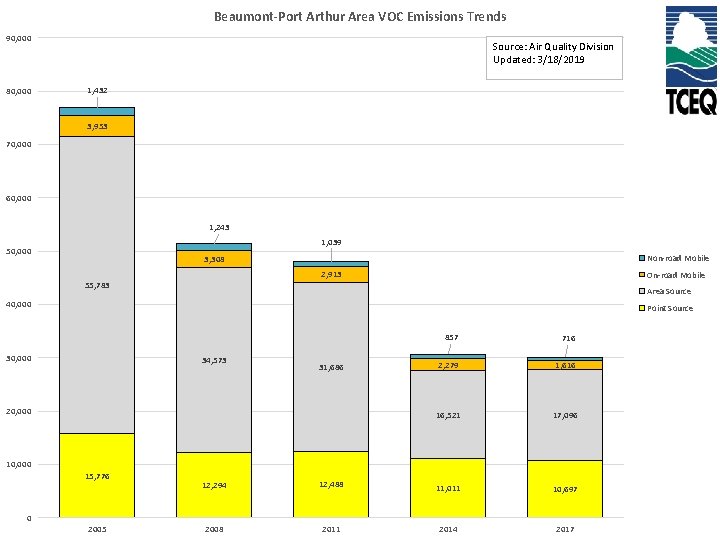
Beaumont-Port Arthur Area VOC Emissions Trends 90, 000 80, 000 Source: Air Quality Division Updated: 3/18/2019 1, 432 3, 953 70, 000 60, 000 1, 243 1, 039 50, 000 Non-road Mobile 3, 308 2, 913 55, 783 On-road Mobile Area Source 40, 000 Point Source 30, 000 34, 573 31, 686 20, 000 857 716 2, 279 1, 616 16, 521 17, 096 10, 000 15, 776 0 2005 12, 294 12, 488 11, 011 10, 697 2008 2011 2014 2017
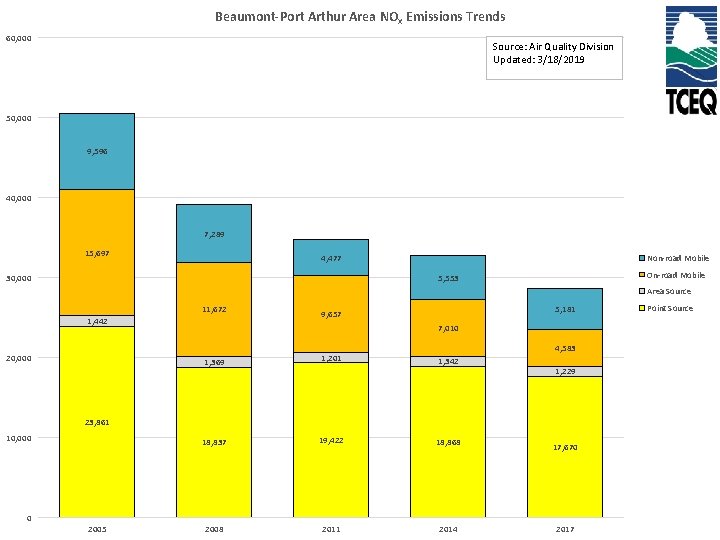
Beaumont-Port Arthur Area NOx Emissions Trends 60, 000 Source: Air Quality Division Updated: 3/18/2019 50, 000 9, 596 40, 000 7, 289 15, 697 4, 477 30, 000 Non-road Mobile On-road Mobile 5, 553 Area Source 11, 672 1, 442 20, 000 5, 181 9, 657 7, 010 4, 583 1, 369 1, 201 18, 837 19, 422 18, 868 2008 2011 2014 1, 342 1, 229 23, 861 10, 000 0 2005 17, 670 2017 Point Source
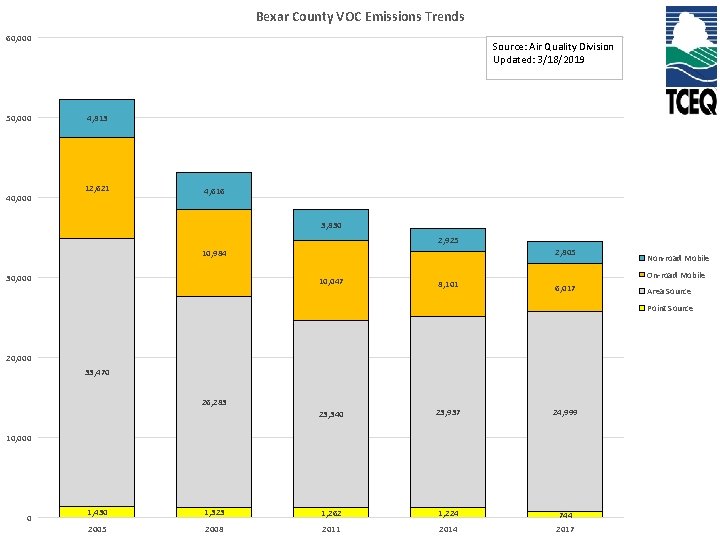
Bexar County VOC Emissions Trends 60, 000 50, 000 40, 000 Source: Air Quality Division Updated: 3/18/2019 4, 813 12, 621 4, 616 3, 830 2, 925 2, 805 10, 984 30, 000 10, 047 8, 101 Non-road Mobile On-road Mobile 6, 017 Area Source Point Source 20, 000 33, 470 26, 283 23, 340 23, 937 24, 999 10, 000 0 1, 430 1, 323 1, 262 1, 224 744 2005 2008 2011 2014 2017
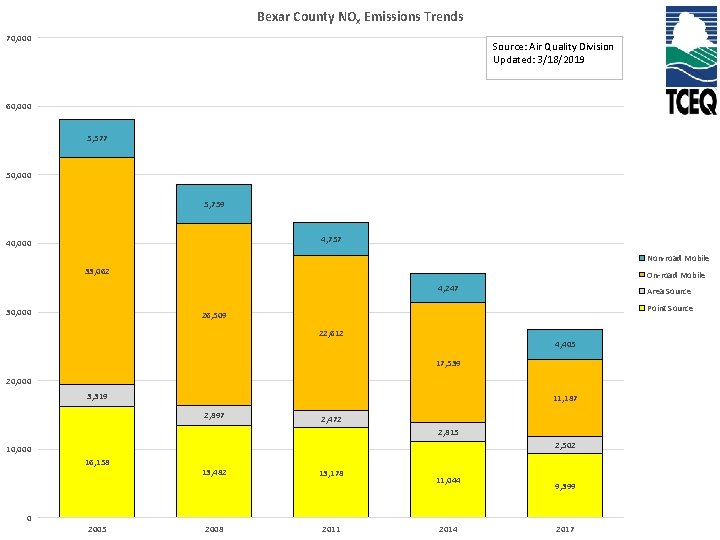
Bexar County NOx Emissions Trends 70, 000 Source: Air Quality Division Updated: 3/18/2019 60, 000 5, 577 50, 000 5, 759 4, 757 40, 000 Non-road Mobile 33, 062 On-road Mobile 4, 247 30, 000 Area Source Point Source 26, 509 22, 612 4, 405 17, 539 20, 000 3, 319 11, 187 2, 897 2, 472 2, 815 2, 502 10, 000 16, 158 0 2005 13, 482 2008 13, 178 2011 11, 044 2014 9, 399 2017
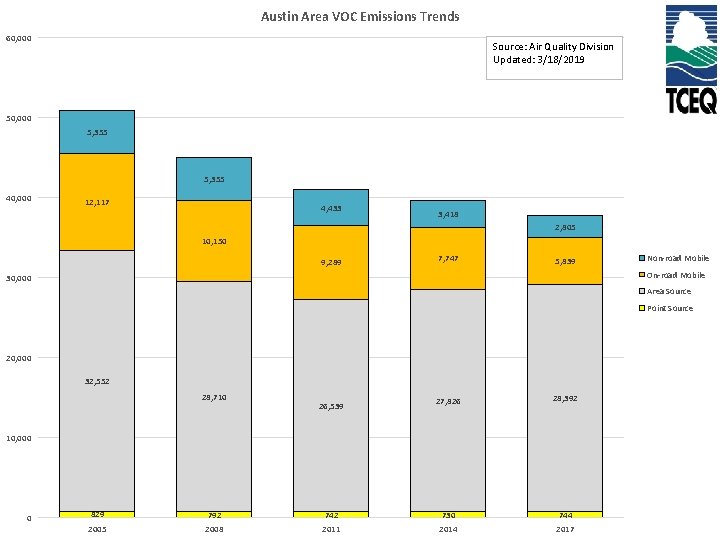
Austin Area VOC Emissions Trends 60, 000 Source: Air Quality Division Updated: 3/18/2019 50, 000 5, 355 40, 000 12, 117 4, 433 3, 418 2, 805 10, 150 9, 289 7, 747 5, 839 Non-road Mobile On-road Mobile 30, 000 Area Source Point Source 20, 000 32, 552 28, 710 26, 539 27, 826 28, 392 10, 000 0 829 792 742 730 744 2005 2008 2011 2014 2017
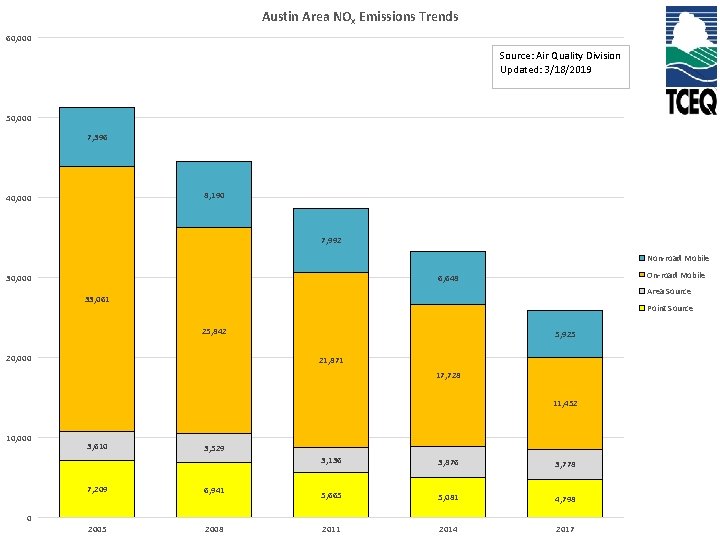
Austin Area NOx Emissions Trends 60, 000 Source: Air Quality Division Updated: 3/18/2019 50, 000 7, 396 8, 190 40, 000 7, 992 Non-road Mobile On-road Mobile 6, 648 30, 000 Area Source 33, 061 Point Source 25, 842 20, 000 5, 925 21, 871 17, 728 11, 452 10, 000 0 3, 610 3, 529 7, 209 6, 941 2005 2008 3, 136 3, 876 3, 778 5, 665 5, 081 4, 798 2011 2014 2017
Non-point and Mobile Source Emissions Contact Information Matthew Southard: (512) 239 -1046 Matthew. Southard@tceq. texas. gov Air Success Web Page: https: //www. tceq. texas. gov/airquality/airs uccess TCEQ Environmental Trade Fair and Conference • Emissions Inventories: An Overview • May 14, 2019 • Page 73