
Emirates and South Africa Fouad Caunhye Regional Manager

- Slides: 21
Emirates and South Africa Fouad Caunhye Regional Manager - Southern Africa © 2014 Emirates. All Rights Reserved.
About Emirates • • • #1 International carrier by RPKs In 2013/14 Emirates carried 44. 5 m passengers, up 13. 1% with a seat factor of 79. 7% 26 years of consecutive profits; US$887 m on revenues of US$22. 5 b in 2013/14 142 destinations in 80 countries Fleet of 217 wide-body aircraft, average fleet age 74 months Order book of over 375 Airbus and Boeing aircraft to meet network growth, replace existing fleet
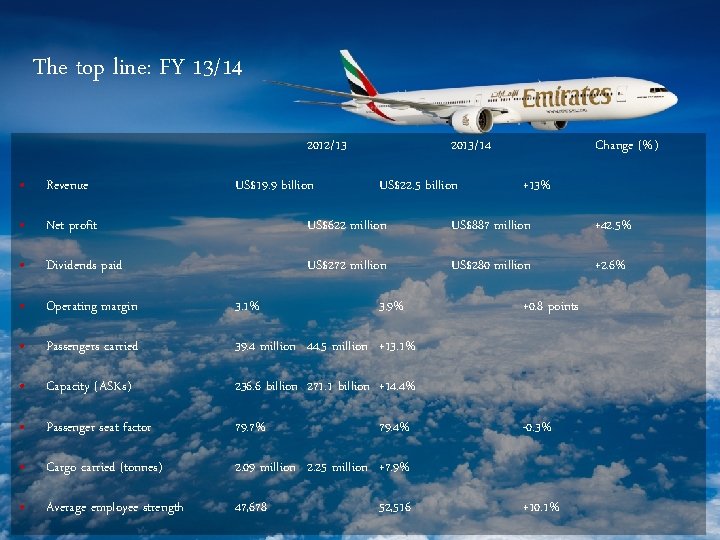
The top line: FY 13/14 2012/13 2013/14 Change (%) • Revenue • Net profit US$622 million US$887 million +42. 5% • Dividends paid US$272 million US$280 million +2. 6% • Operating margin 3. 1% • Passengers carried 39. 4 million 44. 5 million +13. 1% • Capacity (ASKs) 236. 6 billion 271. 1 billion +14. 4% • Passenger seat factor 79. 7% • Cargo carried (tonnes) 2. 09 million 2. 25 million +7. 9% • Average employee strength 47, 678 US$19. 9 billion US$22. 5 billion 3. 9% 79. 4% 52, 516 +13% +0. 8 points -0. 3% +10. 1%
Connecting the unconnected Accelerated growth – 25 destinations launched since January 2012 to all continents with a focus on world’s new city-pairs, 5 more in 2014
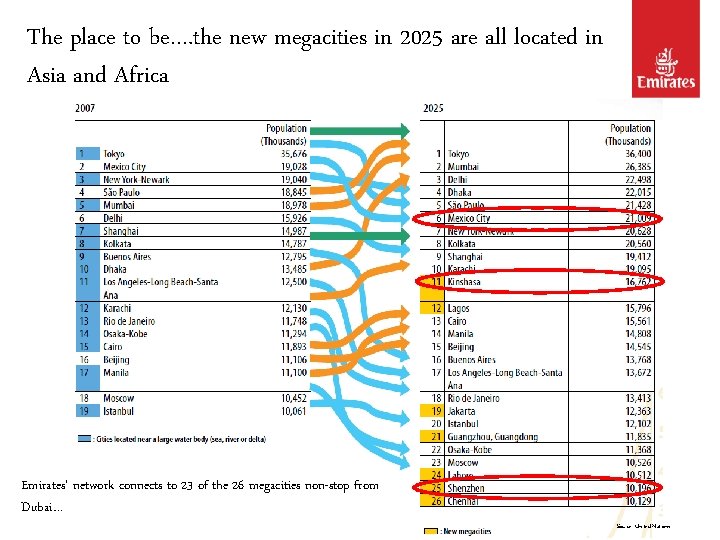
The place to be…. the new megacities in 2025 are all located in Asia and Africa Emirates’ network connects to 23 of the 26 megacities non-stop from Dubai… Source: United Nations
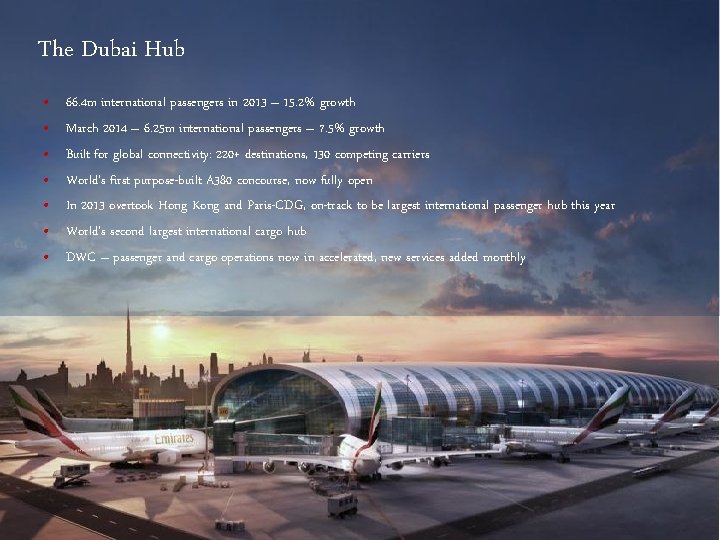
The Dubai Hub • • 66. 4 m international passengers in 2013 – 15. 2% growth March 2014 – 6. 25 m international passengers – 7. 5% growth Built for global connectivity: 220+ destinations, 130 competing carriers World’s first purpose-built A 380 concourse, now fully open In 2013 overtook Hong Kong and Paris-CDG, on-track to be largest international passenger hub this year World’s second largest international cargo hub DWC – passenger and cargo operations now in accelerated, new services added monthly
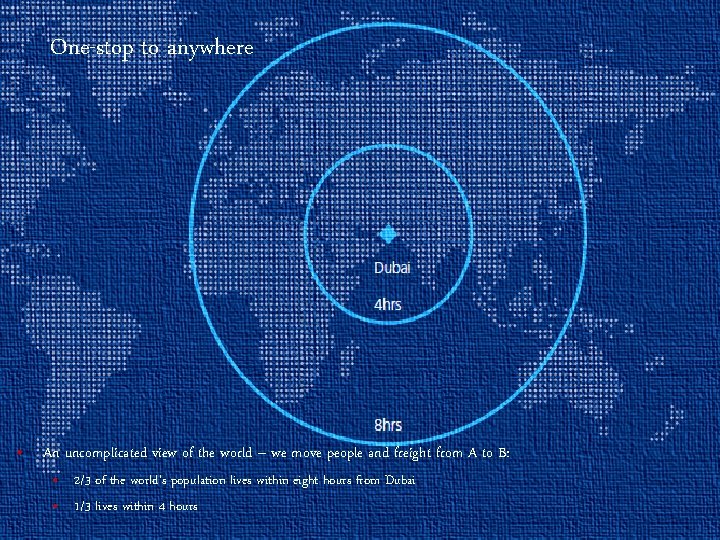
One-stop to anywhere • An uncomplicated view of the world – we move people and freight from A to B: • 2/3 of the world’s population lives within eight hours from Dubai • 1/3 lives within 4 hours
South Africa well positioned, but not immune from global challenges • Fuel costs • Infrastructure issues • Currency fluctuations • Patchy global economic recovery and consumer sentiment • Competition issues • ‘Green’ taxes • Protectionism + regulatory overreach
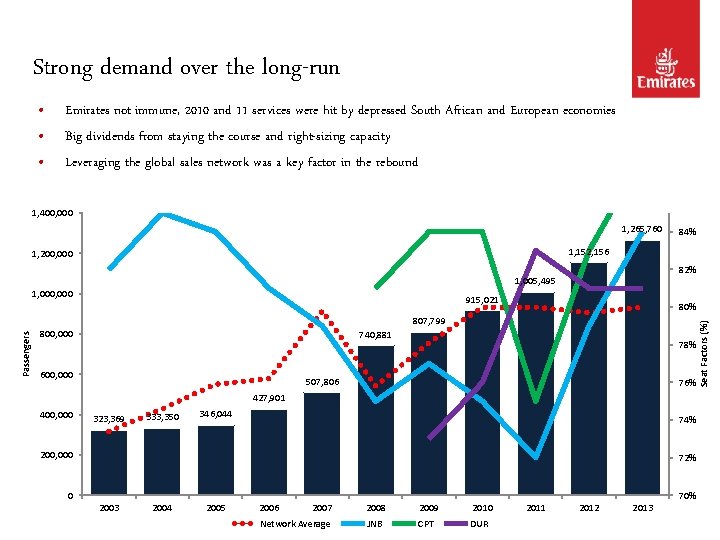
Emirates & South Africa • Emirates has carried over 5. 1 million passengers on its South African services over last 5 years • 42 flights per week, 3 destinations • 2013: • • • Passengers: A record 1. 27 million, +10% Seat Factor: 85%, out-performing EK network average of 79. 4% Cargo: 57, 500 tonnes, marginal contraction in-line with softness in widereconomy • Over 1, 000 South African employees globally • Vertically integrated investments: • • 50% stake in Wings Inflight Services at Johannesburg and Cape Town Airports Evolved in 2013 to dnata Newrest with expanded capabilities and operational reach spanning southern Africa
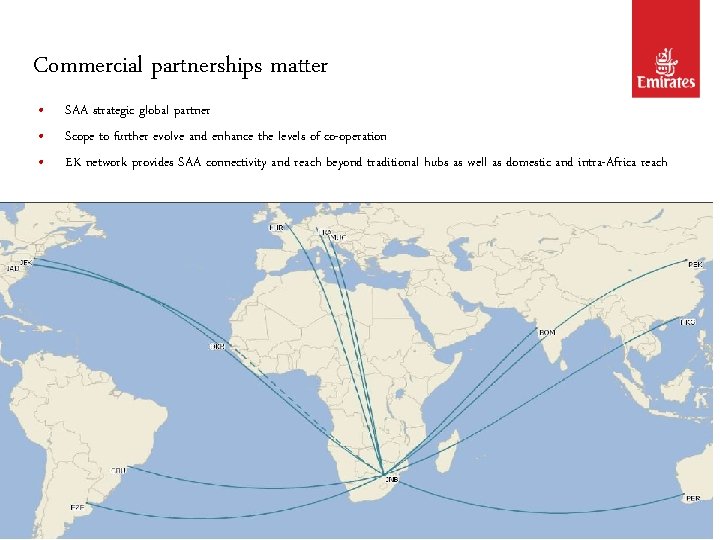
Commercial partnerships matter • • • SAA strategic global partner Scope to further evolve and enhance the levels of co-operation EK network provides SAA connectivity and reach beyond traditional hubs as well as domestic and intra-Africa reach
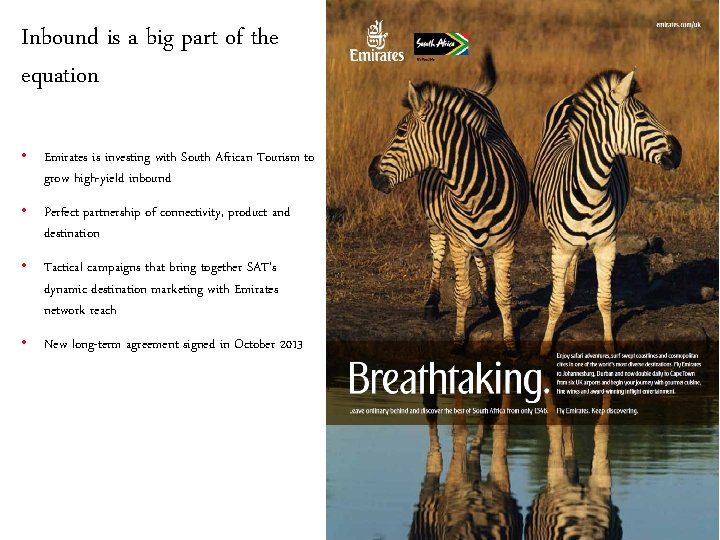
Inbound is a big part of the equation • Emirates is investing with South African Tourism to grow high-yield inbound • Perfect partnership of connectivity, product and destination • Tactical campaigns that bring together SAT’s dynamic destination marketing with Emirates network reach • New long-term agreement signed in October 2013
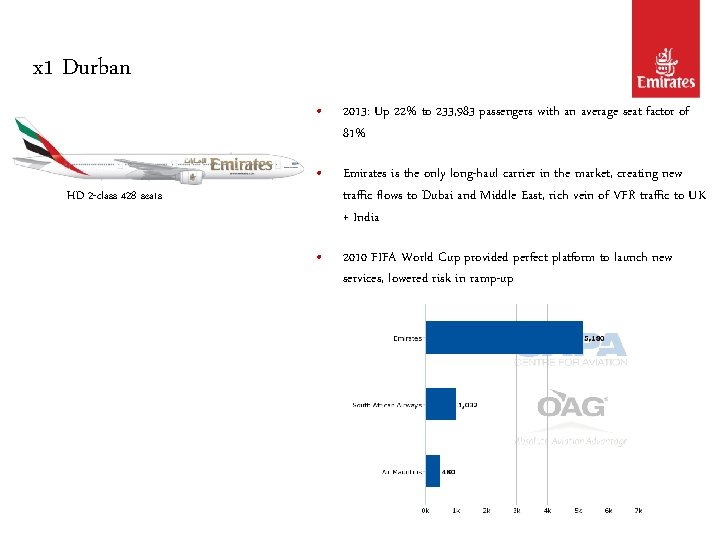
x 1 Durban HD 2 -class 428 seats • 2013: Up 22% to 233, 983 passengers with an average seat factor of 81% • Emirates is the only long-haul carrier in the market, creating new traffic flows to Dubai and Middle East, rich vein of VFR traffic to UK + India • 2010 FIFA World Cup provided perfect platform to launch new services, lowered risk in ramp-up
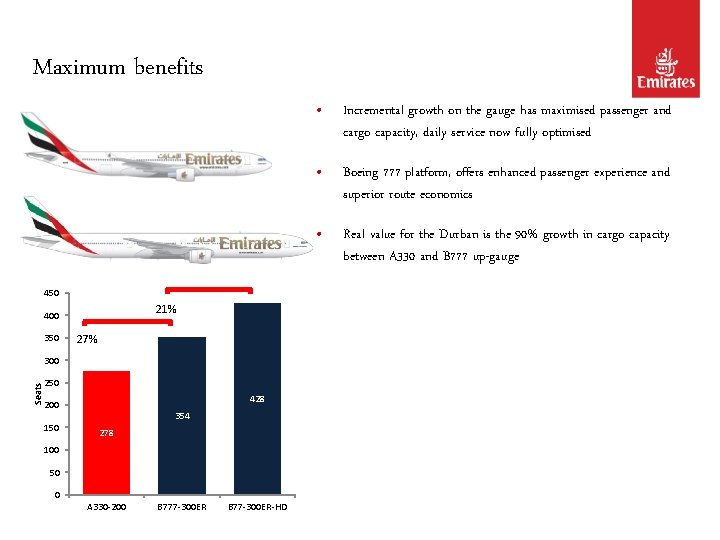
Maximum benefits 450 21% 400 350 27% Seats 300 250 428 200 150 354 278 100 50 0 A 330 -200 B 777 -300 ER B 77 -300 ER-HD • Incremental growth on the gauge has maximised passenger and cargo capacity, daily service now fully optimised • Boeing 777 platform, offers enhanced passenger experience and superior route economics • Real value for the Durban is the 90% growth in cargo capacity between A 330 and B 777 up-gauge
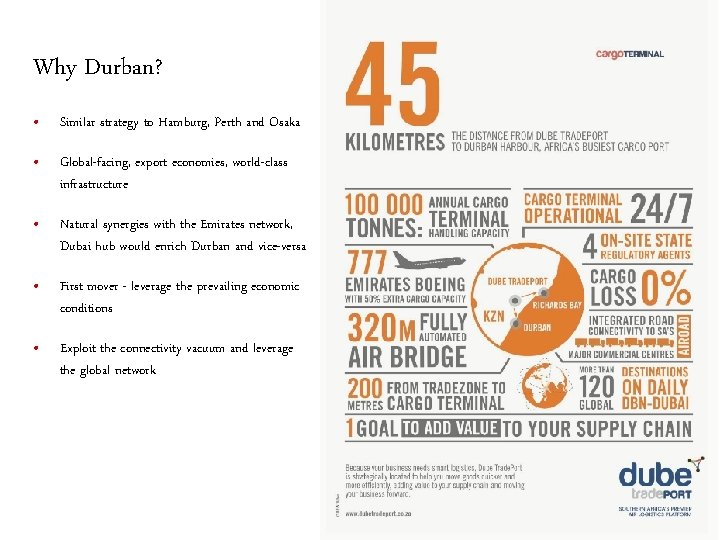
Why Durban? • Similar strategy to Hamburg, Perth and Osaka • Global-facing, export economies, world-class infrastructure • Natural synergies with the Emirates network, Dubai hub would enrich Durban and vice-versa • First mover - leverage the prevailing economic conditions • Exploit the connectivity vacuum and leverage the global network
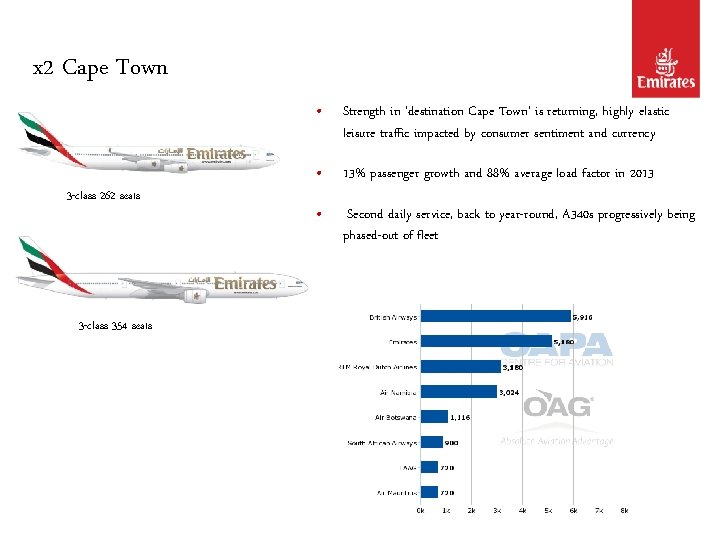
x 2 Cape Town 3 -class 262 seats 3 -class 354 seats • Strength in ‘destination Cape Town’ is returning, highly elastic leisure traffic impacted by consumer sentiment and currency • 13% passenger growth and 88% average load factor in 2013 • Second daily service, back to year-round, A 340 s progressively being phased-out of fleet
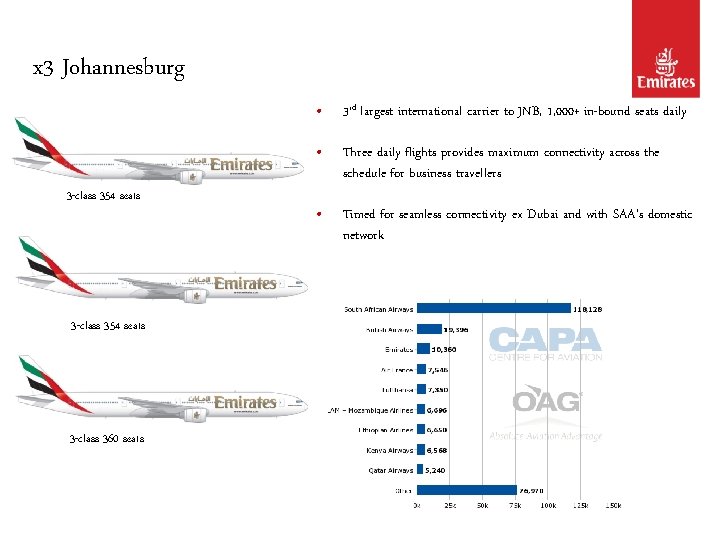
x 3 Johannesburg 3 -class 354 seats 3 -class 360 seats • 3 rd largest international carrier to JNB, 1, 000+ in-bound seats daily • Three daily flights provides maximum connectivity across the schedule for business travellers • Timed for seamless connectivity ex Dubai and with SAA’s domestic network
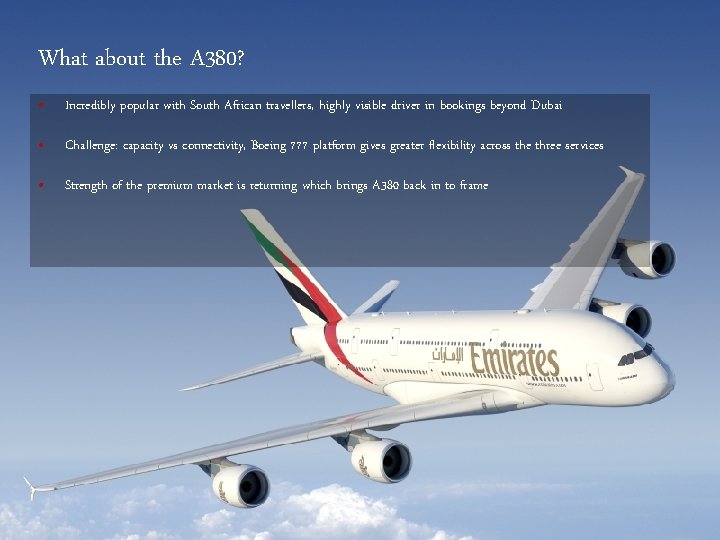
What about the A 380? • Incredibly popular with South African travellers, highly visible driver in bookings beyond Dubai • Challenge: capacity vs connectivity, Boeing 777 platform gives greater flexibility across the three services • Strength of the premium market is returning which brings A 380 back in to frame
Strong demand over the long-run • • • Emirates not immune, 2010 and 11 services were hit by depressed South African and European economies Big dividends from staying the course and right-sizing capacity Leveraging the global sales network was a key factor in the rebound 1, 400, 000 1, 265, 760 84% 1, 152, 156 1, 200, 000 82% 1, 005, 495 915, 021 80% Passengers 807, 799 800, 000 740, 881 600, 000 78% 507, 806 76% 427, 901 400, 000 323, 369 333, 350 346, 044 74% 200, 000 72% 0 70% 2003 2004 2005 2006 2007 Network Average 2008 2009 2010 JNB CPT DUR 2011 2012 2013 Seat Factors (%) 1, 000
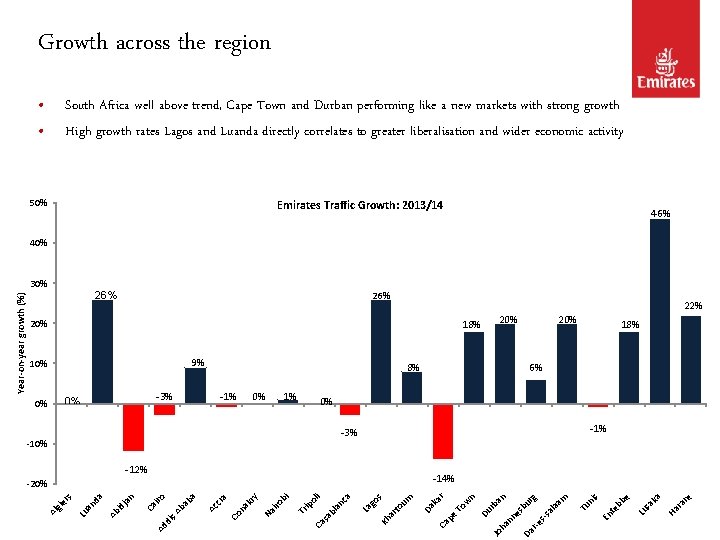
Growth across the region • • South Africa well above trend, Cape Town and Durban performing like a new markets with strong growth High growth rates Lagos and Luanda directly correlates to greater liberalisation and wider economic activity 50% Emirates Traffic Growth: 2013/14 46% 40% 26% 22% 20% 9% 10% 8% -3% -1% 0% -1% -3% -10% -12% re ra Ha ka Lu sa te bb e s En am s-s r-e es Da nn al a bu rg an rb Du Jo ha n pe To w ka Ca um s ar to go Kh La ca bl an i ol Ca sa Tr ip bi iro Na kr y Co na cr a Ac a ba b s. A iro di Ca Ad an Ab id j da an Lu rs r -14% -20% Tu ni 0% 18% 6% Da 0% 20% 18% Al gie Year-on-year growth (%) 30%
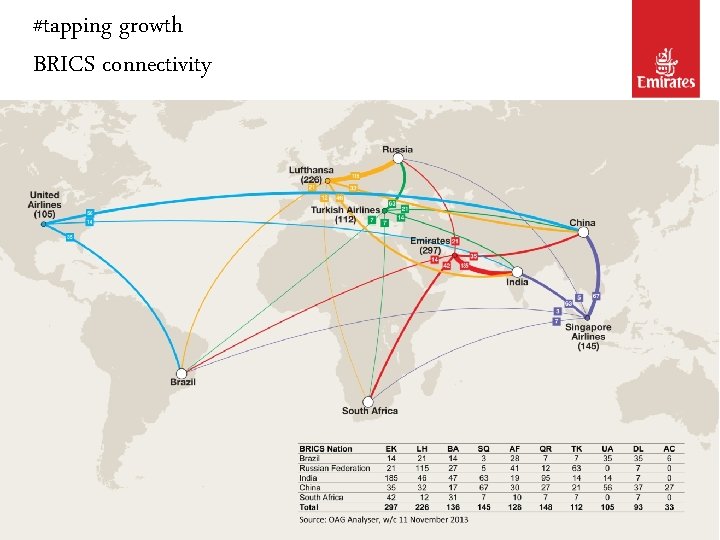
#tapping growth BRICS connectivity
Thank you….