Emigration behavior of resident and anadromous juvenile O

Emigration behavior of resident and anadromous juvenile O. mykiss: exploring the interaction among genetics, physiology and habitat Sean Hayes, Chad Hanson, Morgan Bond, Devon Pearse, Andrew Jones, Carlos Garza, Bruce Mac. Farlane
 • 23 km of stream accessible")
Scott Creek • Small watershed (75 km 2) • 23 km of stream accessible to anadromous fish • “native” resident fish above barriers • Small hatchery • Dynamic flow regime (28 m 3 s-1 to 0. 1 m 3 s-1) • Small Estuary (closes seasonally) Map: Rob Schick, NMFS

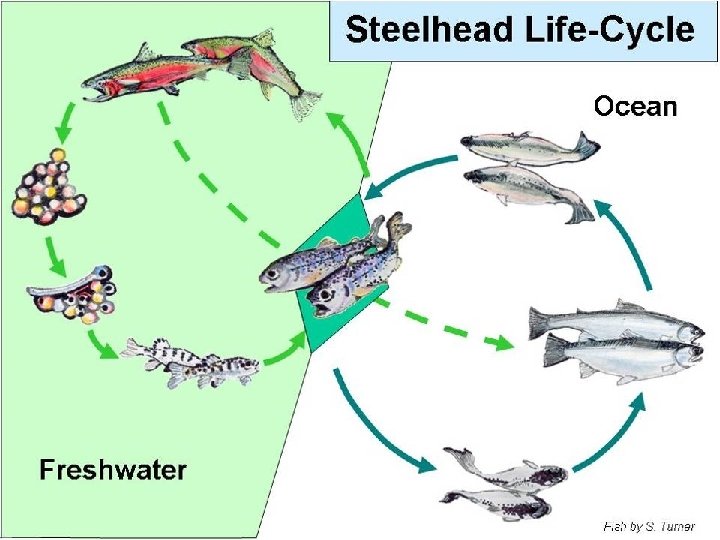
Scott Creek O. mykiss life history strategies Ocean upper watershed estuary/lagoon Upstream resident Mature in estuary (never enter ocean)

Scott Creek Instream PIT tag readers x x x Smolt trap 3 km X= barrier Adult weir Seine, hook & line, and electrofishing

Do rainbow trout and steelhead differ? Big Creek Above Big Creek, Boyer Scott Creek Above Mill Above Resident populations “diverged” >100 yrs ago 68 63 92 76 Big Creek Adults 60 Scott Creek Adults Hatchery Juveniles Weir Adults Lagoon Juveniles Neighbor-Joining distance tree, with bootstrap values for supported nodes

? x x x Proportion of fish assigned to Resident or Anadromous ancestry by habitat 100% 90% 80% 70% Anadromou 60% Resident 50% 40% 30% 20% 10% 0% Above Barrier Upstream Smolt trap Estuary
 Anadromous (n=209) 0. 20 0. 10 Fork length 27 0")
0. 30 Resident (n=128) Anadromous (n=209) 0. 20 0. 10 Fork length 27 0 25 0 23 0 21 0 19 0 17 0 15 0 13 0 11 0 90 70 0. 00 50 Frequency 0. 40 Genotype distribution in upper watershed

Emigration rate from above anadromy barrier • 400 fish PIT tagged above • 2. 3 % over the falls • 1. 8 % detected at smolt trap

+ Na + K -ATPase ? Physiology

+ Na + K -ATPase Physiology Upstream samples Resident Anadromous 6. 00 4. 00 2. 00 0 2 4 6 Month 8 10 Frequency ATPase 8. 00 12 Resident Anadromous 6 4 2 0 0 2 4 6 8 10 ATPase 12 14 16

Why do wild fish migrate at such small sizes? Typical steelhead smolt size distribution 0. 12 0. 08 0. 04 Fork Length (mm) 25 0 23 0 21 0 19 0 17 0 15 0 13 0 11 0 90 70 0 50 Frequency 0. 16
 Estuary- Open to Ocean (Jan.")
Does estuary serve as nursery habitat? (Morgan Bond’s thesis) Estuary- Open to Ocean (Jan. -June) Lagoon- Sand Bar Closed (July-Dec. )

Is the estuary a nursery? Black lines indicate upper watershed growth Blue lines indicate migration to estuary and growth Fork Length (mm) 250 200 Size threshold for ocean survival 150 100 Mean 5 th % 95 th % 50 0 Jan YOY Jul 1+ Jan Jul 2+ Jan Jul 3+ Jan Jul Jan 85% of returning adults use estuary pathway Ocean upper watershed estuary/lagoon
")
What happens when water quality degrades? >45% detected moving Upstream each fall (probably >90%) 3 km

Size of recaps at smolt trap in spring 20 18 16 Frequency 14 12 10 8 6 4 2 0 X 60 80 100 120 140 Upstream Estuary (previous summer) 160 180 200 Fork Length 220 240 260 280 300

A tale of two watersheds No estuary available Year 1 Year 2 (in Central California…) Year 3 Functional estuary present Year 1 Year 2 Year 3

Acknowledgements Funding • • NMFS DFG FRGP NURP California Sea Grant Land Owner support • Big Creek Lumber Company • The Wilson Family • Monterey Bay Salmon and Trout Project • Cal Poly Swanton Ranch • Lockheed Martin

Implications of resident trout studies • Should residents be counted in steelhead populations for delisting criteria? • Residents may become steelhead, but this probably happens at low frequencies • Results of resident contribution to anadromous breeding pending

Estuary Environmental Conditions “Lethal” levels

Influence of genotype on To seamigration or not to behavior sea? Genotype Frequencies 1 Frequency Resident 0. 8 Anadromous 0. 6 0. 4 0. 2 0 Upstream Smolt trap
 After 5 -6 months")
Steelhead in Scott Creek Typical spring downstream migrant (smolt? ) After 5 -6 months rearing in estuary 85% of returning adults use estuary pathway 100 mm
")
Probability of recapture Big smolts are less likely to stay < Fork Length (mm) at Trap

Conclusions Central Coast steelhead adapt for estuarine use Steelhead strategies without estuary • Longer upstream rearing • Fewer smolts, reduced anadromy?

Density-dependent Estuary Growth in Steelhead

Implications for Local Rivers • Larger river- may have more rearing capacity= larger smolts upstream • BUT… is there enough water? • Estuary issues – Breaching – Estuary size reduced? – Enough flow to connect with watershed?

Lagoon fish move upstream in the fall and then back down in spring >45% lagoon fish detected moving upstream

Early 20 th century spawning population was 4 -10 times larger Escapement ? ?
 Lots of food! Diet")
Why is estuary growth so good? (Jeff Harding’s diet studies) Lots of food! Diet consists of Corophium and Eogammarus sp.

But where does food come from? • • Upper watershed growth poor Insect diet Low flow Low light – low nutrient input into estuary
 enhances productivity (Alison Collins senior thesis)")
Hypothesis- Nutrient flow from marine derived nutrients (kelp) enhances productivity (Alison Collins senior thesis) Marine 13 C and 15 N from Juvenile Steelhead d 15 N (0/00) +/- SD 16 14 12 10 Juv. Steelhead - Lagoon Juv. Steelhead - Above Fall 8 Adult Steelhead 6 Coastal Marine Fish -26 Terrestrial -24 -22 -20 d 13 C (0/00) +/- SD -18 -16 -14 Marine

Why don’t all fish recruit to the estuary?
- Slides: 32