Embedded Application Performance Instrumentation aka Rational Application Performance
 Tom Bascom, White Star")
Embedded Application Performance Instrumentation (aka Rational Application Performance Investigation Details…) Tom Bascom, White Star Software Abstract: You can only make an application go faster by improving the parts that are slow. It doesn't help to optimize code that is already fast enough or that is only rarely used. User table stats, temp table usage stats and the application profiler can all be easily embedded in your application to provide powerful insight into exactly where performance problems are originating. In this session we will explore these 3 under-utilized Open. Edge features, explain why they are useful and how you can embed them into your own code base to focus your performance improvement activities on code that really is slow rather than wasting time trying to guess which bits aren't as fast as they could be! You will take home simple but powerful code samples that can be easily used with any Open. Edge environment: . NET GUI, Webspeed, App server, PASOE, Character, Batch or anything else! 1

Embedded Application Performance Instrumentation aka: Rational Application Performance Investigation Details Tom Bascom, White Star Software tom@wss. com

A Few Words about the Speaker • Tom Bascom: Progress user & roaming DBA since 1987 • Partner: White Star Software & DBAppraise, LLC – Expert consulting services related to all aspects of Progress and Open. Edge. – Remote database management service for Open. Edge. – Author of: – Simplifying the job of managing and monitoring the world’s best business applications. – tom@wss. com 3

Agenda • • • Why? The Profiler User Table and Index Statistics Temp Table Statistics What is This “Embedded” Nonsense?
 and MESSAGE? ? ? • Non-Repeatable • Subject to")
Why NOT just use ETIME() and MESSAGE? ? ? • Non-Repeatable • Subject to a host of external factors – CPU speed, disk throughput, virtualization, contention from other user activity, buffer cache efficiency, phase of the moon • • Granularity is too gross (only millisecond timings) You have to guess the right target code to measure You have to write a lot of custom logging code Coding in your production environment is a BAD idea

Why? Target the largest response time component of the most important Business process first. The performance enhancement possible with a given improvement is limited by the fraction of the execution time that the improved feature is used. -- Amdahl’s Law The Ultimate KPI is User Experience no amount of charts and graphs showing how well your system is performing matter if the users are not happy.

The Profiler

The Profiler • Microsecond timings of actual code execution time! – Does not include waiting for IO (disk IO, sockets, UPDATE, PAUSE etc statements…) – Covers ALL of the code! • First introduced with version 8. 2 (-zprofile) • Greatly Improved with version 9. 0 (profiler: handle) • “Unsupported” is a myth (“lightly documented” is not a myth) • The profiling capability *is* supported, the example GUI tool to evaluate the results was not. That tool is also completely unnecessary eye candy.

Unsupported Profiling Eye Candy

New PDSOE Eye Candy
")
Using the Profiler • -profile startup parameter – Non-intrusive – Non-selective (all or nothing) – Must end session cleanly – no aborts or kills! • profiler: handle – Selective – Can turn it on or off at will – Can flush the data when you want to – But requires code insertion or tooling of some sort

Minimal Embedded Usage assign profiler: enabled = yes profiler: profiling = yes. /* enable the profiler */ do i = 1 to 1000000: end. /* some code to be profiled! */ assign profiler: enabled = no profiler: profiling = no. /* disable the profiler */ profiler: write-data(). /* create the output file */

PROFILER Attributes • • • DESCRIPTION – optional text describing this session LISTINGS – whether or not to create debug listings DIRECTORY – where to create debug listings (default to –T) FILE-NAME – name of output file (default profile. out) ENABLED – yes/no; initializes listings and so forth PROFILING – turn profiling on or off

Other PROFILER Attributes • TRACE-FILTER – CSV list of “matches” criteria for procedure tracing • TRACING – line level tracing • COVERAGE - % coverage support
 – flush accumulated data to output file. • User-Data(char) –")
PROFILER Methods • Write-Data() – flush accumulated data to output file. • User-Data(char) – write user defined data, such as VST statistics, to the output file.

Profiling an Entire Session • Create file called profiler. cfg with 3 lines: -OUTFILE /tmp/profiler. out -LISTINGS /tmp -DESCRIBE some. Description • Add –profile to session startup: mpro db. Name –p start. p –profiler. cfg • Run normally. • Terminate cleanly & analyze the output. • Multiple gigabytes of data may be generated very quickly!!!

Profiler Tooling zprof_on. p - initializes profiling zprof_off. p - ends profiling and writes the oputput file zprof_topx. p - produces a report on the results zprof_flush. p - flushes profiling output, this is optional but necessary if your program does not terminate cleanly zprof_check. p - checks for a basename. zprof "flag" file and starts profiling if it exists, stops profiling if it does not to use: run lib/zprof_on. p ( "base. Name", "description", no ). run interesting. Stuff. p run lib/zprof_off. p. This will create a single basename*. prf file that can be loaded into a profiler analysis tool such as zprof_topx. p proenv> pro –p lib/zprof_topx. p -param tmp/basename. 2016. 12. 18. 11. 12. 14

Sample Profiling Output ┌─────────────────────── Profiler: Top 20 Results ────────────────┐ │ Description: Pro. Top 3 Execution Profile [00: 23│ [ │ Session Total Execution Time 00: 06│ │ Line 0 = initialization, line -1 = cleanup│ ┘────────────────────────────────────────────────────└ ┌───────────────────── Top 20 Lines: Total Execution Time ─────────────┐ │Program/Class Line Time Avg Time Calls Internal Procedure/Method │ │─────────────── ───────────── │ │ dc/dashboard. p 3105 3. 702797 0. 000001 4000004 mon-update│ │ dc/dashboard. p 0 2. 097173 0. 524293 4 mon-update│ │ dc/dashboard. p 3106 0. 497054 0. 000000 4000000 mon-update│ │ dc/dashboard. p 3087 0. 393956 0. 004061 97 mon-update│ │lib/dynscreen. p 1238 0. 025957 0. 006489 4 dyn. Screen. Update│ │ ssg/sausage 00. p 1949 0. 024891 0. 000007 3472 data. Set 2 JSON│ │lib/dynscreen. p 936 0. 021612 0. 000027 800 dyn. Viewer. Update│ │ ssg/sausage 00. p 1752 0. 020572 0. 000007 3084 scan. Data. Set│ │ssg/sausage 00. p 1920 0. 019844 0. 000005 4252 data. Set 2 JSON│ ┘────────────────────────────────────────────────────└

DEBUG Listing 3101 if pt_bogomips > 0 /* and bogo. Loop > 1 */ then 3102 do: 3103 3104 estart = etime. 3105 do i = 1 to pt_bogomips: /* 100, 000 should take 20 ms to 30 ms on c. 2010 HW */ 3106 end. 3107 3108 tt_Dashboard. bogo. MIPS = ( 1000 / ( etime - estart )) * ( pt_bogomips / 1000000. ( 3109 3110 if tt_Dashboard. bogo. MIPS > 0 and tt_Dashboard. bogo. MIPS <> ? then 3111 do: 3112 max. Bogo = max( max. Bogo, tt_Dashboard. bogo. MIPS ). 3113 tt_Dashboard. bogo. Mip. Pct = ( tt_Dashboard. bogo. MIPS / max. Bogo ) * 100. 3114 end. 3115 3116 end.

About Line Numbers • Many tools use DEBUG LIST line numbers. • This listing expands all include files and pre-processor statements. • COMPILE “program. p” DEBUG-LIST “program. dbg”. • Line numbers can vary if things have changed since code was deployed! – It is helpful to create and deploy. dbg files whenever you create and deploy r-code


Caveat! define variable i as integer no-undo. assign profiler: enabled = yes profiler: profiling = yes. do i = 1 to 1000000: end. i = 0. do while i < 1000000: i = i + 1. end. assign profiler: enabled = no profiler: profiling = no. profiler: write-data().

Caveat! 1. 2. 0. 0 2 2 2 2. . 02/28/2007 "Generic" 07: 55: 03 "tom" "profile. p" "" 63126 0 2 1 0. 000000 30. 935828 11 1 0. 000002 8 1000001 4. 607678 9 1000000 1. 719586 14 1000000 1. 501487 12 1000001 3. 013981 13 1000000 3. 032433 16 1 0. 000003 Note 1: There are 2 formats – the 1 st character specifies the version Note 2: The input file is in “dot-d format”, a “. ” on a line causes a 4 GL LEAVE.

User Table and Index Statistics

User Table and Index Statistics • Aggregate Table and Index stats were introduced in 8. 3 • That was such a great feature that user level stats were introduced in OE 10! • Now you can see how much of your database activity is from a given user. • This is run-time behavior – not static, compile time analysis of index selection; IOW, what really happens vs what “should” happen.

Enabling User Table and Index Statistics -basetable default = 1 -baseindex default = 1 -tablerangesize default = 50 select count(*) from _file -indexrangesize default = 50 select count(*) from _index Metaschema and VST tables have negative _file-num, SYS* start after 32000 – User tables are generally from 1 to 10000. Index _idx-num has no pattern.

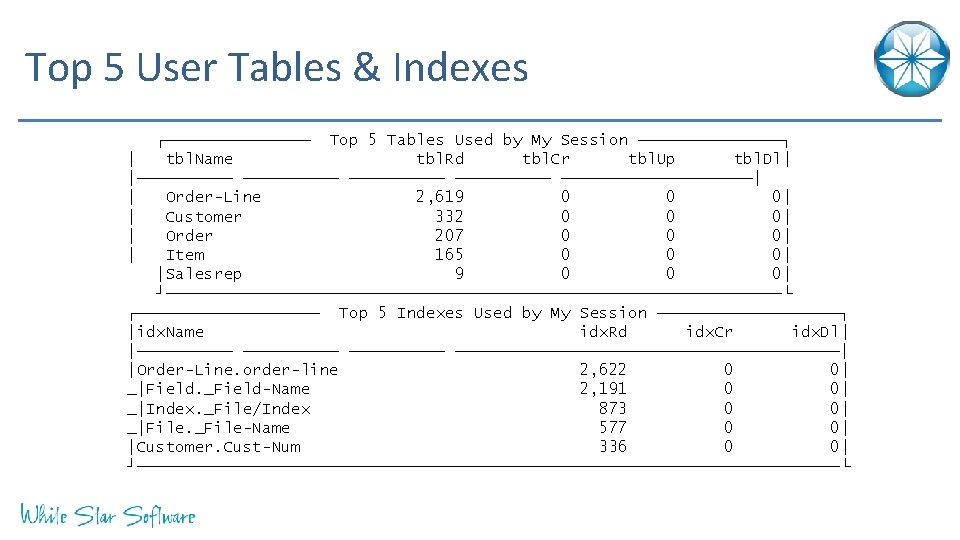
Gathering User Table & Index Statistics run lib/usertablestats. p persistent. for each dictdb. order no-lock: end. {lib/userstats. i} run get. UStats ( output table tt_usr. Tbl. Info by-reference, output table tt_usr. Idx. Info by-reference ). for each tt_usr. Tbl. Info by tt_usr. Tbl. Info. tbl. Rd descending: display tbl. Name tbl. Rd tbl. Cr tbl. Up tbl. Dl with 5 down. end. for each tt_usr. Idx. Info by tt_usr. Idx. Info. idx. Rd descending: display idx. Name idx. Rd idx. Cr idx. Dl with 5 down. end.

Caution • BLOB and CLOB field activity is misreported! • It will be recorded as activity on tables that have the same “table Id” as the “LOB Id” (will be fixed in OE 12). • Memory use: (-n + -Mn + 1) * tablerangesize * 32 (-n + -Mn + 1) * indexrangesize * 40

Temp Table Statistics

Temp Table Statistics • The trend is very clear – applications are increasing TT usage! • Temp-tables and Pro. Data. Sets are vital components of modern applications • Programmers have very little insight into how the temp tables in their code are behaving • Temp Table Statistics were introduced in OE 11

Progress. Database. Temp. Table. Info • • Archive. Index. Statistics Archive. Table. Statistics Temp. Table. Count Temp. Table. Peak • • -ttbaseindex 1 -ttbasetable 1 -ttindexrangesize 1000 -tttablerangesize 1000 • Get. Table. Info. By. Position() • Get. Table. Info. By. ID() • Get. Table. Stat. History. Handle() • Get. Index. Info. By. ID() • Get. Index. Stat. History. Handle() • Get. VSTHandle() “Id” is what you need to link things together!

Aggregate Temp-Table Info ┌────────────── Temp-Table Info ──────────────┐ │ │ home/pt 3 dev/tmp/DBI-9950762889 q 2 d 8 B│ │ │ 1048576 DBI File Size 84 current temp-tables│ │ 1 KB TT DB Block Size 5 archived│ 1288 │ TT DB Total Blocks 125 peak│ 193 │ TT DB Empty Blocks 275 tt indexes│ 2 │ TT DB Free Blocks 1669 total current records│ 0 │ TT DB RM Free Blocks 109831 total current bytes│ │ 99. 53% tt hit ratio │ │ │ 3225 │ tt rec create│ 34660 │ tt rec read│ 3032 │ tt rec update│ 85 │ tt rec delete│ 96186 │ tt rec log rd│ 453 │ tt rec os rd│ 1046 │ tt rec os wr│ 5376 │ tt TRX│ 64 │ tt Undos│ │ ─────────────────────────────────── │ > │ OK> <Help│ < ┘────────────────────────────────────└ │ / │

Detailed Temp-Table Info TT Name ─────────────── tt_tbl. xid-idx Procedure Name Bytes Records Create Read Update Del OSRd ──────── ─────── ──── protop. p 5863 184 17145 9 3 protop. p 185 17801 tt_idx. xid-idx protop. p tt_screen. Element lib/dynscreen. p tt_screen. Element. scr. Frame lib/dynscreen. p tt_screen. Element. el. Nm_fr. Nm_el. H lib/dynscreen. p tt_browse. Column. List. brw. Col tt_browse. Column. List. brw. Hdl lib/dynscreen. p 10650 201 202 416 744 32 4 34254 408 418 825 1409 407 165 34 2701 65 65 65 102 989 468 734 37 4

Embedded Nonsense

Embedding Instrumentation • • Do not disturb the user! Make it easy to enable or disable remotely and IN PRODUCTION Gather detailed data only when you need it. Simple and immediately useful output.

Embedding in a “Headless” Process output stream out. Strm to value( flg. File. Name ). do while true: file-info: file-name = flg. File. Name. if file-info: full-pathname = ? then leave. /* check (frequently). . . /* if the flag disappears then gracefully exit file-info: file-name = dbg. File. Name. if file-info: full-pathname <> ? And ( file-info: file-mod-date <> dbg. Chg. Date or file-info: file-mod-time <> dbg. Chg. Time ) then do: dbg. Chg. Date = file-info: file-mod-date. /* remember when we last looked! dbg. Chg. Time = file-info: file-mod-time. input stream in. Strm from value( file-info: full-pathname ). import stream in. Strm dbg. Mode. /* read the new value of “dbg. Mode” input stream in. Strm close. if dbg. Mode = “profiler” then run lib/zprof_on. p. end. /* do the work… */ end. */ */

Embedding in a “Headless” Process do while true: run lib/zprof_check( "base. Name", "description", yes ). run interesting. Stuff. p pause 10 no-message. end. /* This approach allows you to enable and disable profiling externally -- just create base. Name. zprof to * enable profiling and remove it to disable profiling. with the z. Flush flag set to "yes" each iteration * of the loop will create a basename. YY. MM. DD. HH. MM. SS. prf output file. */

Embedding in a “Headless” Process /* zprof_check. p -- simple stand-alone non-persistent profiler control * * run lib/zprof_check. p ( "base. Name", "description", z. Flush ). * * check for base. Name. zprof in session: temp-directory -- if it exists * start profiling, if it does not then end profiling * if base. Name is blank or unknown then check for "zprof” /* flagfile = ( if z. Base. Name = "" or z. Base. Name = ? then "zprof” else z. Base. Name ). file-info: file-name = session: temp-directory + "/" + flag. File + ". zprof". if file-info: full-pathname = ? then run lib/zprof_off. p. else run lib/zprof_on. p ( z. Base. Name, z. Description, z. Flush ).

Resources! • All provided as part of Profiler: lib/zprof*. p TT Stats: lib/ttinfo. p User Stats: lib/usertablestats. p http: //protop. wss. com use the “y” command (lower case) use the “ 0” command (zero) use the “Y” command (upper case) • Cool Kids: – https: //github. com/consultingwerk/Table. Statistics

Questions? 43

Thank You! 44


Demo!

<Escape>-P Profiler Tool • Dynamically capture line by line execution time at the point where issues occur. • Send output to a user-defined destination. • <Esc>P to configure and enable. (Don’t forget “Yes”. ) • <Esc>P again to complete the capture and disable.

Profiler Example A Calculation Bottleneck? 1 1 p = 4 * ( 1 - --- + ---. . . ) 3 5 7 9

Profiler Example A Calculation Bottleneck? function piterm returns decimal ( input n as integer ). return ( 1. 0 / (( n * 2 ) + 1 )). end. do while abs( newpi - oldpi ) > precision: oldpi = newpi. i = i + 1. if i modulo 2 = 0 then pi = pi + piterm( i ). else pi = pi - piterm( i ). newpi = ( 4. 0 * pi ). display newpi oldpi. end.
- Slides: 47