Elephant distribution and habitat preferences in the Western

Elephant distribution and habitat preferences in the Western Ghats of Karnataka from the available direct and indirect evidences PRESENTED BY: DR. CHITTARANJAN DAVE AND SHIVAM TRIVEDI
 §African elephant (Loxodonta)")
Elephants - Elephantidea Two species §Asian elephant (Elepha maximus) §African elephant (Loxodonta)
 § 28000 - 30000")
Asian elephants – An introduction §India has largest population (60%) § 28000 - 30000 (2012 census data) Foothills of Himalayas (1700) North Eastern states (9000 -9500) §Range shrunk from 9 to 4. 9 million km 2 §In India elephant range area - 110000 km 2 §Schedule – 1 in WPA and endangered – IUCN § 28+2 elephant reserves East central India (2650) Andaman Islands (40) Western and Eastern Ghats (14000)

Asian elephants - Habitat §Dependant on the wetter mixed deciduous and semi-evergreen forest Gray, T. N. , & Phan, C. (2011) §Waterbodies important habitat and elephants use habitats close to permanent waterbody Sukumar, R. (1989) and Gaugris, J. Y. , & Van Rooyen, M. W. (2010) §High human density area and surrounds also preferred Garcia, C. A. , Bhagwat, S. A. , Ghazoul, J. , Nath, C. D. , Nanaya, K. M. , Kushalappa, C. G. , . . . & Vaast, P. (2010)
 §Habitat fragmentation/ loss §Infrastructure")
Asian elephants - Threats §Linear developments (roads and rail lines) §Habitat fragmentation/ loss §Infrastructure development §Illegal capture of calves §Ivory poaching Baskaran, N. , Varma, S. , Sar, C. K. , & Sukumar, R. (2011) and Singh, A. P. , & Sharma, R. C. (2001)

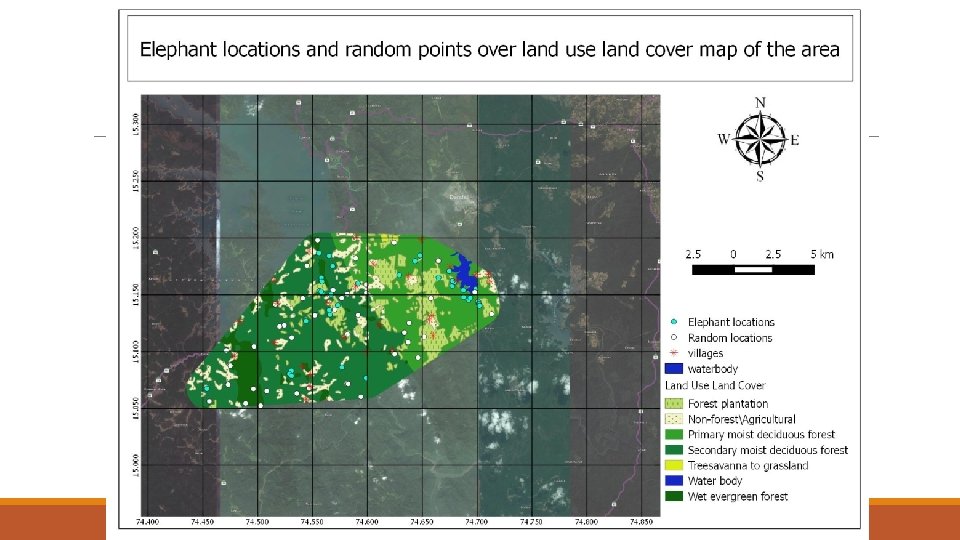
Objectives §Whether elephants are randomly distributed in the area §Which vegetation type is intensively used by elephants? §Whether elephant distribution has any effect of factors like habitation, roads, waterbodies and fire §If yes then which parameter has overriding effect on elephant distribution?
")
Datasets ØSecondary data §Elephant location §LULC of study area §Fire data (2008 to 2010) §SRTM data for elevation ØDigitized data §Roads §Habitation (villages)

Methodology Elephant data – QGIS - Projection Generate random points in AOI Export/ add geometry tool – Area of each veg. class NN method – Avg. dist b/w 2 elephants Point in polygon function – no. of elephants in each veg. class Field calculator – Density of observed and expected elephant occurrence MCP – Individual elephant location Buffer – Avg. distance b/w elephants Clip vegetation map using AOI Load vegetation map XY tool – Export both occurrence – Elephant distribution pattern Statistical analysis – Chi sq. test

Methodology Load Bing map layer Create shapefile – Village location and road map Projection Statistical analysis – Paired t-test assuming unequal variance Fire data (2008, 09, 10) – Merge shapefiles Calculate min. dist. of random points from fire, road, villages and water Add waterbodies – Intersect with AOI Calculate min. dist. of elephants from fire, road, water and villages


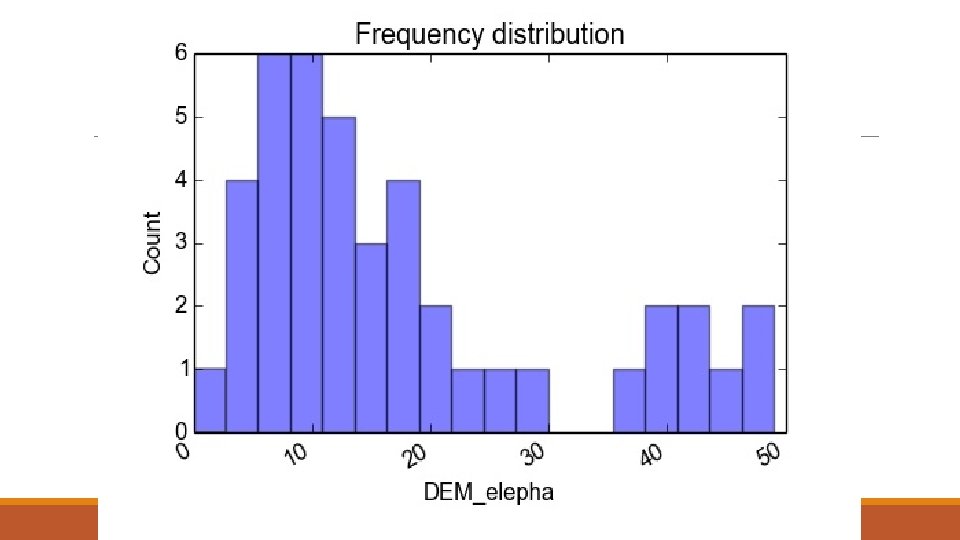
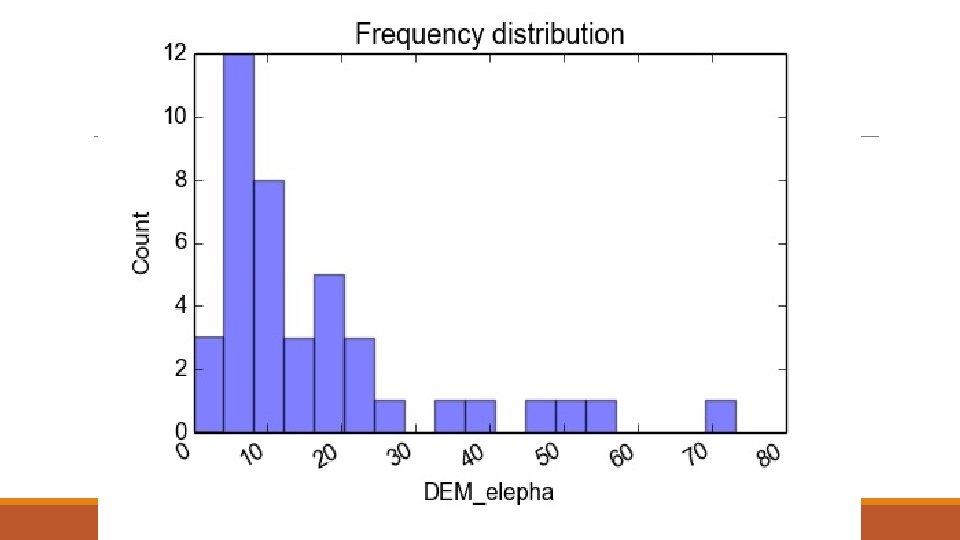

Elephants response to Terrain Ruggedness Index Elephant location Random points


Elephants using different vegetation types Sr. no. Landuse type Observed Random Total 1 Non-forestAgricultural Wet evergreen secondary or disturbed forest 1 3 4 2 5 7 Forest plantation Secondary moist deciduous forest Primary moist deciduous forest and degradation 9 4 13 13 21 34 16 8 24 2 3 4 5 6 0 0 7 Wet evergreen primary forest Treesavanna to grassland in dry zone 0 0 8 Water body 0 0 Chi square test P > 0. 05

How elephants are responding…… Sr. no. 1 2 Test type Fire Waterbody Village Roads t Stat P(T<=t) two-tail (assuming unequal variance) -0. 13556 -2. 18024 -2. 069024668 -3. 36764 0. 892514 0. 032178 0. 042185518 0. 001192 Mean distance (m) from elephant location to various parameters Sr. no. Analysis type Fire Water Road Village 1 Mean 1645. 03 7006. 69 889. 03 1559. 01 2 Standard Error +144. 29 +715. 02 +163. 78 +135. 82

Conclusion §Elephants are not randomly distributed and have a pattern of habitat preference §They seem to occur largely in primary moist deciduous and forest plantation §Elephants respond to the presence of waterbody, village and roads but not to fire locations or burnt areas. §Waterbody and terrain ruggedness along with vegetation type explains the current distribution pattern in the study area.

Thank You….
- Slides: 21