ELEMENTARY BOUNDARY REVIEW Process and Preliminary Data Phase

ELEMENTARY BOUNDARY REVIEW Process and Preliminary Data Phase One
 � Building Capacity Calculations � Current Elementary Boundary")
Process � New Residential Developments (six) � Building Capacity Calculations � Current Elementary Boundary Maps � Student Data Files � Building Contact Information

Estimates for Growth – No Development

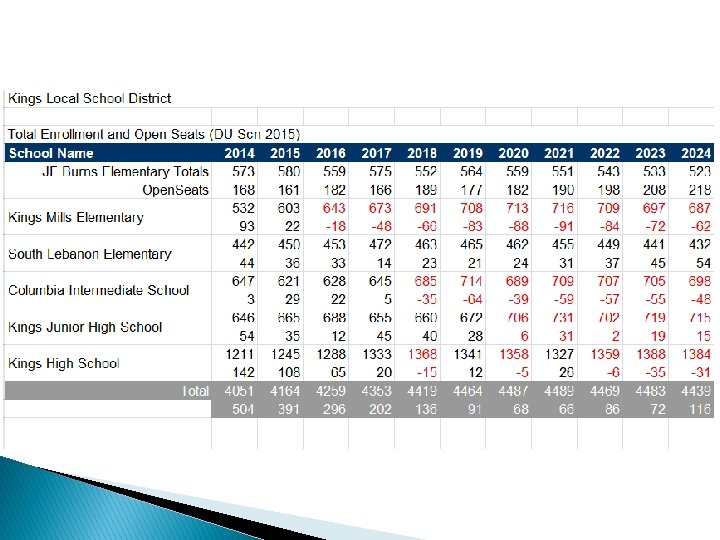
JF Burns Elementary Grade 2011 2012 2013 2014 2015 2016 2017 2018 2019 2020 2021 2022 2023 2024 143 105 138 111 119 117 116 113 111 109 107 105 103 1 113 132 97 136 102 109 108 107 104 102 100 98 97 2 136 114 128 95 135 101 109 107 106 104 102 100 98 3 120 133 103 130 93 132 99 106 105 103 101 99 4 115 119 134 101 129 92 131 98 106 105 105 103 101 Totals: 627 603 600 573 578 551 562 533 538 532 525 517 507 497 -3. 8% -0. 5% -4. 5% 0. 9% -4. 6% 1. 9% -5. 1% 0. 8% -1. 3% -1. 6% -2% 741 741 741 741 114 138 141 168 163 190 179 208 203 209 216 224 234 244 K Pct Chg: Capacity: Open Seats:

Kings Mills Elementary Grade 2011 2012 2013 2014 2015 2016 2017 2018 2019 2020 2021 2022 2023 2024 121 109 122 114 121 120 119 117 115 113 111 108 106 1 96 104 109 112 111 118 117 117 115 112 110 108 106 2 94 90 107 109 112 110 118 117 117 114 112 110 108 3 104 107 96 103 116 114 122 119 119 116 114 112 4 105 109 105 94 104 117 115 122 119 119 117 114 Totals: 520 519 532 560 578 585 590 592 584 577 569 558 547 -0. 2% 3. 9% -1. 3% 5. 2% 3. 3% 1. 2% 0. 8% 0. 3% -1. 2% -1. 5% -1. 9% K Pct Chg: Capacity: 625 625 625 625 Open Seats: 105 106 86 93 65 47 40 35 33 41 48 56 67 78

South Lebanon Elementary Grade 2011 2012 2013 2014 2015 2016 2017 2018 2019 2020 2021 2022 2023 2024 72 80 97 94 96 97 97 97 96 94 92 90 88 87 1 81 74 74 100 87 89 90 91 91 89 87 86 84 82 2 88 83 83 76 103 89 92 93 92 92 90 88 87 85 3 77 84 84 89 75 102 89 91 92 92 92 90 88 87 4 84 78 86 83 89 74 102 88 91 92 92 92 90 88 Totals: 402 399 424 442 449 452 470 462 459 453 446 437 429 -0. 7% 6. 3% 4. 2% 1. 6% 0. 6% 4% -2% 0. 4% -0. 7% -1. 3% -1. 6% -2% K Pct Chg: Capacity: 486 486 486 486 Open Seats: 84 87 62 44 37 34 16 26 24 27 33 40 49 57

Columbia Intermediate School Grade 2011 2012 2013 2014 2015 2016 2017 2018 2019 2020 2021 2022 2023 2024 5 299 306 317 322 276 319 279 351 302 320 318 316 310 6 311 307 313 325 329 282 326 285 355 305 323 321 319 Totals: 610 613 630 647 606 601 605 636 656 624 641 637 636 629 0. 5% 2. 8% 2. 7% -6. 4% -0. 8% 0. 7% 5. 1% 3. 1% -4. 9% 2. 6% -0. 2% -1% Pct Chg: Capacity: 650 650 650 650 Open Seats: 40 37 20 3 44 49 45 14 -6 26 9 13 14 21

Kings Junior High School Grade 2011 2012 2013 2014 2015 2016 2017 2018 2019 2020 2021 2022 2023 2024 7 304 307 316 322 329 334 286 330 287 357 307 325 323 321 8 305 309 304 324 331 335 287 331 288 358 307 326 324 Totals: 609 616 620 646 653 665 621 617 619 645 665 632 649 645 1. 1% 0. 6% 4. 2% 1. 1% 1. 8% -6. 6% -0. 6% 0. 2% 4. 3% 3% -4. 8% 2. 6% -0. 6% Pct Chg: Capacity: 700 700 700 700 Open Seats: 91 84 80 54 47 35 79 83 81 55 35 68 51 55

Kings High School Grade 2011 2012 2013 2014 2015 2016 2017 2018 2019 2020 2021 2022 2023 2024 9 309 313 306 321 331 337 343 293 339 294 366 313 333 10 302 313 315 314 324 335 342 343 293 339 295 366 314 11 279 275 284 289 298 309 315 316 270 312 272 337 12 226 272 264 292 280 286 295 304 305 310 311 266 308 268 Totals: 1116 1173 1169 1211 1224 1250 1277 1298 1257 1258 1214 1239 1260 1251 5. 1% -0. 3% 3. 6% 1. 1% 2. 1% 1. 6% -3. 2% 0. 2% -3. 6% 2. 1% 1. 7% -0. 7% Pct Chg: Capacity: 1353 1353 1353 1353 Open Seats: 237 180 184 142 129 103 76 55 96 95 139 114 93 102

District Totals Grade K 2011 2012 2013 2014 2015 2016 2017 2018 2019 2020 2021 2022 2023 2024 336 294 357 319 336 334 332 326 320 314 308 301 296 1 290 310 280 348 300 316 315 315 308 301 296 290 285 2 318 287 318 280 350 300 319 317 315 308 302 297 291 3 301 324 283 322 281 350 302 319 317 316 309 303 298 4 306 325 278 322 280 350 301 319 316 316 310 303 5 299 306 317 322 276 319 279 351 302 320 318 316 310 6 311 307 313 325 329 282 326 285 355 305 323 321 319 7 304 307 316 322 329 334 286 330 287 357 307 325 323 321 8 305 309 304 324 331 335 287 331 288 358 307 326 324 9 309 313 306 321 331 337 343 293 339 294 366 313 333 10 302 313 315 314 324 335 342 343 293 339 295 366 314 11 279 275 284 289 298 309 315 316 270 312 272 337 12 226 272 264 292 280 286 295 304 305 310 311 266 308 268 Subtotals: 3884 3923 3982 4051 4071 4096 4120 4135 4123 4103 4075 4039 4044 3999 1% 1. 5% 1. 7% 0. 5% 0. 6% 0. 4% -0. 3% -0. 5% -0. 7% -0. 9% 0. 1% -1. 1% Pct Chg: SDC: 0 0 0 0 Totals: 3884 3923 3982 4051 4071 4096 4120 4135 4123 4103 4075 4039 4044 3999 Capacity: 4555 4555 4555 4555 Open Seats: 671 632 573 504 484 459 435 420 432 452 480 516 511 556 4060 4077 4120 4117 4134 4143 4146 4144 4127 4111 FUTURE THINK

Developments & Growth Potential Impact

Residential Developments � Willow Brooke � Mason Grand � Towne of Deerfield � Deerfield Springs � Rivercrest � Falling Brook � TOTAL 265 units 294 units 316 units 164 units 217 units 1256 housing units

Dwelling Unit Locations

SAMPLE: Dwelling Units Occupied by Year

� My. School Locator by Decision. Insite

MY SCHOOL LOCATOR
- Slides: 17