Elemental Analysis of Beer Manufactured in Virginia Satellite

Elemental Analysis of Beer Manufactured in Virginia Satellite Breweries Jennifer Williams Advisor: Dr. Samrat Thapa Lynchburg College

National Impact of Craft Beer What is a craft beer? Small - 6 million gallons Independent - 25% Economy impact $23. 5 billion -2016 Job creation 129, 000 jobs - 2016

Craft Breweries in Virginia Why Virginia? Tax incentives Less saturated market Economic impact $9. 34 billion - 2016 Job creation 28, 000 jobs - 2016

Virginia Satellite Breweries

Objective Elemental composition comparison between beer made from original California breweries and Virginia satellite breweries

Elements Magnesium Calcium Manganese Zinc Iron Sodium

Calcium Amylase, Proteolytic enzyme Lowers p. H Prevents beerstones Magnesium Hardness of water 30 ppm < sour/bitter flavor Yeast Metabolism Laxative effect

Iron Lowers p. H Helps metabolic processes Enzyme activity in yeast Production of hazy wort and reduced yeast activity Oxidation - decreased shelf life

Manganese Proper enzyme action During Mashing Protein solubility Sodium Greater amount - more salty Sour taste

Zinc Protein synthesis Enzyme Activity Yeast growth but toxic if Zn >1 ppm Flocculation Stabilizes foam High amount can add a Metallic or soapy taste

Background Elemental Contributors Hops Barley Water

Hops and Barley Hops Preservation Bitterness Flavoring Barley Carbohydrate source Different varieties

Water Trace elements Hard or Soft Water Calcium and Magnesium content Water treatment Ion Exchange Dechlorination
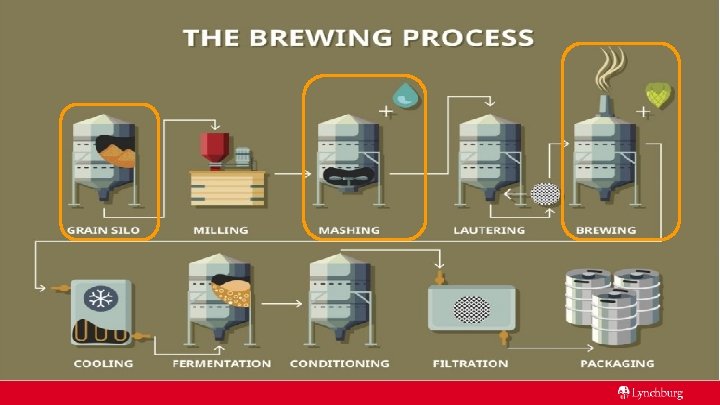

Beer

Experimental Overview Standard Inorganic Ventures' ICP Calibration Standard 8 100 µg/m. L Stock solution Blank 5% Ethanol Calibration Curve 1 ppm 2 ppm 4 ppm 5 ppm 7 ppm 10 ppm 15 ppm 25 ppm

Sample Preparation Three bottles from California and Virginia Degassed Opened 24 hours in advance 25 ml of beer in a conical tube Shaker for 20 minutes Dilutions 10 fold Dilution California Virginia

Instrumentation Agilent | 4200 MP-AES Micro Plasma Atomic Emission Spectroscopy

MP-AES Schematic diagram

Data Calcium California is Blue Virginia is Red Y-axis is Concentration Tangerine Express Virginia consistently lower than California

Stone Brewing Tangerine Express IPA Magnesium California Virginia Sodium *Manganese Zinc below the Limit of Detection Calcium Iron

Stone IPA Magnesium Sodium California Virginia *Manganese Zinc below the Limit of Detection Calcium Iron

Ballast Point Sculpin IPA Sodium Magnesium California Virginia *Manganese Zinc below the Limit of Detection Calcium Iron

Conclusion Differences Calcium - Magnesium - Sodium Similar Iron Detection limit Zinc and Manganese

Acknowledgement Dr. Samrat Thapa, Research Advisor The Rosel H. and Elliot S. Schewel Research Fund Lynchburg College Chemistry Department Dr. Gannicott, MP-AES Guru

Stone Brewing Tangerine Express IPA Calcium Iron California Virginia 69. 42 ppm ± 0. 68 58. 42 ppm ± 0. 37 1. 62 ppm ± 0. 02 1. 73 ppm ± 0. 02 Magnesium Sodium California Virginia 132. 42 ppm ± 4. 75 117. 57 ppm ± 6. 00 65. 96 ppm ± 3. 02 78. 99 ppm ± 3. 90 *Based on Mean Values

Stone IPA Results Calcium Iron California Virginia 64. 03 ppm ± 0. 34 14. 41 ppm ± 0. 19 1. 54 ppm ± 0. 03 1. 47 ppm ± 0. 03 Magnesium Sodium California Virginia 142. 97 ppm ± 3. 09 102. 27 ppm ± 2. 05 84. 30 ppm ± 5. 17 46. 51 ppm ± 0. 78 *Based on Mean Values

Ballast Point Sculpin IPA Calcium Iron California Virginia 53. 24 ppm± 0. 30 70. 77 ppm± 1. 02 1. 19 ppm± 0. 02 1. 25 ppm± 0. 03 Magnesium Sodium California Virginia 96. 99 ppm± 1. 98 100. 59 ppm ± 3. 2881 92. 44 ppm± 1. 26 149. 75 ppm± 1. 39 *Based on Mean Values
- Slides: 28