
ElectroOptic Beam Diagnostic at BNL DUVFEL Henrik Loos
Electro-Optic Beam Diagnostic at BNL DUV-FEL Henrik Loos for National Synchrotron Light Source Brookhaven National Laboratory Presented at ICFA Mini-Workshop XFEL 2004
Outline § DUV-FEL accelerator facility § Coulomb field measurement § THz CTR pulse characterization § Issues for ultrafast electro-optic measurement § Summary and outlook 2
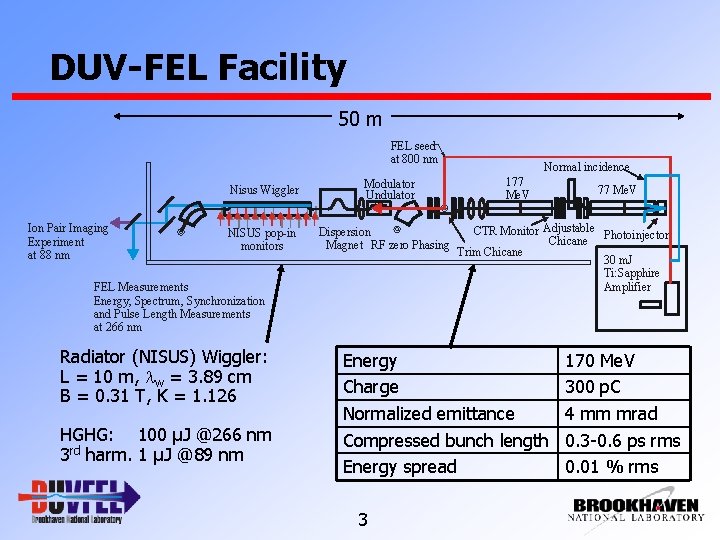
DUV-FEL Facility 50 m FEL seed at 800 nm Nisus Wiggler Ion Pair Imaging Experiment at 88 nm NISUS pop-in monitors Modulator Undulator Dispersion Magnet RF zero Phasing FEL Measurements Energy, Spectrum, Synchronization and Pulse Length Measurements at 266 nm Radiator (NISUS) Wiggler: L = 10 m, lw = 3. 89 cm B = 0. 31 T, K = 1. 126 HGHG: 100 µJ @266 nm 3 rd harm. 1 µJ @89 nm Normal incidence 177 Me. V CTR Monitor Adjustable Photoinjector Chicane Trim Chicane 30 m. J Ti: Sapphire Amplifier Energy Charge Normalized emittance Compressed bunch length Energy spread 3 77 Me. V 170 Me. V 300 p. C 4 mm mrad 0. 3 -0. 6 ps rms 0. 01 % rms
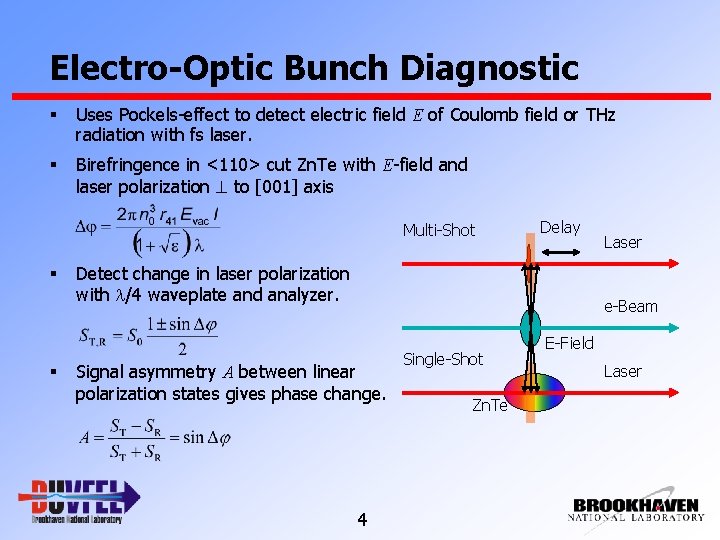
Electro-Optic Bunch Diagnostic § Uses Pockels-effect to detect electric field E of Coulomb field or THz radiation with fs laser. § Birefringence in <110> cut Zn. Te with E-field and laser polarization to [001] axis Multi-Shot § § Delay Detect change in laser polarization with l/4 waveplate and analyzer. Laser e-Beam Signal asymmetry A between linear polarization states gives phase change. 4 Single-Shot Zn. Te E-Field Laser
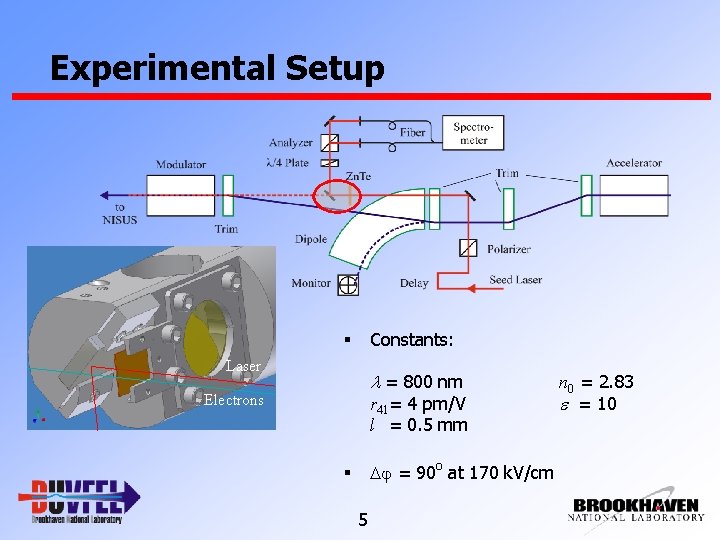
Experimental Setup Constants: § Laser l = 800 nm Electrons r 41= 4 pm/V l = 0. 5 mm Dj = 90 o at 170 k. V/cm § 5 n 0 = 2. 83 e = 10
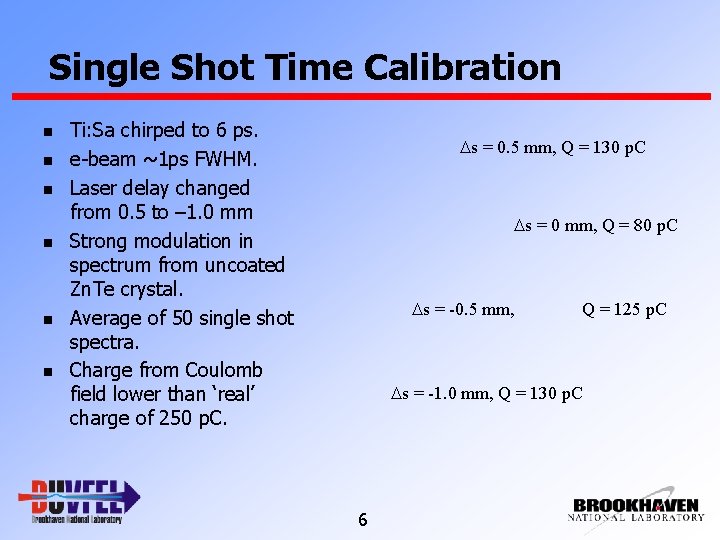
Single Shot Time Calibration n n n Ti: Sa chirped to 6 ps. e-beam ~1 ps FWHM. Laser delay changed from 0. 5 to – 1. 0 mm Strong modulation in spectrum from uncoated Zn. Te crystal. Average of 50 single shot spectra. Charge from Coulomb field lower than ‘real’ charge of 250 p. C. Ds = 0. 5 mm, Q = 130 p. C Ds = 0 mm, Q = 80 p. C Ds = -0. 5 mm, Q = 125 p. C Ds = -1. 0 mm, Q = 130 p. C 6
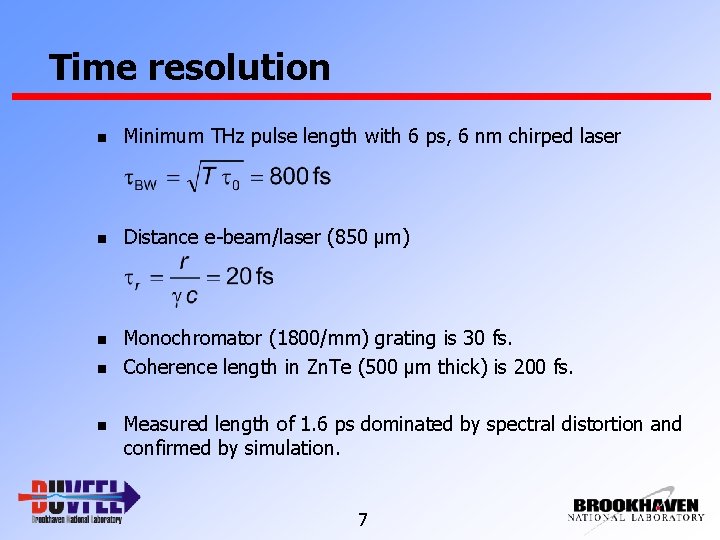
Time resolution n Minimum THz pulse length with 6 ps, 6 nm chirped laser n Distance e-beam/laser (850 µm) n Monochromator (1800/mm) grating is 30 fs. Coherence length in Zn. Te (500 µm thick) is 200 fs. n n Measured length of 1. 6 ps dominated by spectral distortion and confirmed by simulation. 7
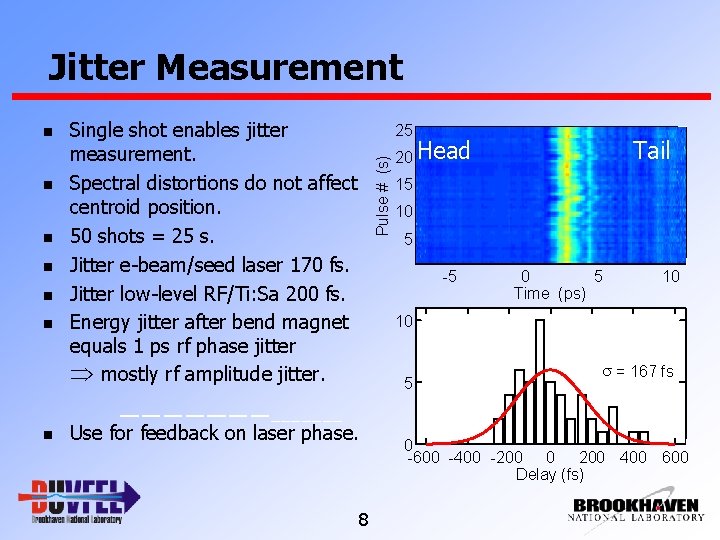
Jitter Measurement n n n Single shot enables jitter measurement. Spectral distortions do not affect centroid position. 50 shots = 25 s. Jitter e-beam/seed laser 170 fs. Jitter low-level RF/Ti: Sa 200 fs. Energy jitter after bend magnet equals 1 ps rf phase jitter mostly rf amplitude jitter. 25 Pulse # (s) n 20 Head Tail 15 10 5 -5 0 5 Time (ps) 10 10 5 Use for feedback on laser phase. 8 s = 167 fs 0 -600 -400 -200 0 200 400 600 Delay (fs)
THz Pulse Field Characterization n 80 µJ CTR pulse observed at DUV-FEL. n E-beam 700 p. C, 100 Me. V, 150 (? ? ? ) fs rms. n Measure spatial-temporal electric field distribution with EO sampling. n Understand relay and focusing of CTR. n Compare with CTR simulation code. n Compare with bolometer measurement. 9
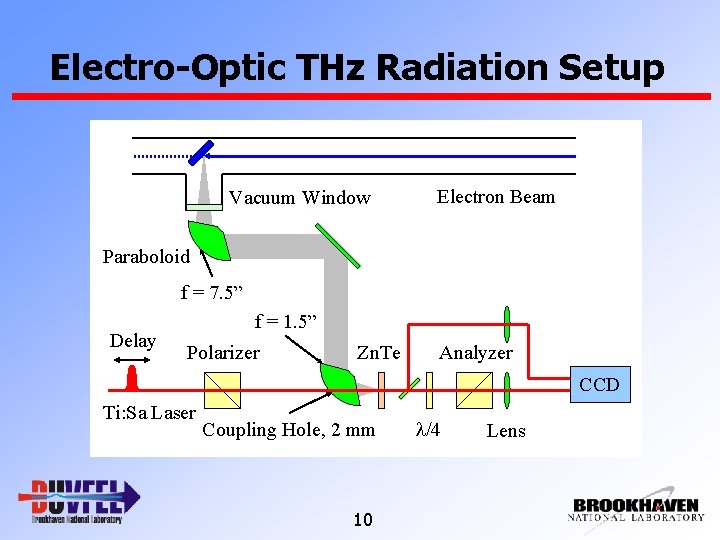
Electro-Optic THz Radiation Setup Vacuum Window Electron Beam Paraboloid f = 7. 5” Delay f = 1. 5” Polarizer Zn. Te Analyzer CCD Ti: Sa Laser Coupling Hole, 2 mm 10 l/4 Lens
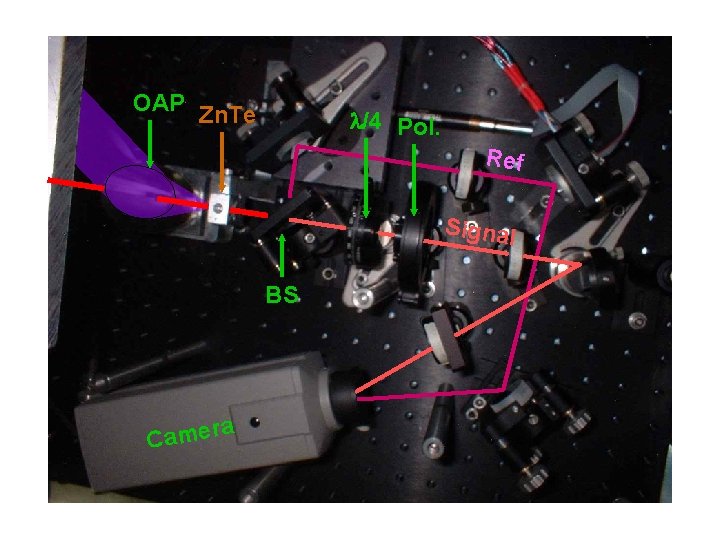
Signal and Reference OAP Zn. Te l/4 Pol. Ref Signal BS ra e m a C 11
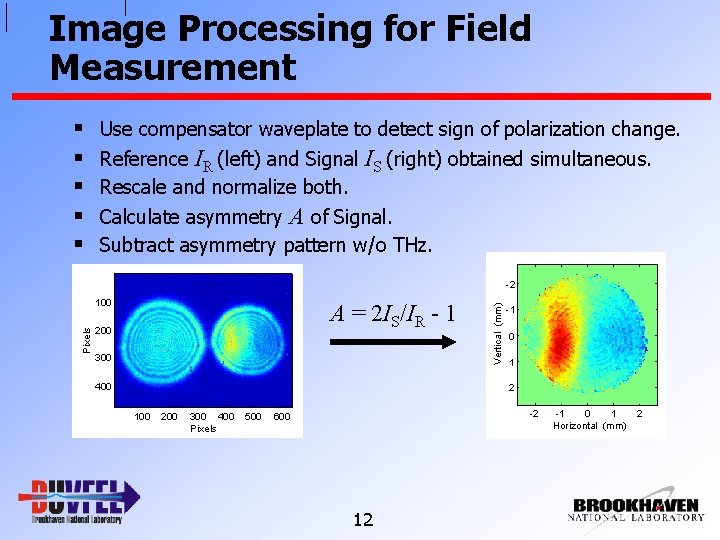
Image Processing for Field Measurement § § § Use compensator waveplate to detect sign of polarization change. Reference IR (left) and Signal Rescale and normalize both. IS (right) obtained simultaneous. Calculate asymmetry A of Signal. Subtract asymmetry pattern w/o THz. Pixels 100 A = 2 IS/IR - 1 200 300 400 Vertical (mm) -2 -1 0 1 2 100 200 300 400 Pixels 500 -2 600 12 -1 0 1 Horizontal (mm) 2
Time Dependent Measurement § Use ‘mildly’ compressed bunch of 500 fs rms and 300 p. C to get both 0 -phasing and electrooptic measurement. § Temporal scan by varying phase of accelerator RF to both sample and cathode laser. § Approximately equivalent to varying delay between both lasers but much faster and computer controlled. § Measured to be 1. 2 ps/degree. 13
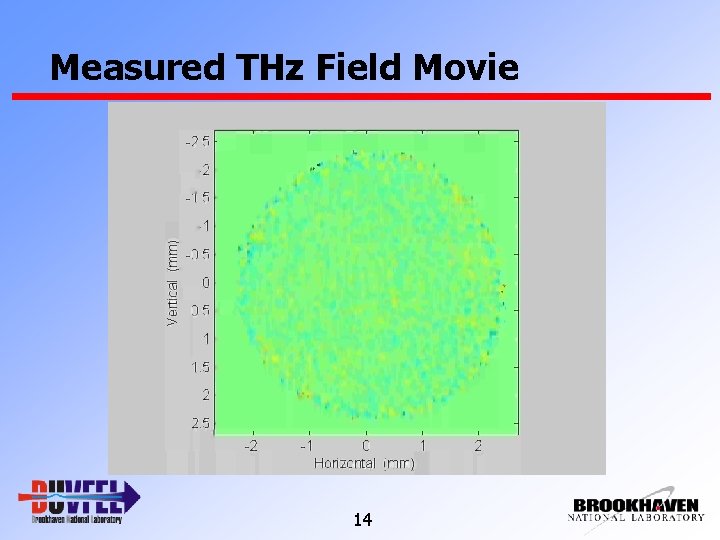
Measured THz Field Movie 14
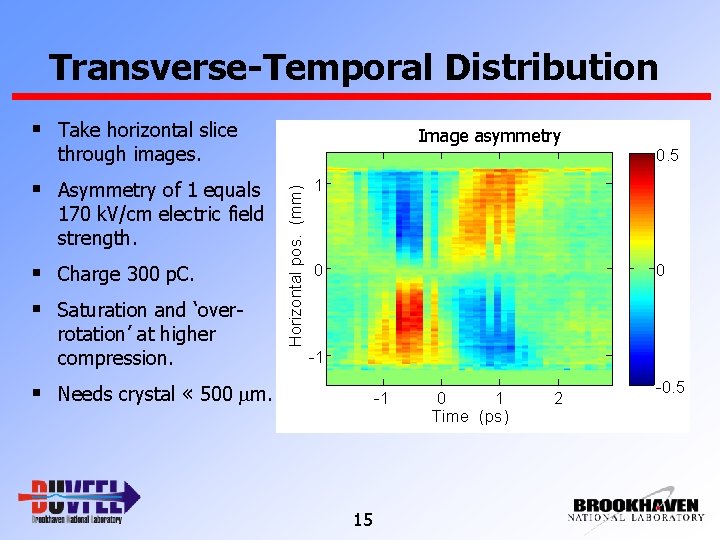
Transverse-Temporal Distribution § Take horizontal slice Image asymmetry through images. 170 k. V/cm electric field strength. § Charge 300 p. C. § Saturation and ‘overrotation’ at higher compression. Horizontal pos. (mm) § Asymmetry of 1 equals 0. 5 1 0 0 -1 § Needs crystal « 500 mm. -1 15 0 1 Time (ps) 2 -0. 5
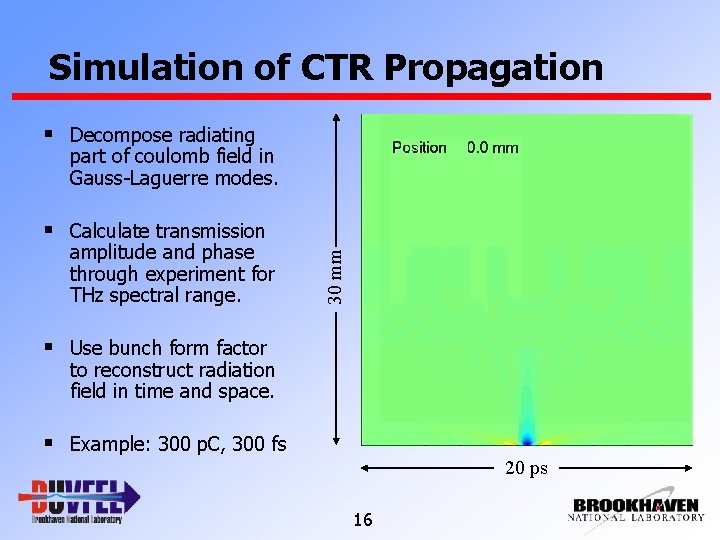
Simulation of CTR Propagation § Decompose radiating part of coulomb field in Gauss-Laguerre modes. amplitude and phase through experiment for THz spectral range. 30 mm § Calculate transmission § Use bunch form factor to reconstruct radiation field in time and space. § Example: 300 p. C, 300 fs 20 ps 16
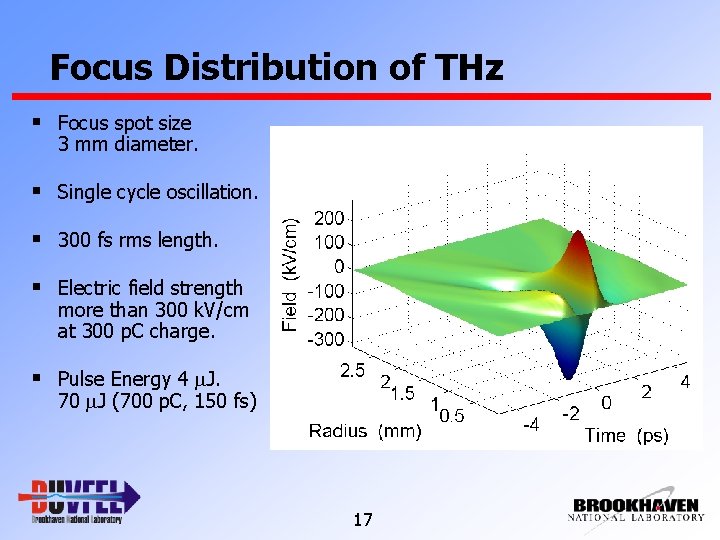
Focus Distribution of THz § Focus spot size 3 mm diameter. § Single cycle oscillation. § 300 fs rms length. § Electric field strength more than 300 k. V/cm at 300 p. C charge. § Pulse Energy 4 m. J. 70 m. J (700 p. C, 150 fs) 17
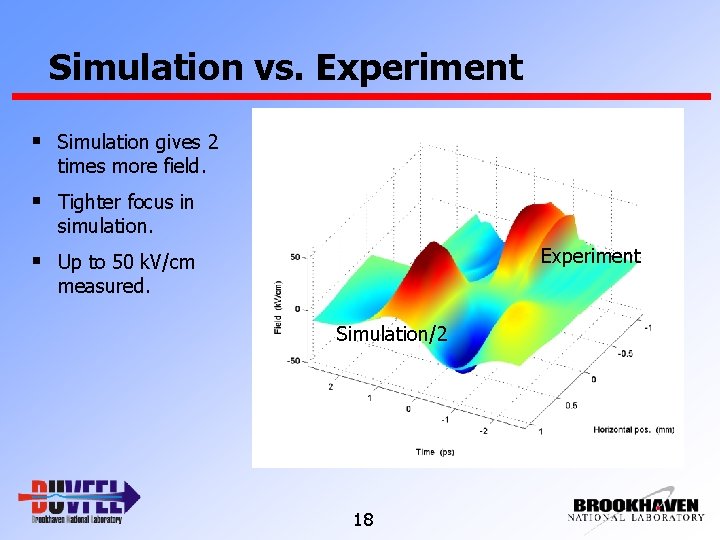
Simulation vs. Experiment § Simulation gives 2 times more field. § Tighter focus in simulation. Experiment § Up to 50 k. V/cm measured. Simulation/2 18
Single Cycle THz Pulses § Pulse energy from field ~60 n. J. § Pulse energy with Joule§ § meter 170 n. J. Pulse energy from simulation 800 n. J. Good match of temporal and spectral properties. Factor 2 and 4 difference in field and energy. Measured 80 m. J to have 1 MV/cm field in focus. 19
THz Spectrum § Present intensity limited by geometric apertures. § Low frequency cutoff at 15 cm-1 or 0. 5 THz. 20
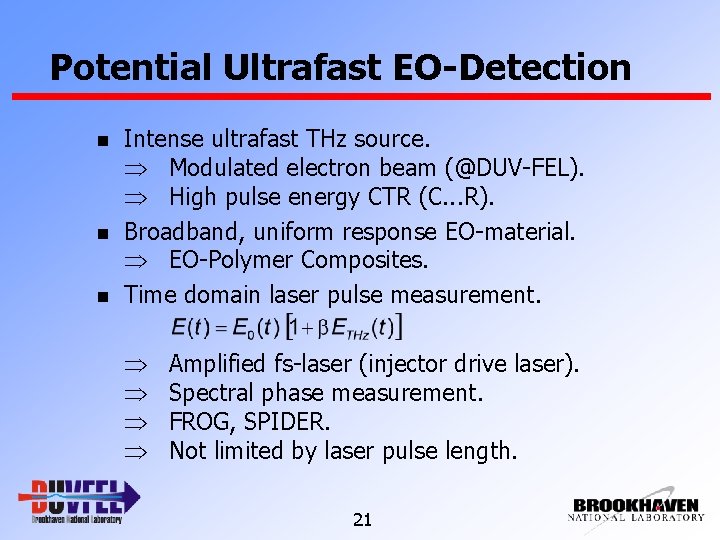
Potential Ultrafast EO-Detection n Intense ultrafast THz source. Modulated electron beam (@DUV-FEL). High pulse energy CTR (C. . . R). Broadband, uniform response EO-material. EO-Polymer Composites. Time domain laser pulse measurement. Amplified fs-laser (injector drive laser). Spectral phase measurement. FROG, SPIDER. Not limited by laser pulse length. 21
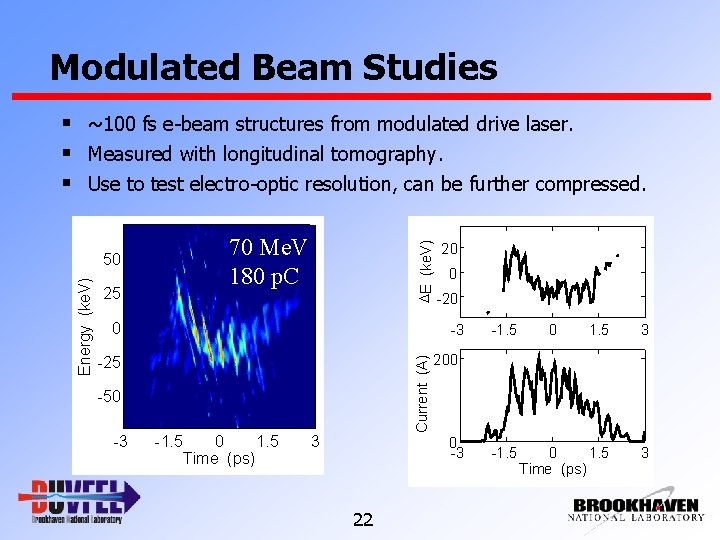
Modulated Beam Studies § ~100 fs e-beam structures from modulated drive laser. § Measured with longitudinal tomography. § Use to test electro-optic resolution, can be further compressed. 0 -25 -50 -3 20 0 -20 -3 Current (A) Energy (ke. V) 25 DE (ke. V) 70 Me. V 180 p. C 50 -1. 5 0 1. 5 Time (ps) 3 200 0 -3 22 -1. 5
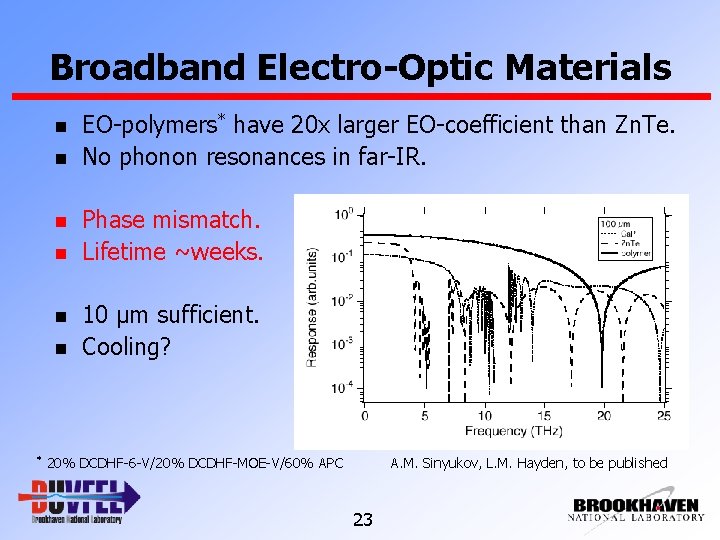
Broadband Electro-Optic Materials n n n * EO-polymers* have 20 x larger EO-coefficient than Zn. Te. No phonon resonances in far-IR. Phase mismatch. Lifetime ~weeks. 10 µm sufficient. Cooling? 20% DCDHF-6 -V/20% DCDHF-MOE-V/60% APC A. M. Sinyukov, L. M. Hayden, to be published 23
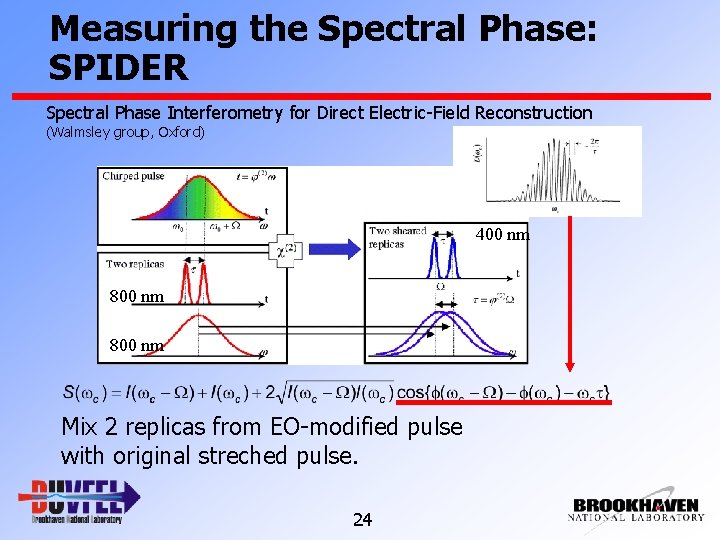
Measuring the Spectral Phase: SPIDER Spectral Phase Interferometry for Direct Electric-Field Reconstruction (Walmsley group, Oxford) 400 nm 800 nm Mix 2 replicas from EO-modified pulse with original streched pulse. 24
Summary and Outlook § Simple single shot chirped EO setup sufficient for jitter § § § measurement. Jitter of 170 fs equal to low-level rf/laser jitter and estimates from HGHG. Enables noninvasive laser/e-beam synchronization-feedback. Ultrafast EO measurement requires time-domain method. § High intensity THz pulses up to 1 MV/cm field strength from CTR. § CTR simulation, pulse energy and electro-optic measurement in § § resonable agreement. Extract THz to accessible user station for various applications. Use time-domain single-shot EO method and apply to THz from modulated electron beam. 25
Acknowledgements SDL/DUV-FEL Team G. L. Carr J. Greco H. Loos† J. B. Murphy † J. Rose T. V. Shaftan B. Sheehy Y. Shen B. Singh X. J. Wang Z. Wu L. H. Yu In future at SLAC This work was supported by DOE Contracts DEAC No. DE-AC 0298 CH 10886 and AFOSR/ONR MFEL Program No. NMIPR 01520375. 26
- Slides: 26