Electron microscopy electron diffraction and Xray crystallography Sven


 image of human muscle fibres.")


 gives higher resolution n n Figure 2. a) Electron microscopy")


 wire frame b) ball-and-stick")


 All proteins have both ends (N: blue, C: red)")

- Slides: 51
Electron microscopy electron diffraction and X-ray crystallography Sven Hovmöller Structural Chemistry, Stockholm University SE-106 91 Stockholm, Sweden svenh@struc. su. se
The resolution of the light microscope is limited by the wavelength of light 400 – 700 nm Electrons in an electron microscope have a wavelength under 0. 1 Ångström
Electron gun Lenses Sample holder Electron microscope
Bacteria are so thick that they have to be sliced for the EM 200 nm
Electron microscopy started cell biology Electron microscopy (EM) image of human muscle fibres.
Viruses and bacteriophages were first seen by EM Bacteriophages attacking lactobillus Image by Nurmiaho-Lassila, Helsinki.
Organelles can be seen by EM 1000Å Mitochondrion with parallel inner membranes
ify! magn 400 Å
Higher magnification without increased resolution is pointless 400 Å
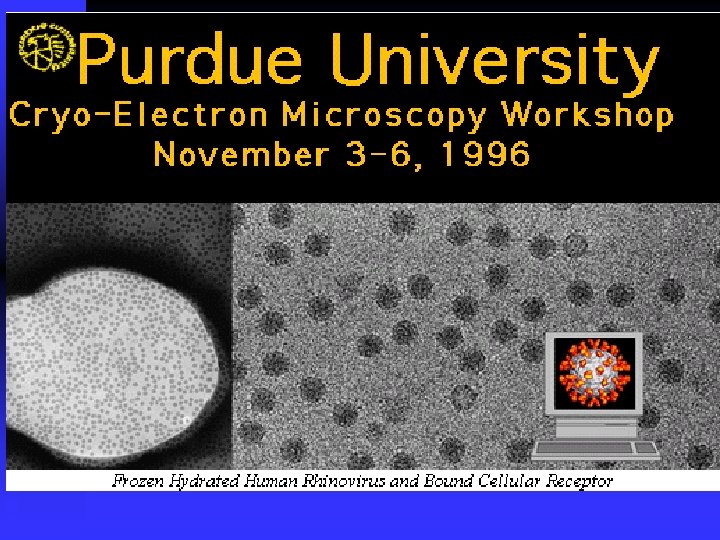
Spherical viruses determined by cryo transmission electron microscopy at Purdue
Bettina Böttcher
SEM: Scanning Electron Microscopy gives 3 D images but only of the surface and with low resolution
Transmission Electron Microscopy (TEM) gives higher resolution n n Figure 2. a) Electron microscopy image of the membrane protein complex cytochrome reductase. The individual protein complexes have a molecular weight of 550 k. Da and are seen as small rings. From Hovmöller et al. 1983. b) The calculated Fourier transform of the crystal in a) shows clear diffraction spots, extending to 5 orders in one direction and 7 in the other. The crystallographic resolution is thus 137Å/5 = 27 Å along h and 174Å/7 = 25 Å along k. The diffraction spots are indexed along h and k as shown by the two reflections 3 5 and 2 -6.
Resolution. k n n h The resolution of this diffractogram is 25 Å, since the outermost reflections 5 0 and 0 7 (at the outermost ring) have d-spacings of 25 Å. The innermost ring corresponds to a resolution of 80 Å. The two middle rings are at 45 and 35 Å resolution, respectively. The kind of images we can see using these different data are shown in Figure 3. n Atomic resolution is reached at about 2 Å resolution, i. e. with a radius 12 times larger than the largest circle shown here.
The effect of increased resolution 80 Å 45 Å n n 35 Å 25 Å Left: the resolution is 80 Å, i. e. only the data inside the innermost ring has been used. b) 45 Å, c) 35 Å and d) 25 Å resolution. At 80 Å resolution we see only a blob. At 45 Å the molecule looks (incorrectly) as a tetramer. At 35 and 25 Å resolution we see that the molecule is an ellipsoidal dimer. We can also see that the molecules in the corner and middle of the unit cells are differently oriented (one is flipped over relative to the other).
Atomic resolution in the EM 20Å Electron microscopy image of a metal oxide showing an interesting intermediate stage of ordering between crystalline and disordered. Each small black dot is an Nb. O 6 octahedron. This near atomic resolution image was taken by Gunnar Svensson.
The first known membrane protein structure was bacteriorhodopsin – by low dose EM 2 D projection perpendicular to the membrane 3 D reconstruction from several tilted views Unwin & Henderson, MRC Cambridge 1975 The hydrophobicity plot is based on this work
The transmembrane protein bacteriorhodopsin visualised in five different ways. a) wire frame b) ball-and-stick c) space-filling d) secondary structure and e e) original balsa-wood model from EM a to d are made with RASMOL on data from PDB.
EM 25 Å resolution Weiss, H. , Hovmöller, S. and Leonard, K. Preparation of Membrane Crystals of Ubiquinol-Cytochrome c Reductase from Neurospora Mitochondria and Structure Analysis by Electron Microscopy. Methods in Enzymology (1986) 126, 191 -201 Chicken cytochrome bc 1 complex X-ray 2. 8 Å resolution
The structure is built up by successively adding in the reflections (=Fourier coefficients n n a) The reflection 1 1 cuts the a edge of the unit cell once and the b edge also once per unit cell. This cosine wave has its maximum (0 o) at the origin of the unit cell, so its phase is 0. b) The reflection 1 – 1 also has the phase 0. c) The summation of the 3 reflections 1 1, 1 – 1 and 0 2 results in a blob at the origin of the unit cell and another blob in its center. d) The reflection 0 2 cuts the b edge twice but never the a edge. The phase is 0.
Solving the phase problem in X-ray crystallography for proteins using heavy atom derivatives. a b c d Native protein Heavy atom Protein + heavy metal e
Protein crystal structures can be refined to about 0. 1 Å accuracy The disagreement between observed and calculated amplitudes (or intensities I(hkl) = F(hkl) 2 ) are calculated as the crystallographic R-value
EM on whole cells - tomography Visualization of actin network, membranes, and cytoplasmic macromolecular complexes. A volume of 815 nm by 870 nm by 97 nm Baumeister et al. MPI Martinsreid
Fig. A and B: 26 S proteasome as visualized in its cytoplasmic context. D D. X-ray at 2. 4 Å resolution Fig. C: Purified and negatively stained 26 S proteasome Baumeister et al. MPI Martinsreid
Ribosomes from cryo-EM and X-rays Marin van Heel London Joachim Franck Albany
The Protein Data Base PDB is on the Internet n The wealth of accurate structural data, mainly on proteins but also on DNA, RNA and carbohydrates is freely available on the Internet at http: //www. rcsb. org/pdb/
Conclusions X-ray diffraction and electron microscopy are the main sources of structural information in biological systems. Both methods can reach atomic resolution. n X-ray crystallography is the method of choice if 3 D-crystals of at least 20 x 20μm 3 (containing > 108 ordered identical molecules) can be made. n For single particles or larger systems that are not ordered, such as organelles or whole cells, electron microscopy is the main technique.
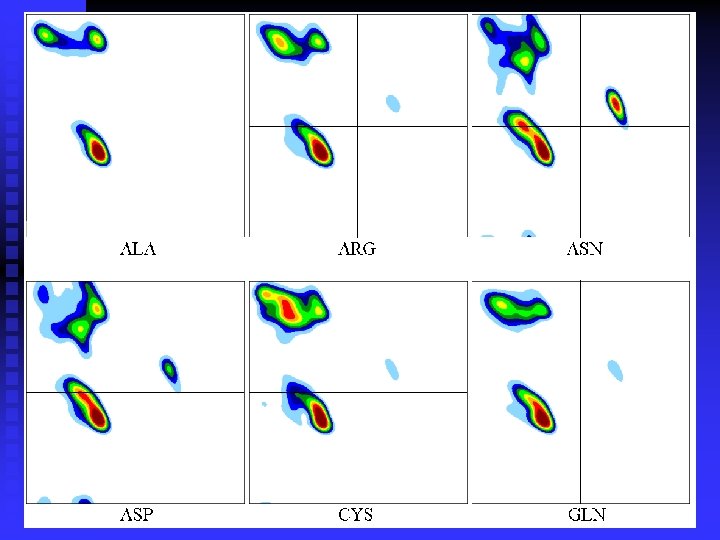
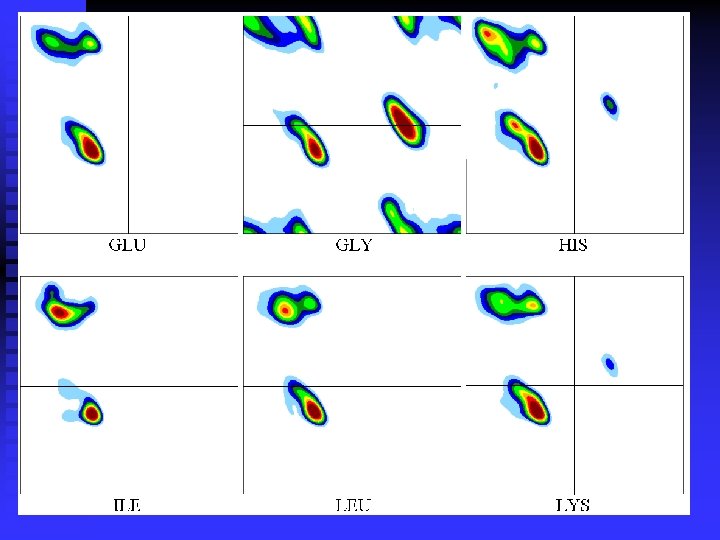
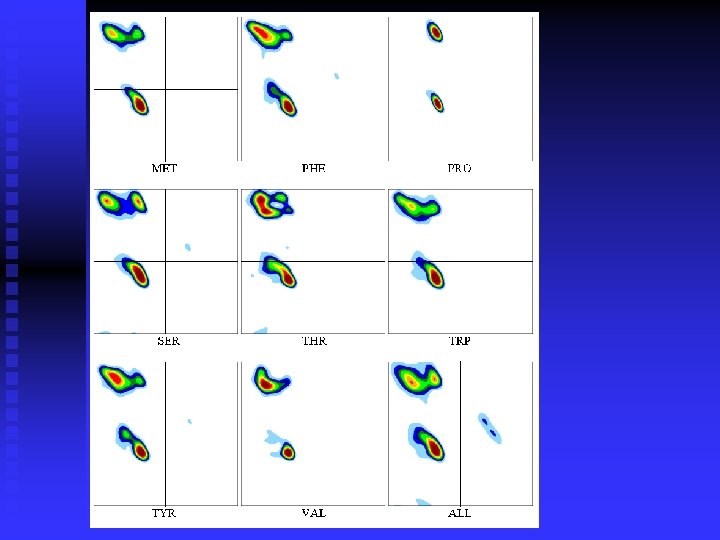
The Ramachandran plot n The torsion angles in the polypeptide backbone
The Ramachandran plot Alanine/non-Glycine
Smoothing the plots:
-sheets
Random coil
Random coil
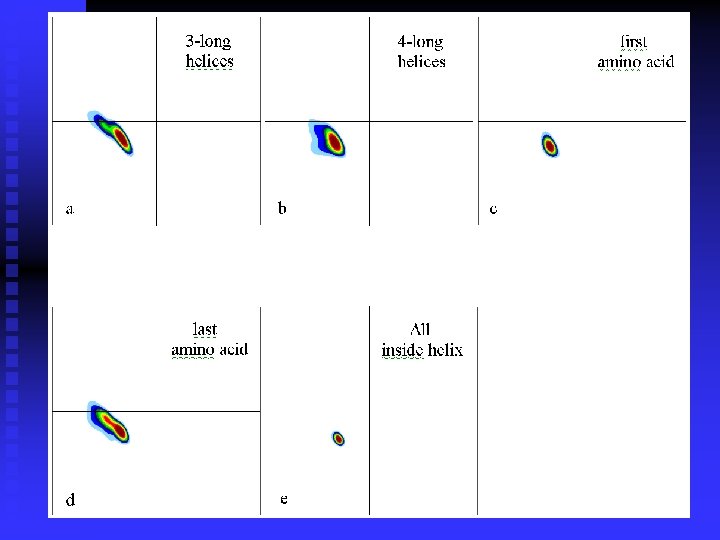
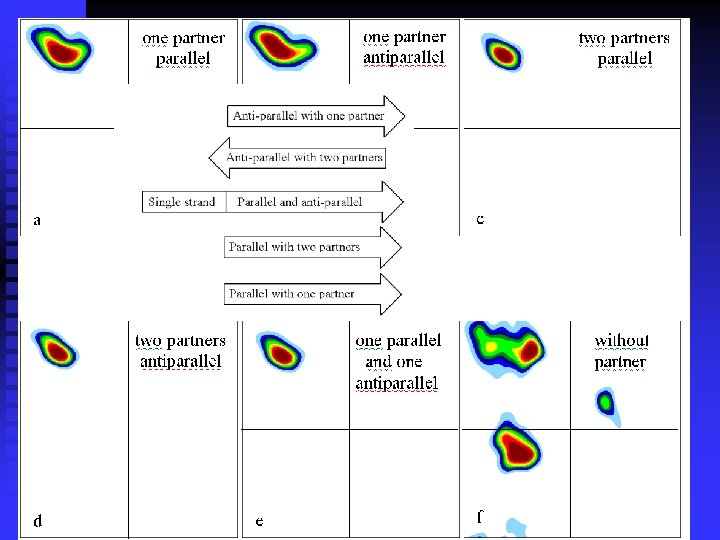
n Ramachandran plots are very informative Ramachandran was right in all essentials, but the details were wrong All distributions are along the diagonal, i. e. the and angles are coupled The -helices are very rigid The -sheet region is divided into two parts, but parallel and anti-parallel -sheets are nearly identical The Gly plot is very far from the predicted n Hovmöller, Zhou & Ohlson Acta Cryst D 58 (2002) 768 -776 n n n
Shape strings
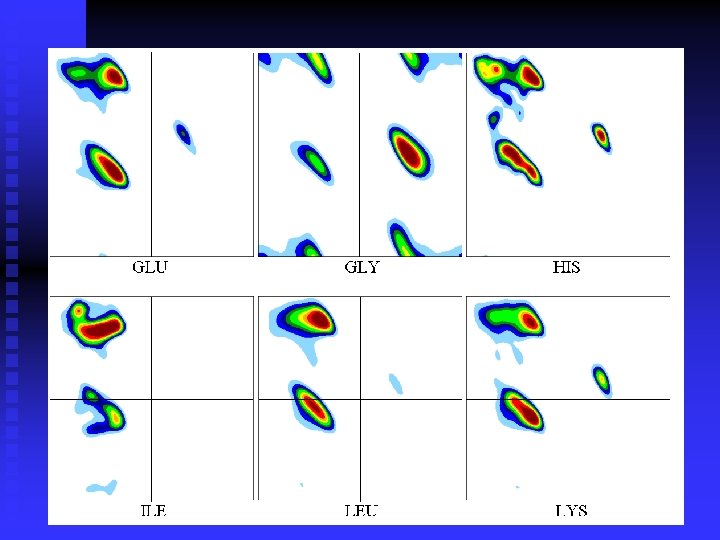
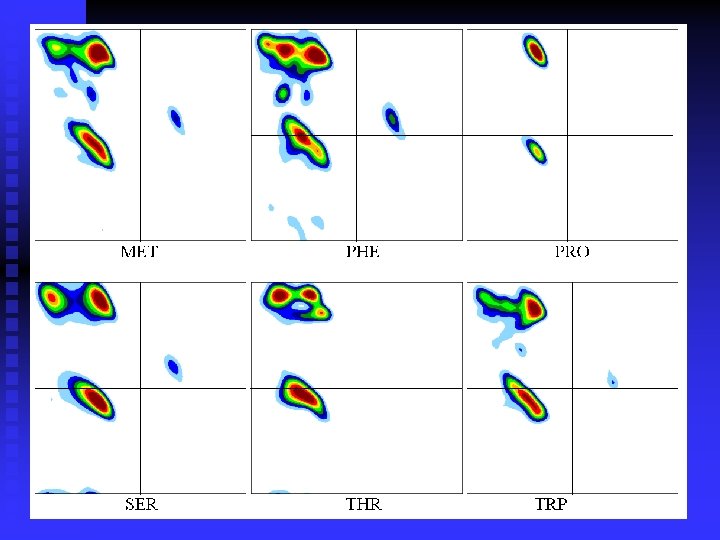
Amino acids: comformational preferences
Shapes are conservative
Shape String SSSSHHSSSS n n 107 cases of SSSSHHSSSS – 103 are well clustered, all with 3 or 4 H-bonds (yellow and green) in antiparallel β-sheets. Only 4 cases differ in shape – these are not connected by H-bonds. carbon oxygen nitrogen
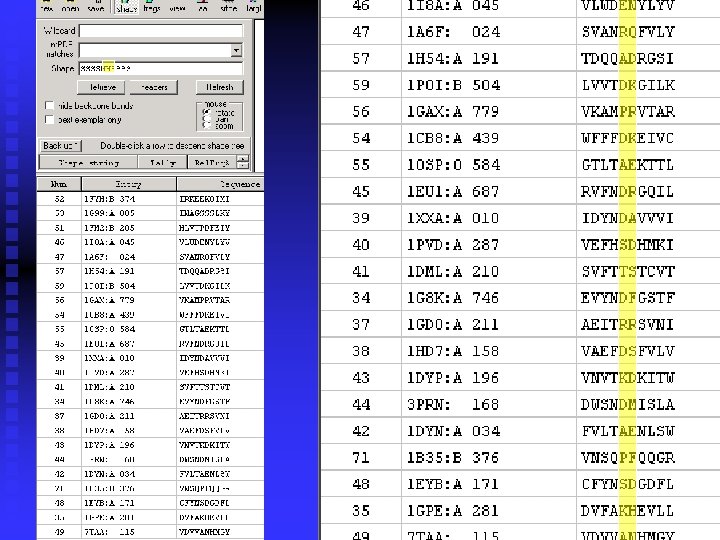
One sequence can have many shapes sequence 3 -frag hits N shapes shape 1: hits shape 2: hits. . . shape. N: hits ALV 256 19 HHH: 145 HHR: 3 HHS: 2 HRS: 3 HSH: 1 HSS: 3 HUS: 1 HVR: 1 RHH: 2 RRS: 2 RSH: 1 RSR: 4 RSS: 10 SHS: 1 SRR: 1 SRS: 5 SSH: 1 SSR: 5 SSS: 65 GGG 237 101 GGG: 2 GGH: 1 GGR: 1 GGS: 5 GHG: 3 GHH: 6 GHR: 6 GHS: 1 GHT: 2 GHV: 1 GRG: 1 GRH: 2 GRR: 1 GRS: 2 GRT: 2 GSH: 1 GSR: 2 GSS: 1 GTG: 1 GTT: 6 GVR: 3 HGG: 2 HGH: 1 HGR: 3 HGS: 3 HGT: 3 HHG: 1 HHH: 10 HHR: 1 HHS: 2 HHT: 5 HHV: 1 HRS: 2 HSH: 1 HSR: 1 HSS: 1 HTG: 1 HTH: 2 HTR: 4 HTS: 1 HTT: 3 RGR: 1 RGT: 1 RHG: 1 RHH: 4 RHR: 1 RHS: 2 RRR: 1 RRS: 1 RRT: 2 RSG: 1 RSH: 1 RSR: 2 RSS: 3 RTG: 2 RTR: 4 RTT: 8 SGG: 1 SGR: 1 SGS: 3 SGT: 4 SHG: 1 SHH: 1 SHR: 1 SHS: 2 SHT: 1 SRH: 3 SRR: 1 SRS: 2 SRT: 6 SSG: 3 SSH: 1 SSR: 2 SSS: 7 STG: 1 STS: 1 STT: 2 TGG: 2 TGH: 1 TGS: 1 TGT: 1 THG: 8 THR: 2 THS: 1 THV: 1 TRG: 5 TRH: 5 TRR: 1 TRS: 7 TSG: 3 TSR: 2 TSS: 1 TTG: 1 TTH: 5 TTR: 4 TTS: 1 TTT: 2 VGG: 1 VGH: 2 VHR: 1 VHT: 2 VVI 160 17 HHH: 15 HRH: 1 RHS: 3 RRR: 1 RSR: 4 RSS: 12 RSU: 1 SRH: 2 SRR: 2 SRS: 6 SRT: 1 SRV: 1 SSH: 2 SSR: 26 SSS: 81 SSU: 1 SUR: 1 VLI 141 17 HHH: 36 HRR: 1 RHU: 1 RSR: 2 RSS: 4 RVH: 2 SRH: 4 SRR: 1 SRS: 7 SRU: 1 SSR: 27 SSS: 50 STR: 1 STS: 1 SUR: 1 SUS: 1 SVR: 1 LPP 142 14 GRH: 1 HHH: 5 HRR: 1 RHH: 3 RRH: 37 RRR: 35 RRV: 1 SHH: 1 SRH: 18 SRR: 32 THH: 1 TRR: 1 URR: 5 URV: 1 PPL 84 12 HHH: 12 HHS: 1 RHG: 2 RHH: 8 RHR: 3 RHS: 4 RRH: 19 RRR: 15 RRS: 17 RRT: 1 RRV: 1 RVS: 1 PPP 65 5 HHH: 1 RHH: 2 RHR: 2 RRH: 12 RRR: 48
Predicting Protein Structure
Gripping the N-terminal end a) All proteins have both ends (N: blue, C: red) on the surface of the molecule. Here is a typical example. b) The first and last amino acids in proteins are equally often found on the surface (red) and rarely in the centre of proteins (black curve). Hovmöller & Zhou, PROTEINS (2003), in press.
Dr. Tuping Zhou programmer Jonas Almqvist Ph. D. student Tomas Ohlson Ph. D. student Dr. Roger Ison Author of Frags