Electricity Deregulation and the California Energy Crisis Electricity


")


")


 • Marketers/Traders")


 •")

- Slides: 32
Electricity Deregulation and the California Energy Crisis • • • Electricity and energy What happened in California? Utility deregulation in NE and Maine Future trends, including renewables The big picture
What is electricity? • Electricity is a naturally occurring physical force created by the interaction of negatively and positively charged particles. – Benjamin Franklin, 1752 (electricity transmitted from lightning to iron spike to key) – Michael Faraday, 1831 (generated electricity by rotating magnets around a coil of wires) – Thomas Edison, 1882 (world’s first electricity-generating plant, NY)
Electricity Flow, 1999 (Quadrillion Btu)
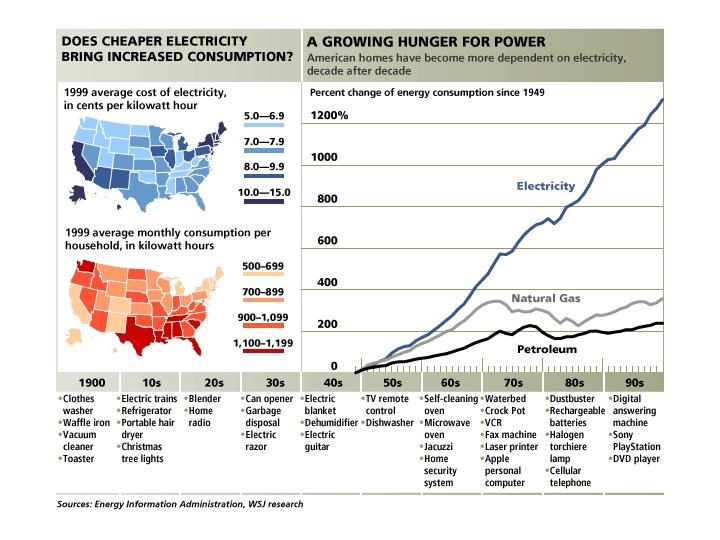
Consumer Prices, 1999
Electricity Net Generation by Source, 1999
California Utility Generation by Primary Energy Source, 1998
Electricity Net Generation at Electric Utilities
Vertically Integrated Utility
Why Deregulate? ANSWER: Inefficient market (move from monopoly to market and choice)
CALIFORNIA DEREGULATION Then Now • Utilities owned generating plants, prices regulated • Utilities owned transmission lines • Utilities own distribution systems to homes and businesses • Plants sold to private companies. Prices set at auction by CA Power Exchange. • Transmission lines, grids in Independent System Operator (np) • Utilities still own distribution systems
California Energy Crisis Wholesale Electricity Costs • 1999 $7. 4 billion • 2000 $27 billion • 2001(6 mo) >$20 billion – CA now has long-term contracts (peak purchase)
Who are the Players? • Energy producers (natural gas, nuclear, coal, other) • Marketers/Traders (buy-sell energy and/or buy-sell electricity) • Power Plants (Utilities and others) • Transmission(Utilities, ISOs, RTOs) • Distribution (Utilities to users) • Regulators (State and Federal)
Who to blame? • Generating capacity tight; few non-utility owners; few new plants • Long–term contracts not allowed; spot purchases required • Demand increased 25%; supply increased 6% in 10 yrs • Transmission lines/infrastructure constraints • Natural gas prices much higher than normal • California electricity rates frozen (at utilities’ request); couldn’t pass price increases on to consumers • Generators and fuel suppliers were reluctant to sell to bankrupt utilities • Poor sight by FERC, state regulators
UK Electricity Deregulation
New England Utilities • Nine plants built since 1998. 30 plants under construction. • Demand at a steady pace. • Increased dependence on natural gas. • Utilities use long term contracts (20% spot) • NE imports from other states (Canada, also)
New Approach to Deregulation • Electricity is a special commodity • Better wholesale market design (less spot market use) • Create real-time pricing for consumers • Provide transparency, efficiency, choice • Add co-generating capacity/rethink size • Think distributed generation/”off grid” • Improve transmission infrastructure • Use gas storage to moderate volatility • Re-evaluate regulatory system • Use life-cycle analyses • Anticipate surprises
125 100 New Utility Generating Units by year of entry into service 1, 250 Number of new units 1, 000 75 750 50 500 25 250 0 Maximum new size, MW 1993 1994 1995 1996 1997 1998 1999 2000 0 Sources: US Energy Information Administration; Rocky Mountain Institute
Natural Gas Overview
Power Shopping A variety of distributed-generation technologies are available or under development. Costs of producing power can vary widely, depending on location, size, use and fuel prices, but here are estimates: Technology Description Cost* Photovoltaics (solar panels) Wind turbines Diesel generators Microturbine Converts sun lights into electricity Wind blades power electricity-producing turbines Similar to truck engines, also run on natural gas Scaled-down jet engines that run on natural gas, methane or waste gases Chemical reaction produces electricity and water 22 -40 cents 4 -28 cents 7 -12 cents Fuel cells 7 -10 cents No commercial production * Per kilowatt-hour, without subsidies. For comparison, the average U. S. retail electricity price earlier this year 6. 9 cents per kwh. Source: Department of Energy; National Renewable Energy Laboratory; American Wind Energy Association; manufacturers From WSJ, Sept 17, 2001 Think Small by Robert Gavin
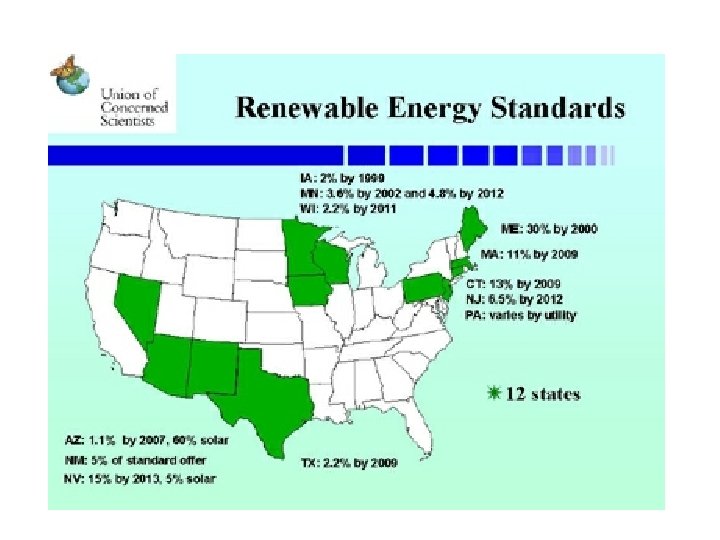
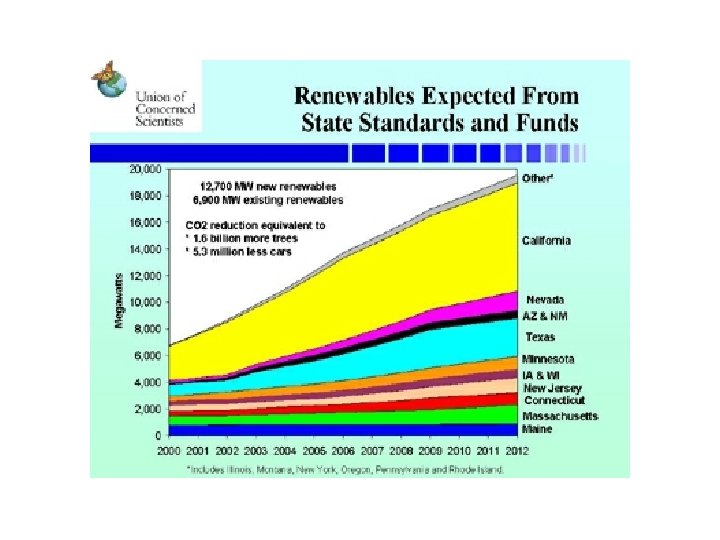
Marketing Renewables • Life cycle analysis/resource equity – Goal of true cost of all energy sources – Level playing field • Co-generation – How/should/could renewables integrate with fossil fuels – Production, storage, utilization issues – Scale issues (distributed energy) • Energy price and supply – Conservation, efficiency, volatility, reliability, technology – BP(solar), Shell(hydrogen, geothermal), Texaco(fuel cells) – Choice, diversity
Food for Thought • 40% of world not on grid (>2 billion people) • Increased energy demand in China (5 -8%/yr) • 20, 000 gas wells drilled in US last 12 mos; deliverability increased by 4% • What happens when the world economy recovers? Demand>supply
World Consumption of End-Use Fuels, % 1997 5, 808 Mtoe 11 Coal 8 1 Renewables 2 4 Heat 3 17 Electricity 20 18 Gas 18 49 Oil 49 * Million tonnes of oil equivalent 2020 Forecast 9, 117 Mtoe* Source: International Energy Agency