
Electrical Tests on Ga N devices Giorgio Spiazzi

- Slides: 22
Electrical Tests on Ga. N devices Giorgio Spiazzi University of Padova Dept. of Information Engineering – DEI
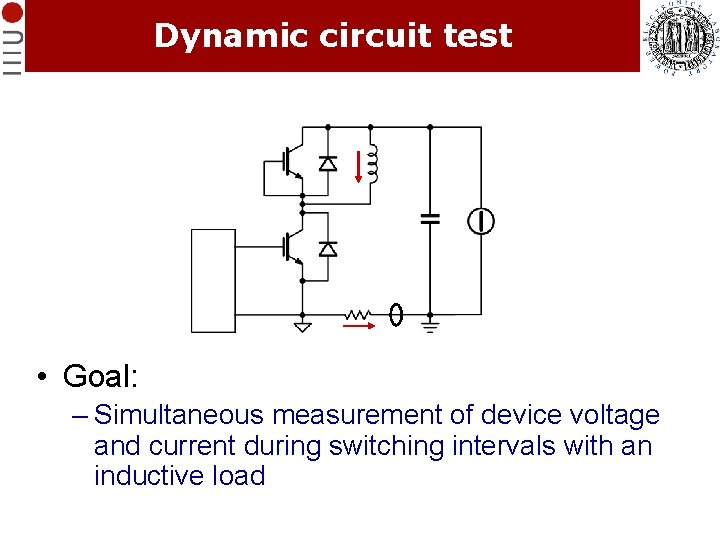
Dynamic circuit test • Goal: – Simultaneous measurement of device voltage and current during switching intervals with an inductive load
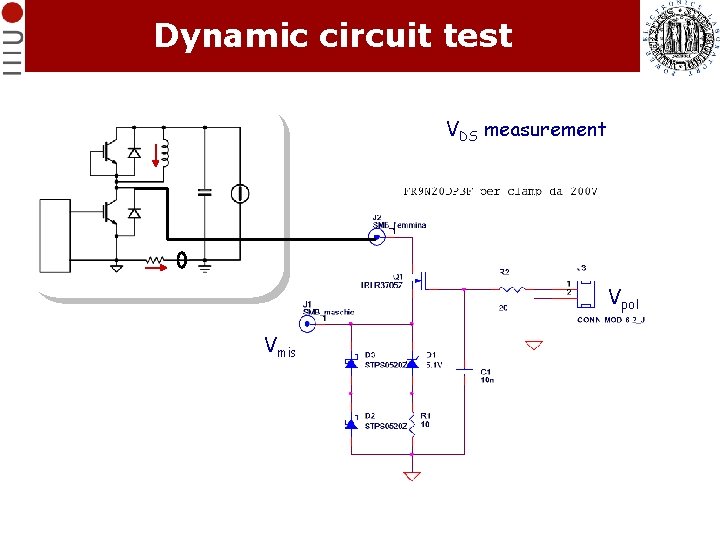
Dynamic circuit test VDS measurement Vpol Vmis
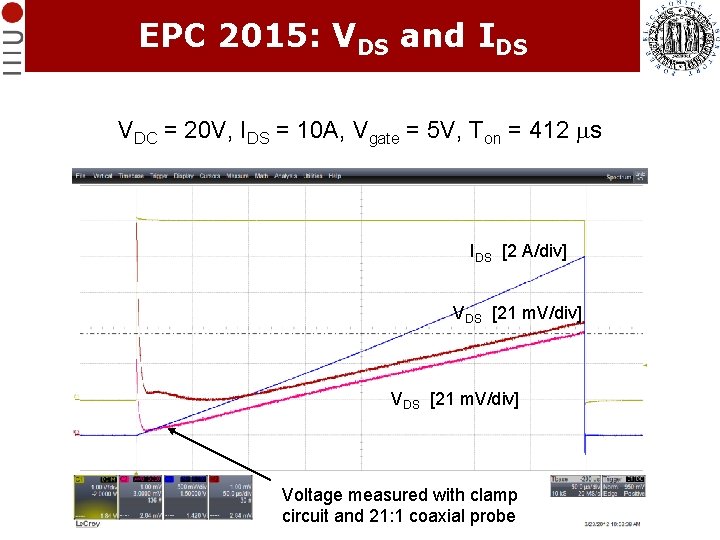
EPC 2015: VDS and IDS VDC = 20 V, IDS = 10 A, Vgate = 5 V, Ton = 412 ms IDS [2 A/div] VDS [21 m. V/div] Voltage measured with clamp circuit and 21: 1 coaxial probe
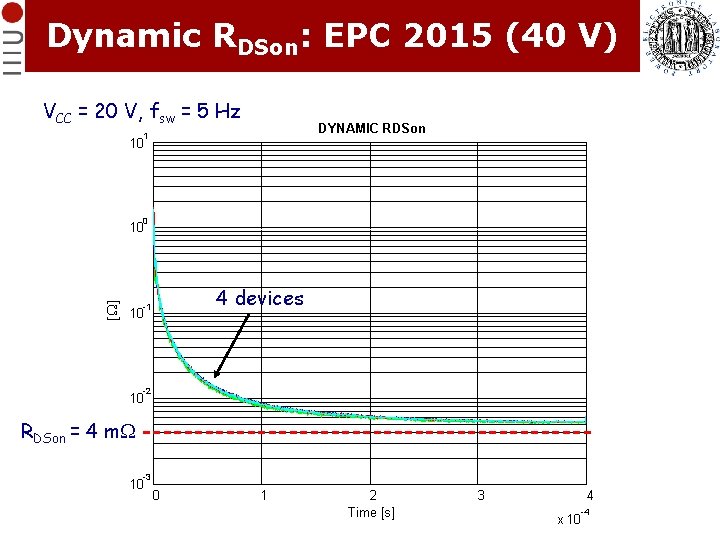
Dynamic RDSon: EPC 2015 (40 V) VCC = 20 V, fsw = 5 Hz DYNAMIC RDSon 1 10 0 [W] 10 4 devices -1 10 -2 10 RDSon = 4 m. W -3 10 0 1 2 Time [s] 3 4 -4 x 10
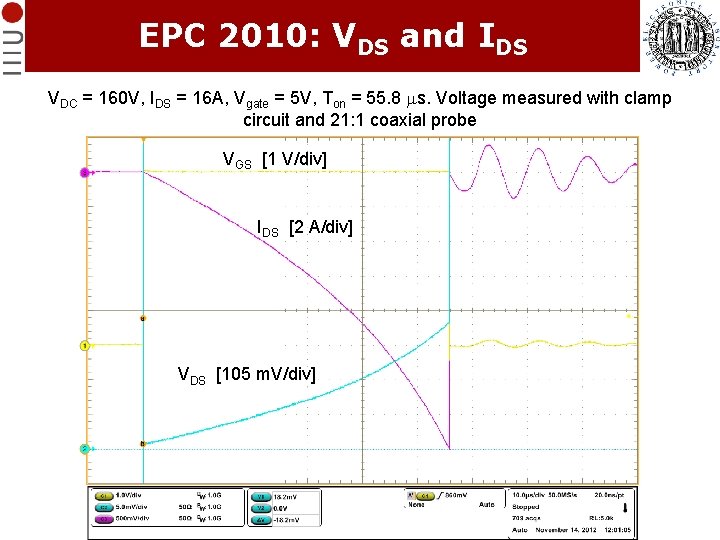
EPC 2010: VDS and IDS VDC = 160 V, IDS = 16 A, Vgate = 5 V, Ton = 55. 8 ms. Voltage measured with clamp circuit and 21: 1 coaxial probe VGS [1 V/div] IDS [2 A/div] VDS [105 m. V/div]
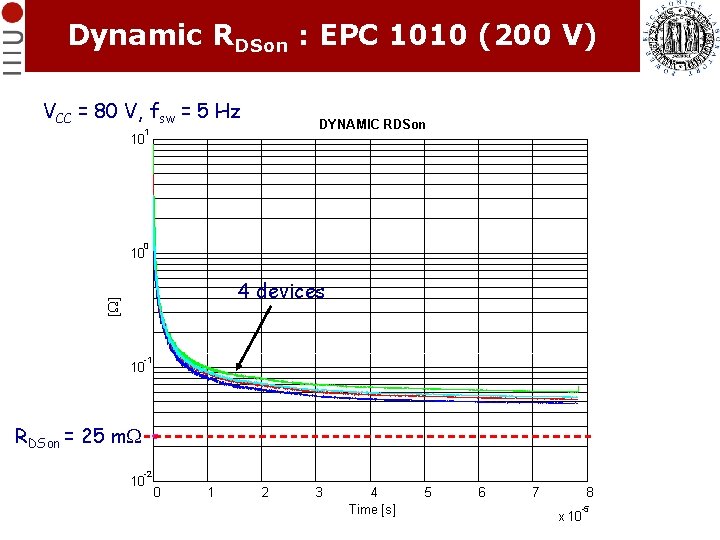
Dynamic RDSon : EPC 1010 (200 V) VCC = 80 V, fsw = 5 Hz DYNAMIC RDSon 1 10 0 10 [W] 4 devices -1 10 RDSon = 25 m. W -2 10 0 1 2 3 4 Time [s] 5 6 7 8 -5 x 10
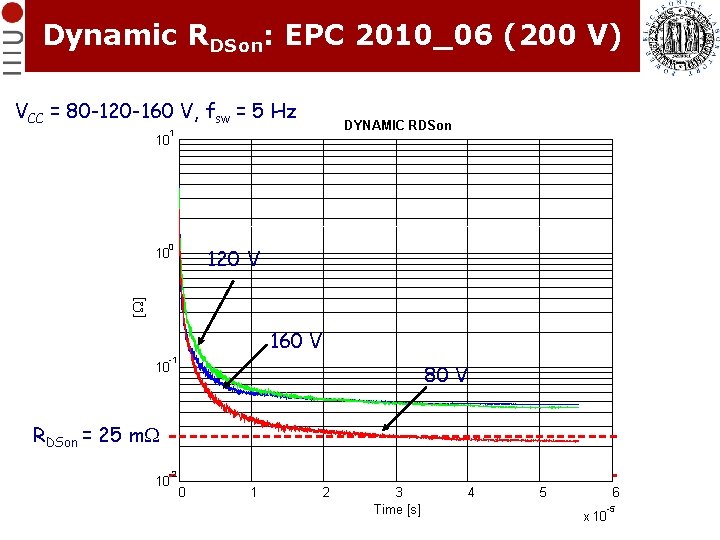
Dynamic RDSon: EPC 2010_06 (200 V) VCC = 80 -120 -160 V, fsw = 5 Hz DYNAMIC RDSon 1 10 0 120 V [W] 10 4 dispositivi 160 misurati V -1 80 V 10 RDSon = 25 m. W -2 10 0 1 2 3 Time [s] 4 5 6 -5 x 10
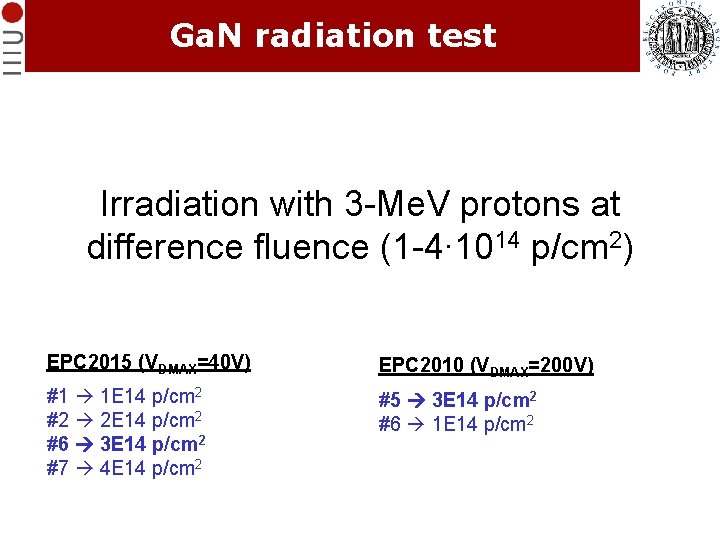
Ga. N radiation test Irradiation with 3 -Me. V protons at difference fluence (1 -4∙ 1014 p/cm 2) EPC 2015 (VDMAX=40 V) EPC 2010 (VDMAX=200 V) #1 1 E 14 p/cm 2 #2 2 E 14 p/cm 2 #6 3 E 14 p/cm 2 #7 4 E 14 p/cm 2 #5 3 E 14 p/cm 2 #6 1 E 14 p/cm 2
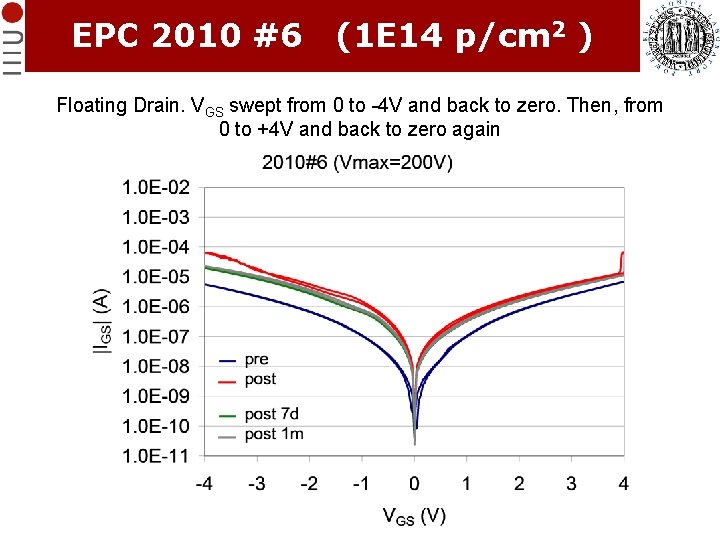
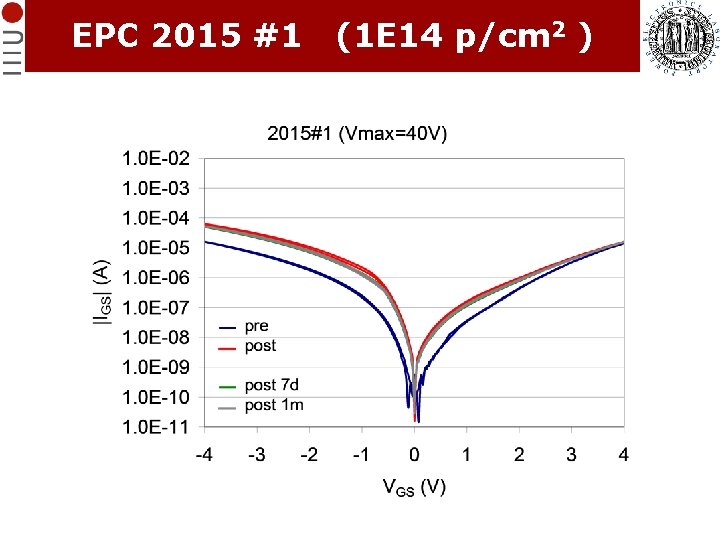
EPC 2010 #6 (1 E 14 p/cm 2 ) Floating Drain. VGS swept from 0 to -4 V and back to zero. Then, from 0 to +4 V and back to zero again
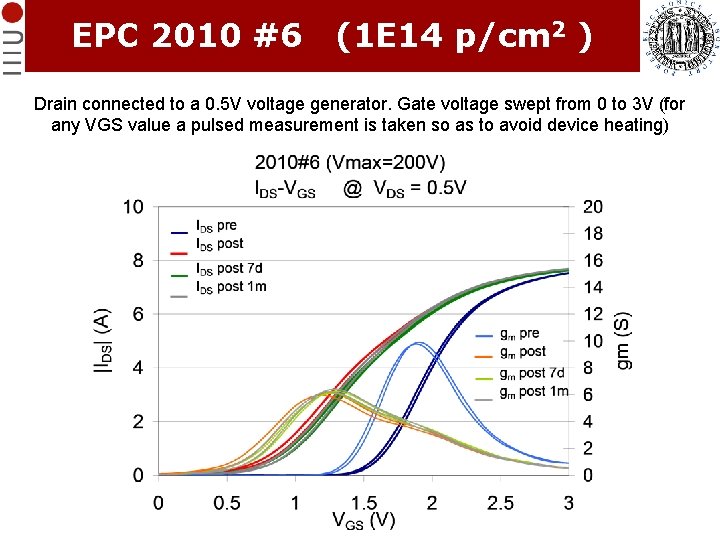
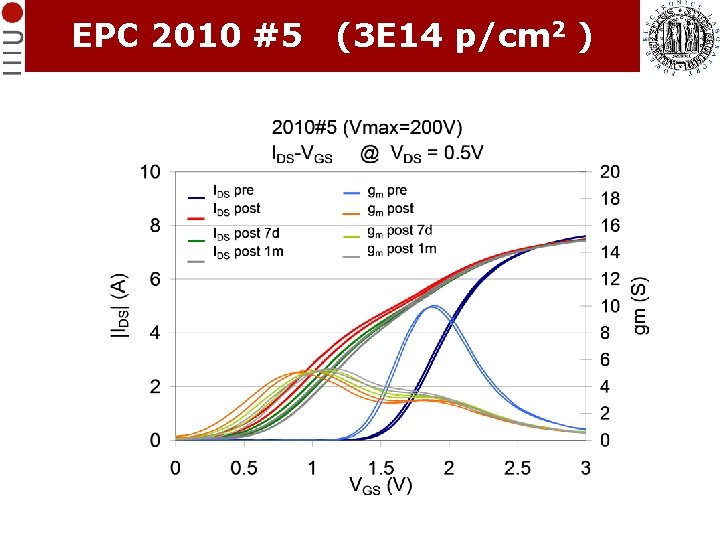
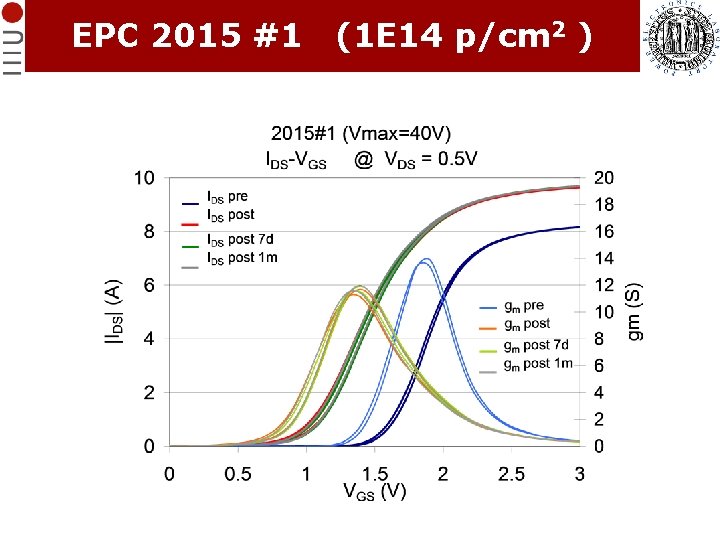
EPC 2010 #6 (1 E 14 p/cm 2 ) Drain connected to a 0. 5 V voltage generator. Gate voltage swept from 0 to 3 V (for any VGS value a pulsed measurement is taken so as to avoid device heating)
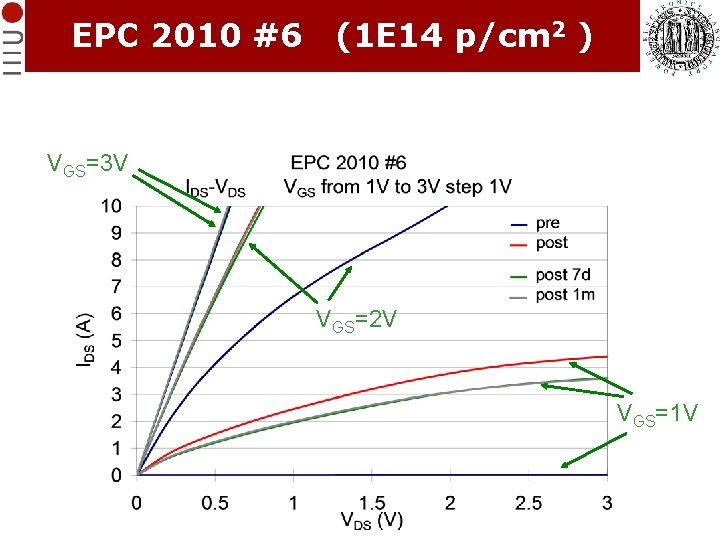
EPC 2010 #6 (1 E 14 p/cm 2 ) VGS=3 V VGS=2 V VGS=1 V
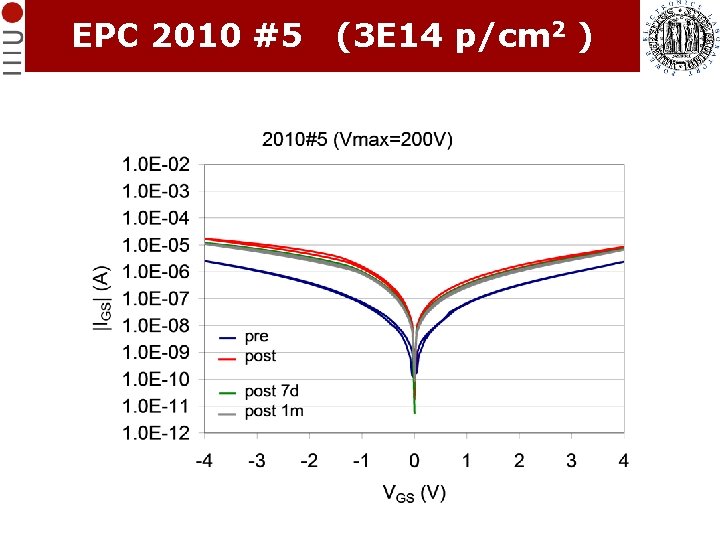
EPC 2010 #5 (3 E 14 p/cm 2 )
EPC 2010 #5 (3 E 14 p/cm 2 )
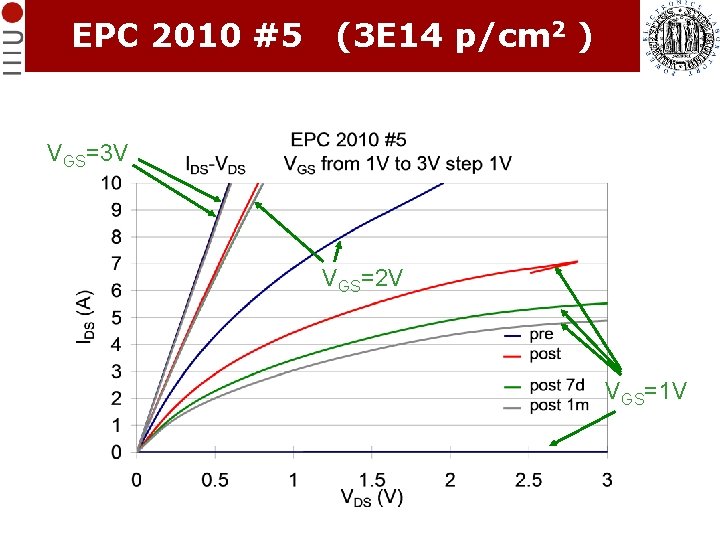
EPC 2010 #5 (3 E 14 p/cm 2 ) VGS=3 V VGS=2 V VGS=1 V
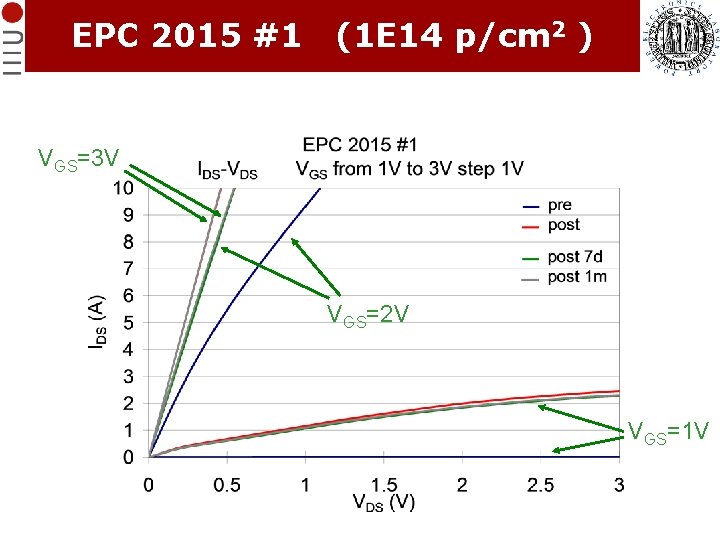
EPC 2015 #1 (1 E 14 p/cm 2 )
EPC 2015 #1 (1 E 14 p/cm 2 )
EPC 2015 #1 (1 E 14 p/cm 2 ) VGS=3 V VGS=2 V VGS=1 V
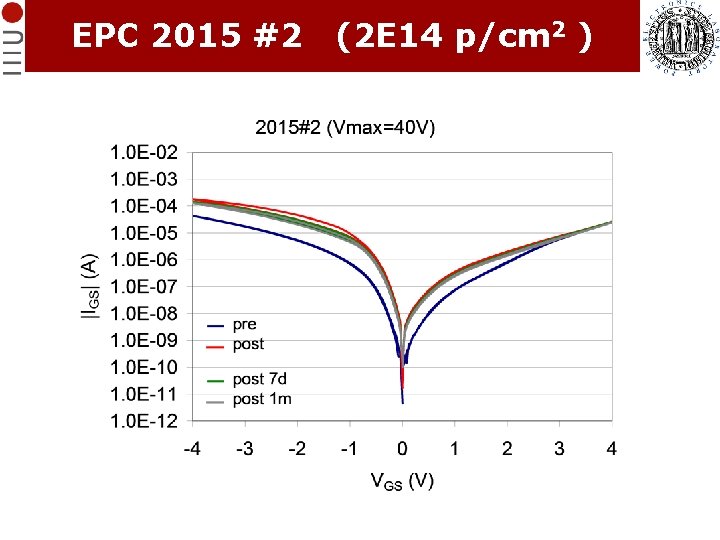
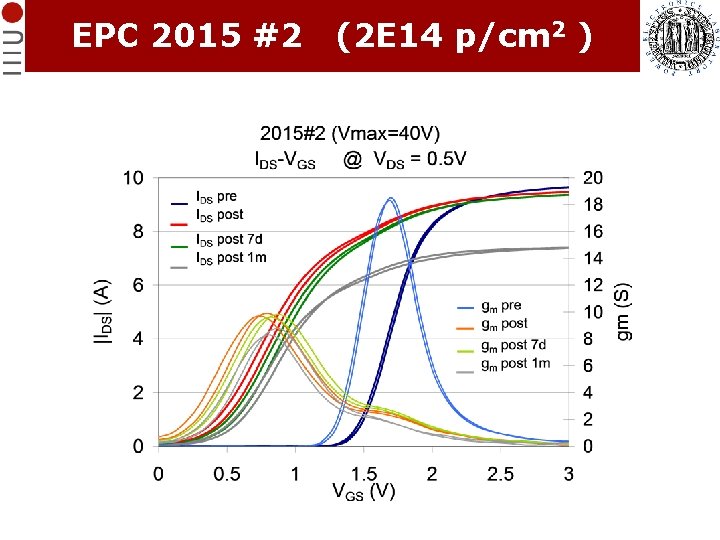
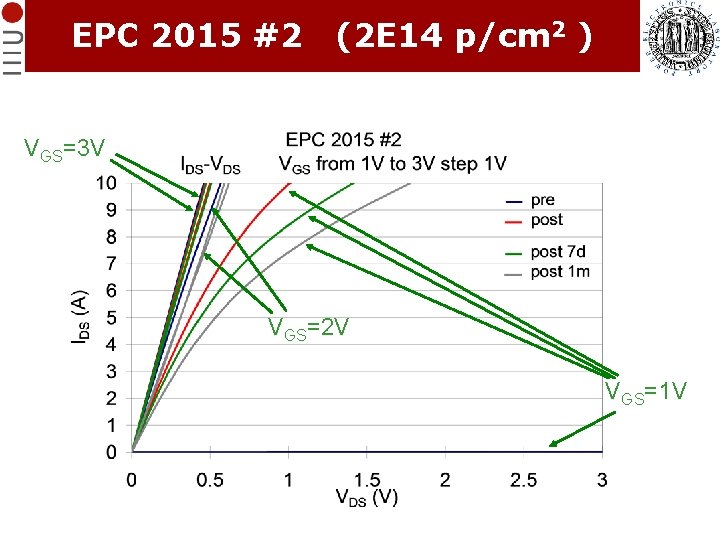
EPC 2015 #2 (2 E 14 p/cm 2 )
EPC 2015 #2 (2 E 14 p/cm 2 )
EPC 2015 #2 (2 E 14 p/cm 2 ) VGS=3 V VGS=2 V VGS=1 V
Irradiation results After irradiation with 3 -Me. V protons at the highest fluence (4∙ 1014 p/cm 2), the devices exhibited an increase of up to one order of magnitude in gate leakage, almost 1 V of threshold voltage reduction, degradation of the subthreshold slope, and drop in transconductance