Electrical Events of the Cardiac Cycle Electrophysiology Dr


![Mechanical Events of the Cardiac Cycle Ventricular Filling Period [ventricular diastole, atrial systole] 2.](https://slidetodoc.com/presentation_image_h/9de290a054acf7c165160502e7b0b28f/image-3.jpg "Mechanical Events of the Cardiac Cycle Ventricular Filling Period [ventricular diastole, atrial systole] 2.")


 node is the normal pacemaker of")
 l Intra-atrial Pathways l Atrioventricular node")


")

")
")
")
")
")


![LV hypertrophy Parameter Sokolow-Lyon index Romhilt-Estes point score system (points)[*] Criteria SV 1 +](https://slidetodoc.com/presentation_image_h/9de290a054acf7c165160502e7b0b28f/image-84.jpg "LV hypertrophy Parameter Sokolow-Lyon index Romhilt-Estes point score system (points)[*] Criteria SV 1 +")


- Slides: 100
üElectrical Events of the Cardiac Cycle Electrophysiology Dr. s. a. moezzi
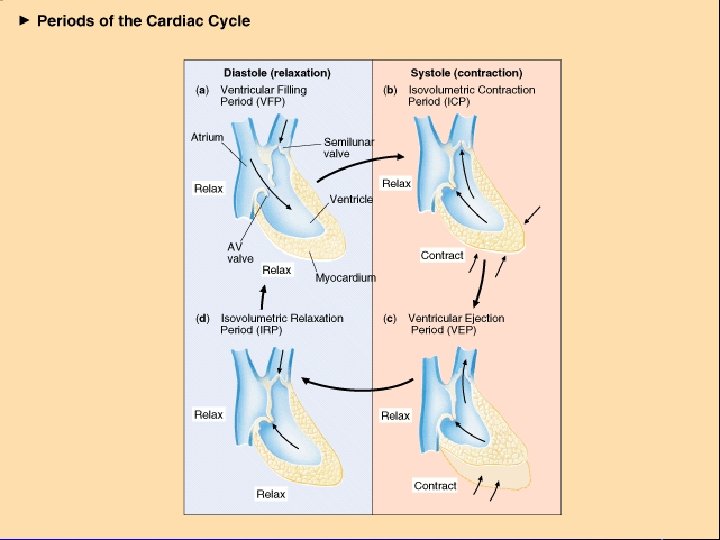
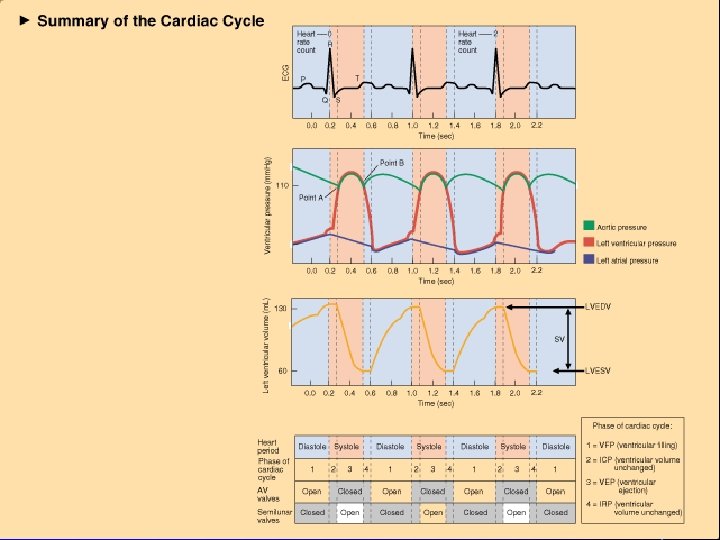
Cardiac Cycle: the electrical, pressure and volume changes that occur in a functional heart between successive heart beats. • Phase of the cardiac cycle when myocardium is relaxed is termed diastole. • Phase of the cardiac cycle when the myocardium contracts is termed systole. – Atrial systole: when atria contract. – Ventricular systole: when ventricles contract.
Mechanical Events of the Cardiac Cycle Ventricular Filling Period [ventricular diastole, atrial systole] 2. Isovolumetric Contraction Period [ventricular systole] 3. Ventricular Ejection Period [ventricular systole] 4. Isovolumetric Relaxation Period [ventricular diastole, atrial diastole] 1.
Cardiac Cycle l Electrical changes in heart tissue cause mechanical changes, i. e. muscle contraction. l Thus, changes in electrical membrane potential of specific parts of the heart tissue represent mechanical events in specific areas of the heart tissue.
Electrical System of Heart
Electrocardiography l Two common abbreviations for electrocardiogram: EKG and ECG. l EKG comes from German language where cardiogram is written as kardiogram. l The ECG records the electrical activity of the heart. l Mechanical activity of the heart is sensed by echocardiography.
Electrophysiology l If an electrode is placed so that wave of depolarization spreads toward the recording electrode, the ECG records a positive (upward) deflection. l If wave of depolarization spreads away from recording electrode, a negative (downward) deflection occurs.
Electrophysiology
Electrophysiology
Electrophysiology
Electrophysiology l When myocardial muscle is completely polarized or depolarized, the ECG will not record any electrical potential but rather a flat line, isoelectric line. l After depolarization, myocardial cells undergo repolarization to return to electrical state at rest.
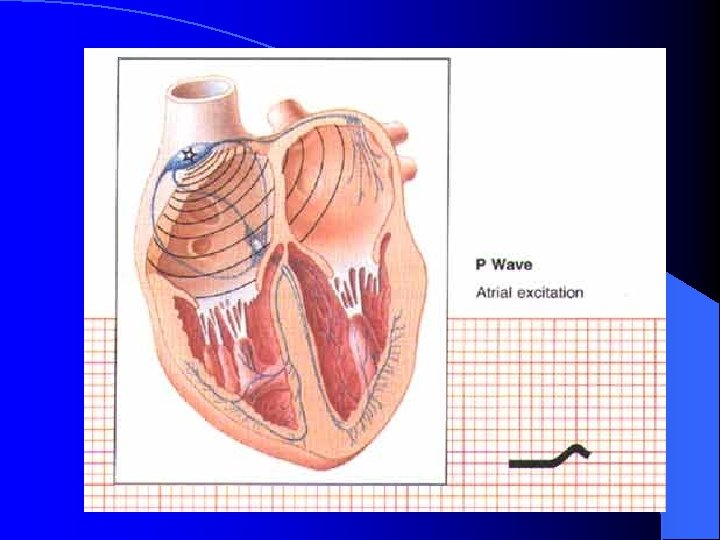
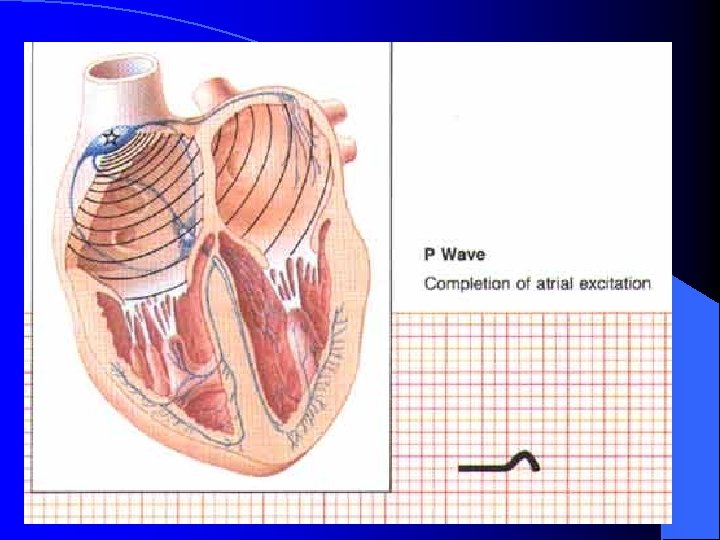
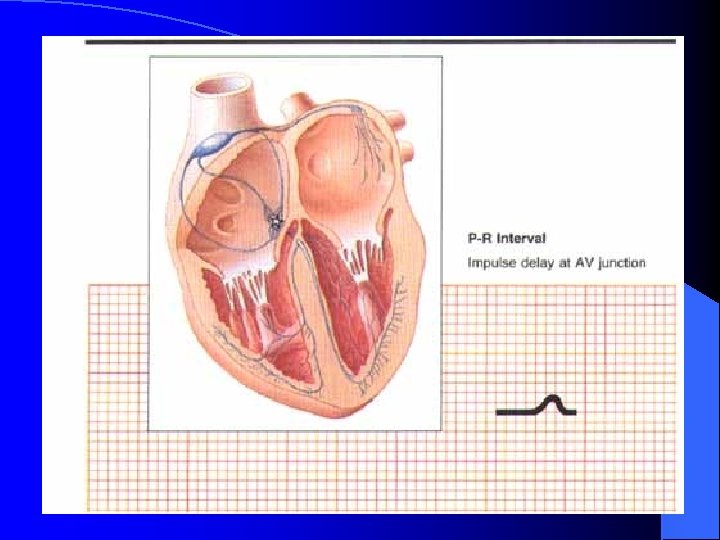
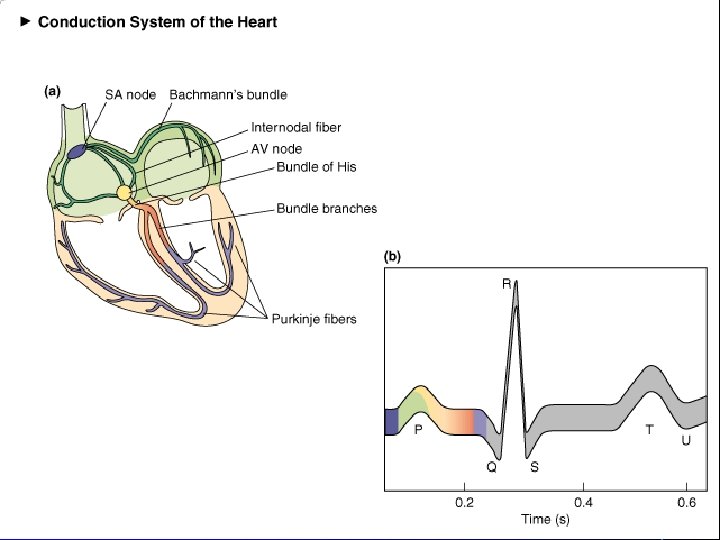
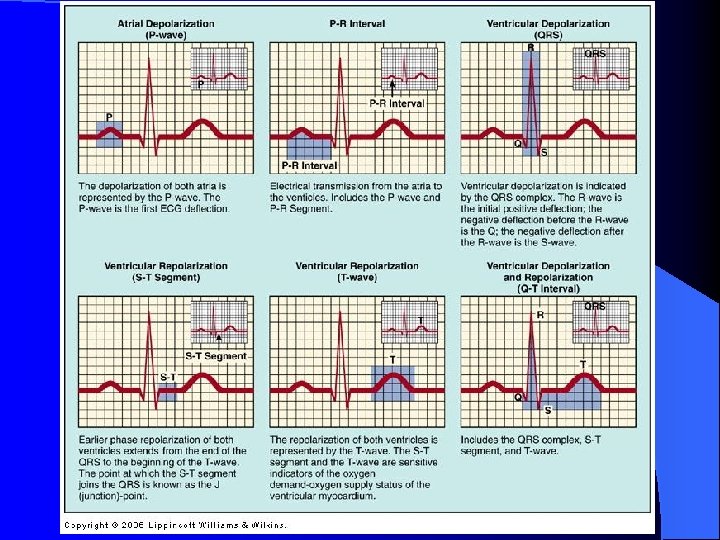
Electrical Events of the Cardiac Cycle Sinoatrial (SA) node is the normal pacemaker of heart and is located in right atrium. • Depolarization spreads from SA node across atria and results in the P wave. • Three tracts within atria conduct depolarization to atrioventricular (AV) node. • • Conduction slows in AV node to allow atria to empty blood into ventricles before vent. systole. Bundle of His connects AV to bundle branches. • Purkinje fibers are terminal bundle branches. •
Electrical Conduction System l Sinoatrial node (SA node) l Intra-atrial Pathways l Atrioventricular node (AV node) l Bundle of His l Left and Right Bundle Branches l Purkinjie Fibers
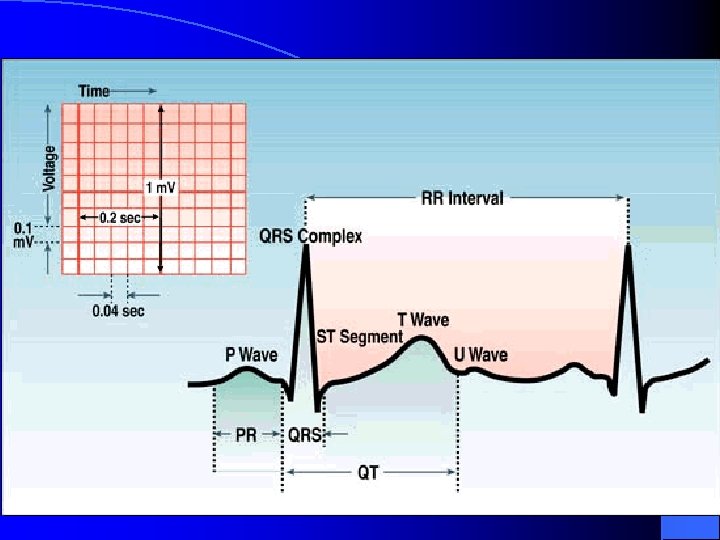
The P wave l The first wave form is called a P wave: it represents Atrial depolarization. l It is gently rounded, and not larger than 2 -3 mm. l It is usually positive (above the isoelectric line) l It should not be large, notched, or peaked
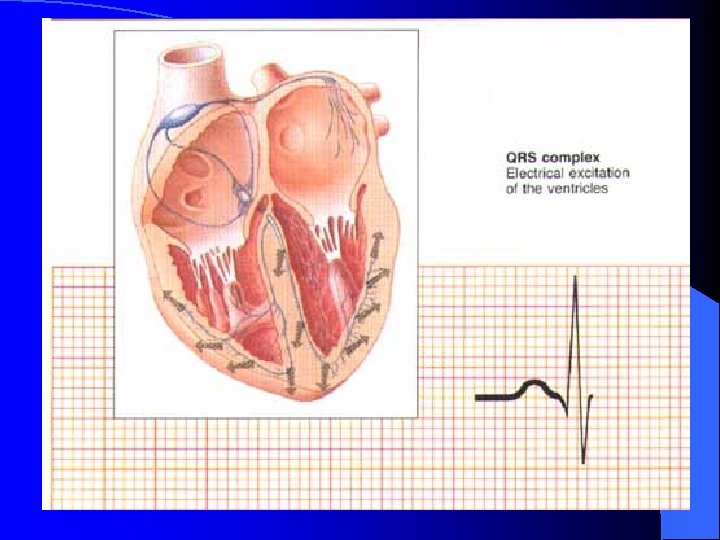
The QRS Complex l l l The QRS complex represents ventricular depolarization. The Q wave is the first negative deflection. It should not be greater than 1 mm wide or larger than 1/3 height of R wave. The R wave is the first positive deflection after the Q wave. The S wave is the first negative deflection after the R wave The normal QRS complex should be <. 12 sec.
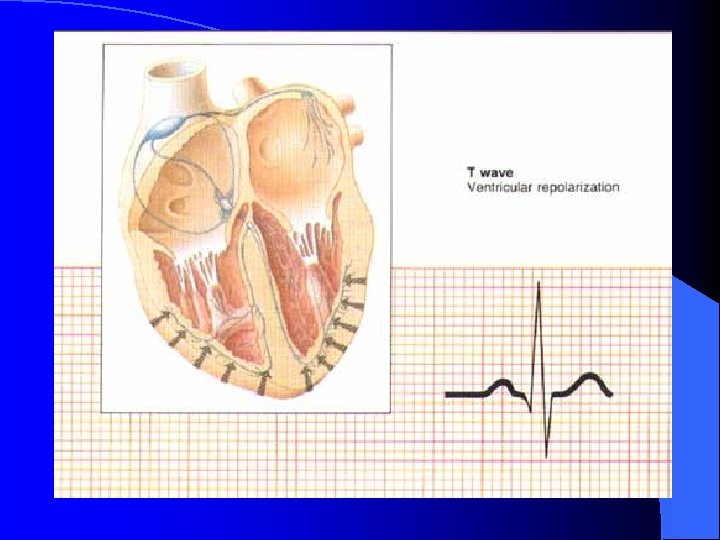
The T wave l The T wave represents ventricular repolarization. l It is usually positive, but can be negative or biphasic. l It is usually the same polarity as the QRS complex.
The PR Interval l The PR interval is measured from the beginning of the P wave to the beginning of the QRS complex. l The PR interal measures the beginning of atrial depolarization through the beginning of ventricular depolarization. l The normal PR interval is from. 12 -. 20 seconds.
The QT Interval l The QT interval is measured from the beginning of the Q wave to the end of the T wave. This measures ventricular depolarization and repolarization. l Any QT longer than. 50 seconds can predispose certain dangerous arrhythmias.
ST Segment The ST segment is measured from the end of the S wave to the beginning of the T wave. l The ST segment is normally isoelectric, or curves slightly upwards into the T wave. l Horizontal or downsloping ST depression of 2 mm or more is abnormal, indicating ishemia. l ST segment elevation > 1 mm indicates myocardial infarction l
ECG Time & Voltage • • • ECG machines can run at 50 or 25 mm/sec. Major grid lines are 5 mm apart; at standard 25 mm/s, 5 mm corresponds to. 20 seconds. Minor lines are 1 mm apart; at standard 25 mm/s, 1 mm corresponds to. 04 seconds. Voltage is measured on vertical axis. Standard calibration is 0. 1 m. V per mm of deflection.
Components of a NSR
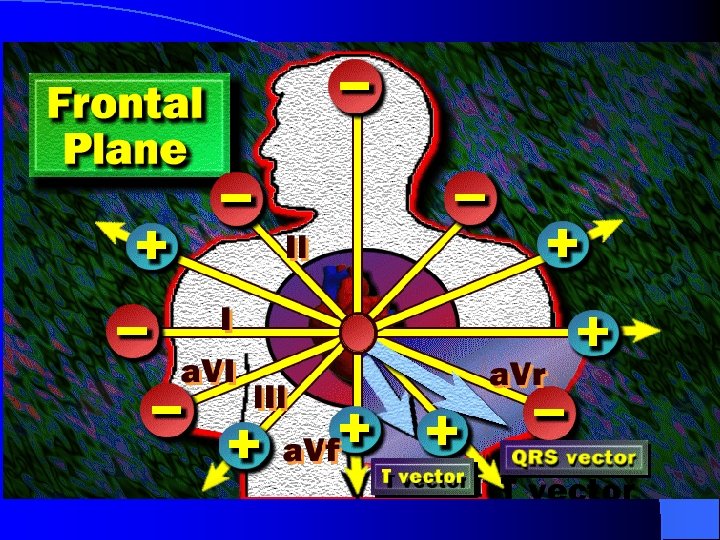
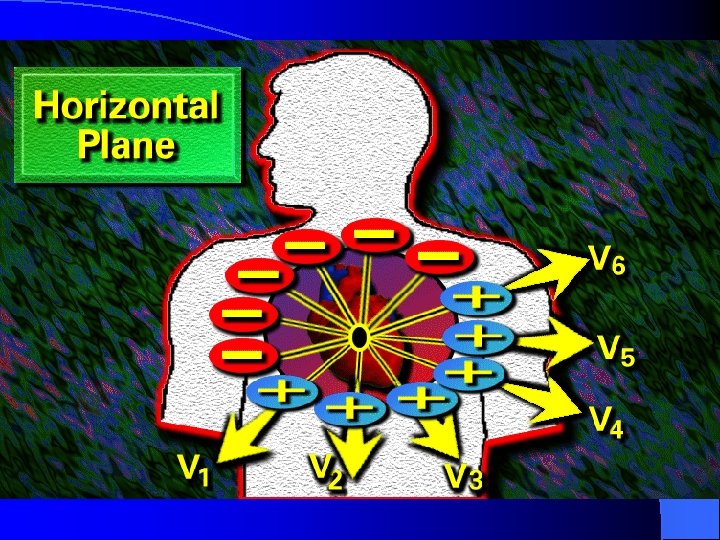
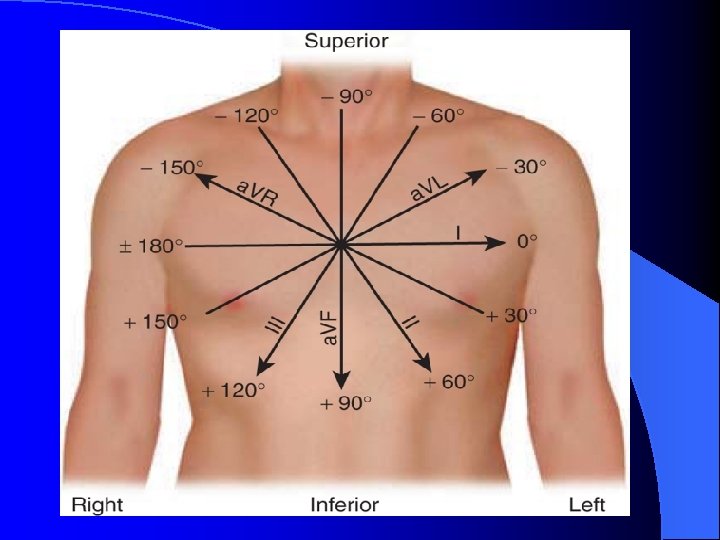
Standard 12 -Lead ECG l Usually performed when person is resting in supine position. Ø three bipolar limb leads: I, II, and III; Ø three augmented voltage leads: a. VR, a. VL, a. VF; Ø six precordial leads: V 1 – V 6. l All limb leads lie in frontal plane. l Chest leads circle heart in transverse plane.
ECG Limb Leads
ECG Augmented Limb Leads
ECG Precordial Leads
Standard 12 -Lead ECG Each lead provides a different electrical angle or picture of the heart. l Anterior part of heart by looking at V 1 – V 4. l Lateral view of heart: I, a. VL, V 5 and V 6. l Inferior view of heart: II, III, and a. VF. l
Exercise 12 -Lead ECG
12 -Lead ECG Limb lead II shows large R amplitude because left ventricle current vector lies parallel with electrode placement. l Chest lead V 1 has large S wave because left ventricle current vector is directed away from electrode. l
12 -Lead ECG Strip
What types of pathology can we identify and study from EKGs? l Arrhythmias l Myocardial ischemia and infarction l Pericarditis l Chamber hypertrophy l Electrolyte disturbances (i. e. hyperkalemia, hypokalemia) l Drug toxicity (i. e. digoxin and drugs which prolong the QT interval)
Interpretation of ECG: Rate First measurement to calculate is heart rate. PQRST waves represent one complete cardiac cycle. 1. At standard paper speed, divide 1500 by distance between R to R waves. 2. Find R wave on heavy line. Count off 300, 150, 100, 75, 60 for each following line. Where next R lands is quick estimate. 3. Multiply number of cycles in 6 second marks by 10.
The Rule of 300 It may be easiest to memorize the following table: # of big boxes 1 Rate 2 150 3 100 4 75 5 60 6 50 300
Interpretation of ECG: Rate
10 Second Rule As most EKGs record 10 seconds of rhythm per page, one can simply count the number of beats present on the EKG and multiply by 6 to get the number of beats per 60 seconds. This method works well for irregular rhythms.
What is the heart rate? The Alan E. Lindsay ECG Learning Center ; http: //medstat. med. utah. edu/kw/ecg/ 33 x 6 = 198 bpm
Precordial Leads
Summary of Leads Bipolar Limb Leads Precordial Leads I, III - (standard limb leads) Unipolar a. VR, a. VL, a. VF (augmented limb leads) V 1 -V 6
Arrangement of Leads on the EKG
Anatomic Groups (Septum)
Anatomic Groups (Anterior Wall)
Anatomic Groups (Lateral Wall)
Anatomic Groups (Inferior Wall)
Anatomic Groups (Summary)
The QRS Axis The QRS axis represents the net overall direction of the heart’s electrical activity. Abnormalities of axis can hint at: Ventricular enlargement Conduction blocks (i. e. hemiblocks)
The QRS Axis By near-consensus, the normal QRS axis is defined as ranging from -30° to +90°. -30° to -90° is referred to as a left axis deviation (LAD) +90° to +180° is referred to as a right axis deviation (RAD)
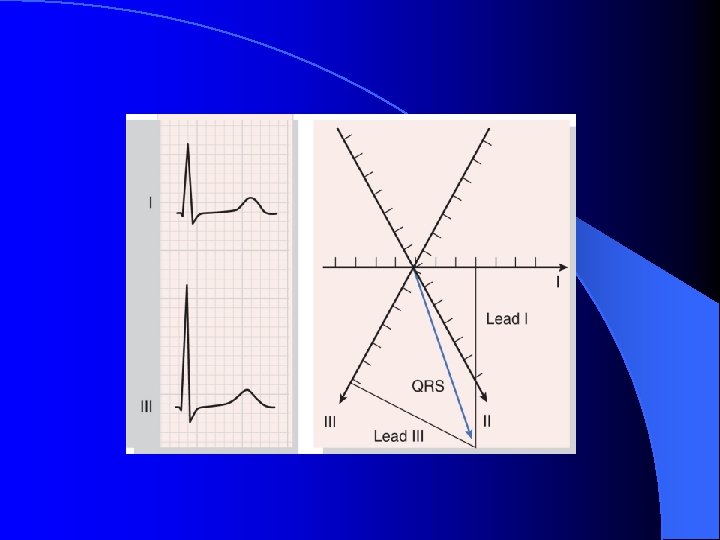
Quadrant Approach: Example 1
Quadrant Approach: Example 2
Equiphasic Approach: Example 2 The Alan E. Lindsay ECG Learning Center ; http: //medstat. med. utah. edu/kw/ecg/
Interpretation of ECG: Rhythm Normal heart rhythm has consistent R-R interval. • Mild variations due to breathing also normal. •
Interpretation of ECG: Rhythm Normal Sinus Rhythm • • • Rate: 60 -100 b/min Rhythm: regular P waves: upright in leads I, II, a. VF PR interval: <. 20 s QRS: <. 10 s Sinus Bradycardia Rate: < 60 bpm • Rhythm: regular • Sinus Tachycardia • Rate: > 100 bpm
AV Conduction Disturbances o Atrioventricular conduction disturbances refer to blockage of electrical impulse at AV node. o 1 st degree P waves result in delayed QRS. o 2 nd degree some but not all P waves have QRS.
Arrhythmias Arrhythmia: an irregular heartbeat. Sinus arrhythmia- P wave precedes @ QRS but RR interval varies. • Premature Atrial Contraction (PAC) • Premature Ventricular Contraction (PVC) •
Arrhythmias
Where is the Conduction Problem?
1 st Degree AV block
2 nd Degree AV block
2 nd Degree AV block
2 nd Degree AV block
3 rd Degree AV Block
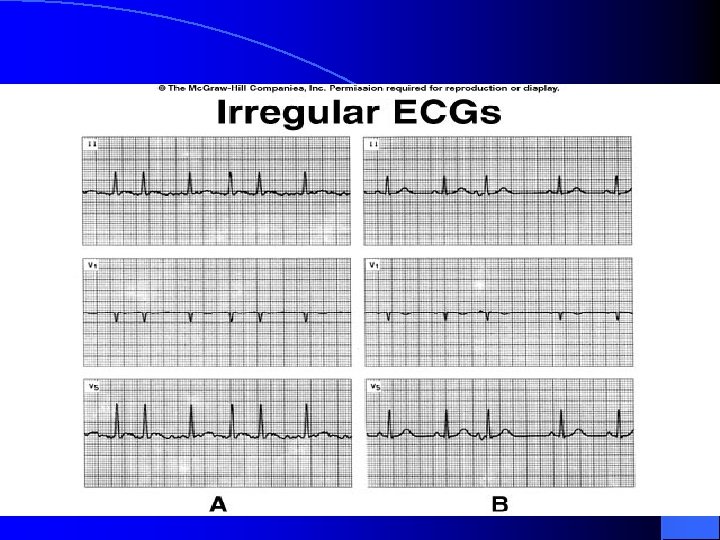
Atrial Fibrillation l Predominantly of left atrial origin l High rate of atrial activation (>300 bpm) l IRREGULAR VENTRICULAR RESPONSE – Filtering effect of the AV node – Protects the ventricle from high atrial rates – Explains why we “rate control” AF
Atrial Fibrillation
Atrial Fibrillation
Atrial Flutter
Narrow Complex tachycardia
Broad Complex Tachycardia
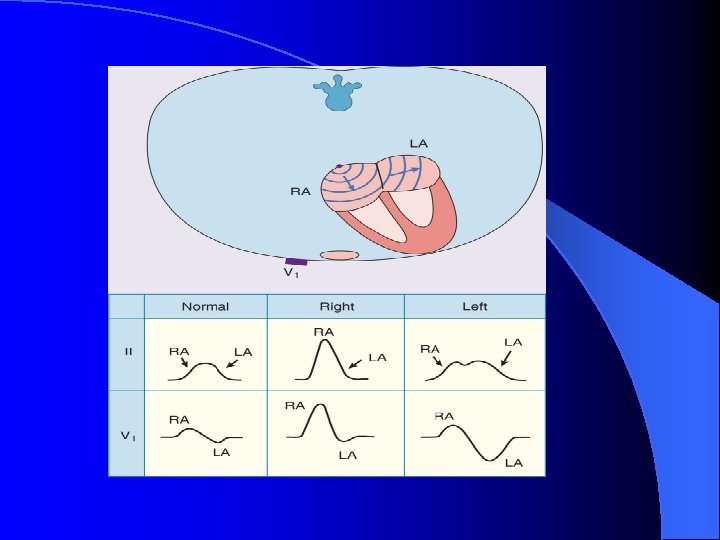
Left Atrial Abnormality Right Atrial Abnormality Prolonged P wave duration >120 msec in lead II Peaked P waves with amplitudes in lead II >0. 25 m. V (P pulmonale) Prominent notching of the P wave, usually most Rightward shift of the mean P wave axis to obvious in lead II, with an interval between the above +75 degrees notches of >40 (P mitrale) Ratio between the duration of the P wave in lead Increased area under the initial positive portion II and the duration of the PR segment >1. 6 of the P wave in lead V 1 to >0. 06 mm-sec Increased duration and depth of the terminal negative portion of the P wave in lead V 1 (the P terminal force) so that the area subtended by it exceeds 0. 04 mm-sec Leftward shift of the mean P wave axis to between -30 and -45 degrees
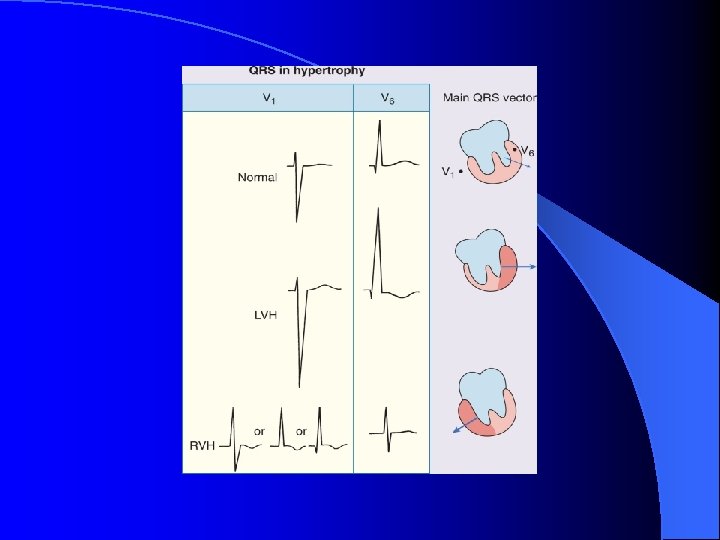
LV hypertrophy Parameter Sokolow-Lyon index Romhilt-Estes point score system (points)[*] Criteria SV 1 + (RV 5 or RV 6) > 3. 5 m. V Ra. VL > 1. 1 m. V Any limb lead R wave or S wave ≥ 2. 0 m. V (3) or SV 1 or SV 2 ≥ 3. 0 m. V (3) or RV 5 to RV 6 ≥ 3. 0 m. V (3) ST-T wave abnormality (no digitalis therapy) (3) ST-T wave abnormality (digitalis therapy) (1) Left atrial abnormality (3) Left axis deviation ≤ -30 degrees (2) QRS duration >90 msec (1) Intrinsicoid deflection in V 5 or V 6 > 50 msec (1) Cornell voltage criteria SV 3 + Sa. VL ≥ 2. 8 m. V (for men) SV 3 + Sa. VL ≥ 2. 0 m. V (for women) Cornell voltage-duration measurement QRS duration × Cornell voltage >2436 QRS duration × sum of voltages in all leads >17, 472
LV hypertrophy
RV hypertrophy
REST
Action potential & Ischemia
Ischemia
Ant. STEMI
ANT. & INF. STEMI
ACUTE PERICARDITIS
Problems with ECG recording l Patient identity l Lead position l Paper speed and amplification l Artifact l Misinterpretation is much more common than poor recording technique.
Patient Identity
Lead Position
Paper Speed
Signal Amplification
Artifact
Artifact