Electric Vehicle Charging Background Metropolitan Mayor Caucus Environmental

Electric Vehicle & Charging Background Metropolitan Mayor Caucus Environmental Committee October 29, 2018
 Electricity from domestic sources")
System Level Challenges Opportunities with EVs Fuel Diversity (petroleum independence) Electricity from domestic sources Global Climate Change Reduced Lifecycle GHG Local Air Quality Lower or Zero Tailpipe Emissions Economic Development Technology Innovation, Jobs, Cash Flow Electric Grid Management Optimize utilization of electrical power assets
 – Plug-in Hybrid Electric Vehicle (PHEV) aka Extended")
• Plug-in Electric Vehicles (PEV) – Plug-in Hybrid Electric Vehicle (PHEV) aka Extended Range Electric Vehicles (EREV) • Can run on electricity or internal combustion engine (ICE) • Primary power source is electricity • Internal combustion engine automatically engages when battery runs low • Zero tailpipe emissions when running on battery only • ICE feature alleviates range anxiety – All Electric Vehicle (AEV) aka Battery Electric Vehicles (BEV) • 100% electric battery powered • Range limited (Leaf: 150/Bolt: 240/Tesla: 310) – Constrained by battery • Zero tailpipe emissions • Quiet • Lower maintenance – PEVs Different from Hybrid Electric Vehicles (HEVs) • Petroleum primary with electric assist for efficiency

• Passenger EV Models: 26 PHEVs and 17 AEVs – w/ rebates, some are cost competitive with Internal Combustion Engine Vehicles (ICEVs) • SUVs/Vans – 4 PHEVs (<33 e-miles), 3 Tesla X models • Small, Medium and Large Trucks – – Several models available from Class 1 to 8 Combination of PHEVs and AEVs Most OEMs actively developing solutions Challenges with cost, range, payload, charge times, operational flexibility • E-buses – Appealing for schools and public transit: better air quality, less noise – Operation based charging – versatility, on route & dynamic charging, range planning
 • EVs Forecast")
• 250 MM total vehicles on the road globally (2017) • EVs Forecast – 3. 2 MM - Globally – 750, 000 - US • Several major cities, countries, automakers eliminating Internal Combustion Engine Vehicles (ICEVs) in next few years History Sources: Bloomberg New Energy Finance Statistica. com

Reducing Battery Costs • US DOE R&D • Supported significant battery cost reductions (3 X) since 2008 • Worked with OEMs universities, others • Goal: $100 -150/k. Wh by 2025 - basis for cost parity with ICEV Year https: //www. energy. gov/eere/vehicles/batteries SOURCES: ARB 2017; SOULOPOULOS 2017; VOELCKER 2017; SLOWIK, PAVLENKO, AND LUTSEY 2016; VOELCKER 2016; NYKVIST AND NILSSON 2015. 6

Reducing Other Costs • All components • Apply Innovation • Mature Supply chain management • Optimize production methods and leverage volume https: //www. energy. gov/sites/prod/files/ 2017/06/f 34/edt 000_boyd_2017_o. pdf Goals • Charge times <15 min • Range 300 miles • Cost parity with Internal Combustion Engine Vehicles by 2025, no incentives 7

Total AEVs PHEVs ~17 models avail. 2018 Tesla X and S BMW i 3 (~ 26 models avail. ) Porsche Panamera (16/480) BMW i 3 PHEV (97/180) BMW X 5 (16/480) Mitsubishi SUV (33/570) Chevy Volt (53/420) Leaf Ford Fusion (21/610) Prius (25/640) Chevy Bolt 2018 Tesla 3 Kia (26/560) Source Plugstar

Electric Only AEVs PHEVs BMW i 3 2018 Leaf 2018 Tesla X and S Chevy Bolt BMW i 3 PHEV Source Plugstar 2018 Tesla 3

Annual fuel costs are considerably lower for PEVs than for conventional counterparts Annual Fuel Costs Fusion ICE Fusion HEV Focus AEV Fusion Energy PHEV $0 $200 $400 $600 $800 $1, 000 $1, 200 $1, 400 $1, 600 $1, 800 $2, 000 $2, 200 Gas Electric *based on 15, 000 miles/year, OR averages of gasoline price of $2. 94/gallon and $0. 12/k. Wh of electricity 10
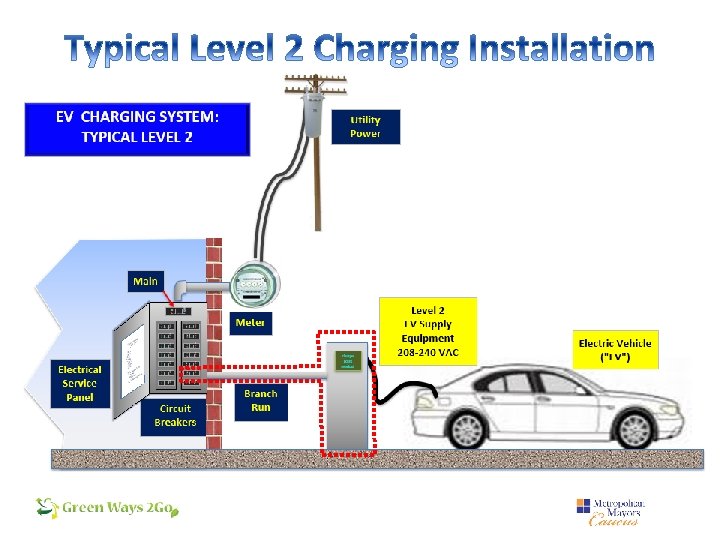
 • Level 1: 110 VAC in and")
• Electric Vehicle Supply Equipment (EVSE) • Level 1: 110 VAC in and out of charging • Level 2: 208/240 VAC in and out of charging • Level 3: 480+ VAC • AC into charging station • DC out of charging station = DC Fast Charger

EV Charging Summary • 3 standard charging power levels: • Level 1: home/mobile – overnight charging • Level 2: public, fleet, workplace or home • Level 3: retail or fleet, aka “DC Fast Charging” top off in 10 -20 minutes • Charge time depends on EV Charging Station power, EV battery capacity and battery power management • EV Supply Equipment (EVSE) = Charging Station • Networked or non-networked • Networking (wireless, cloud-based) allows GPS location, reservations, reporting and automated billing • Non-networked – only locally controls power • Conductive (corded) or Inductive (plugless) • Single or multiple

• Level 1: 1 to 2 k. W • Level 2: 3. 3 to 19 k. W • Level 3: 10 - 350 k. W and up k. W= kilowatt

Charge Point Level 2 Chargers Owned by Municipalities EV Charging Station Owners Types of Users Workplace Employees Business and public fleets Batavia Glen Ellyn Carol Stream Park District Kane County Forest Preserve District Chicago Highland Park Retail Patrons Des Plaines Kane County Professional Offices Patrons, employees Parking Garages Patrons Du. Page County Lake County Elgin Lake Forest Public parking lots General public Elmhurst St. Charles Health Care Patrons, employees Evanston Oak Park Residential EV Owners Frankfort Park Forest Franklin Park Skokie Wheeling

US DOE Alt Fuel Data Center Charge. Point Mobile Apps Google Maps : “EV charger near me” Plug. Share Dashboard

• L 1: comes with EV, $150 to $400 to buy Cost of EVSE and Installation, no rebates Level Residential Non-Residential 2 (240 V) $1, 000 to $2, 500 $2, 000 to $20, 000 Level Residential Single Multiple Large Transit System 3 (480 V) N/A $50, 000 to $80, 000 $100, 000 to $1, 000 > $1 million Key Variables: • • • Voltage Distance between power and EVSE Indoor vs. outdoor Type of EVSE Existing power capacity

• L 1 & L 2 – J 1772 – AC All Evs (Universal) • L 3 – Combo Charging System (“CCS”) - AC & DC Some BEVs • L 3 – CHAde. Mo – DC Some BEVs • L 3 – Tesla Supercharger- DC Tesla BEVs ONLY

Tesla Superchargers • Network: system of 480 volt DC fast-charging stations • 300 mile range from “empty” • 20 minutes 50% • 40 minutes 80% • 75 minutes 100%

• 50 to 600 k. W+ • Retail and e-Bus applications, maybe rail • Vehicle and charging designed to suit operations – Battery size – Recharge frequency and access to charging – Routes Depot Conductive On Route Inductive. Static Conductive Inductive Static Dynamic

Power plants Transmission lines Transformers Distribution /delivery lines Electrical service panels, breakers • Conduits and wiring • EV Supply Equipment (EVSE) • • • Local energy capacities (typ. ) – Homes – 10 to 50 k. W – Commercial Businesses – 50 to 500 k. W – Industrial Businesses – 100 to 5000+ k. W EV Charging Level 2 – typically <10 k. W Level 3 can be up to 150 k. W
")
• Current: Mainly use existing capacity of facility (e. g. spare circuit breakers) • Sometimes: need to transform power within facility or add capacity into facility • Coming: – Add more utility local high voltage power lines and supporting infrastructure, based on demand: at specific sites – Add more central and /or distributed generation capacity (renewable, micro power plants) – Smarter energy management – demand / time of use management, energy storage – Grid tied EV batteries- helps manage power assets

• If 10% vehicles are electric: Source: US EIA • Challenges: – Local capacities, distributed solutions – Leveraging new technologies to optimize

THANK YOU! Tim Milburn 847 -823 -9205 tim. milburn@greenways 2 go. com www. greenways 2 go. com
- Slides: 24