Ekonomi Manajerial dalam Perekonomian Global Bab 5 Peramalan

Ekonomi Manajerial dalam Perekonomian Global Bab 5 : Peramalan Permintaan Bahan Kuliah Program Pascasarjana-UHAMKA Program Studi Magister Manajemen Dosen : Dr. Muchdie, Ph. D in Economics Jam Konsultasi : Sabtu, 10. 00 -12. 00 Telp : 0818 -0704 -5737

Pokok Bahasan Peramalan Kualitatif : Survei & Jajak Pendapat Peramalan Kuantitatif : Analisis Deret Waktu Peramalan Kuantitatif : Teknik Penghalusan Peramalan Kuantitatif : Metode Barometrik Peramalan Kuantitatif : Model Ekonometrik Peramalan Kuantitatif : Peramalan Input-Output Ringkasan, Pertanyaan Diskusi, Soal-Soal dan Alamat Situs Internet • Studi Kasus Gabungan 2 : Mengestimasi dan Meramalkan Permintaan Listrik di Amerika Serikat • •

Qualitative Forecasts • Survey Techniques – Planned Plant and Equipment Spending – Expected Sales and Inventory Changes – Consumers’ Expenditure Plans • Opinion Polls – Business Executives – Sales Force – Consumer Intentions

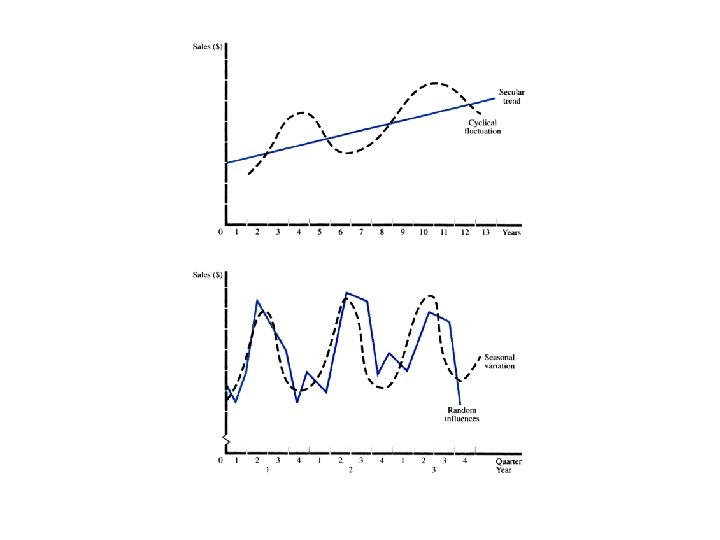
Time-Series Analysis • Secular Trend – Long-Run Increase or Decrease in Data • Cyclical Fluctuations – Long-Run Cycles of Expansion and Contraction • Seasonal Variation – Regularly Occurring Fluctuations • Irregular or Random Influences

Trend Projection • Linear Trend: St = S 0 + b t b = Growth per time period • Constant Growth Rate St = S 0 (1 + g)t g = Growth rate • Estimation of Growth Rate ln. St = ln. S 0 + t ln(1 + g)

Seasonal Variation Ratio to Trend Method Actual Trend Forecast Ratio = Seasonal Adjustment Adjusted Forecast = = Average of Ratios for Each Seasonal Period Trend Forecast Seasonal Adjustment

Seasonal Variation Ratio to Trend Method: Example Calculation for Quarter 1 Trend Forecast for 1996. 1 = 11. 90 + (0. 394)(17) = 18. 60 Seasonally Adjusted Forecast for 1996. 1 = (18. 60)(0. 8869) = 16. 50

Moving Average Forecasts Forecast is the average of data from w periods prior to the forecast data point.

Exponential Smoothing Forecasts Forecast is the weighted average of of the forecast and the actual value from the prior period.

Root Mean Square Error Measures the Accuracy of a Forecasting Method

Barometric Methods • • National Bureau of Economic Research Department of Commerce Leading Indicators Lagging Indicators Coincident Indicators Composite Index Diffusion Index
 Q X")
Econometric Models Single Equation Model of the Demand For Cereal (Good X) Q X = a 0 + a 1 P X + a 2 Y + a 3 N + a 4 P S + a 5 P C + a 6 A + e QX = Quantity of X PS = Price of Muffins PX = Price of Good X PC = Price of Milk Y = Consumer Income A = Advertising N = Size of Population e = Random Error

Econometric Models Multiple Equation Model of GNP Reduced Form Equation

Input-Output Forecasting Three-Sector Input-Output Flow Table

Input-Output Forecasting Direct Requirements Matrix Direct Requirements = Input Requirements Column Total

Input-Output Forecasting Total Requirements Matrix

Input-Output Forecasting Total Requirements Matrix Final Total Demand Vector =

Input-Output Forecasting Revised Input-Output Flow Table
- Slides: 19