Ejercicios de alineamiento de secuencias CLUSTALW insertar secuencias


 or transversion (V) b.")


 and transversions")

- Slides: 26
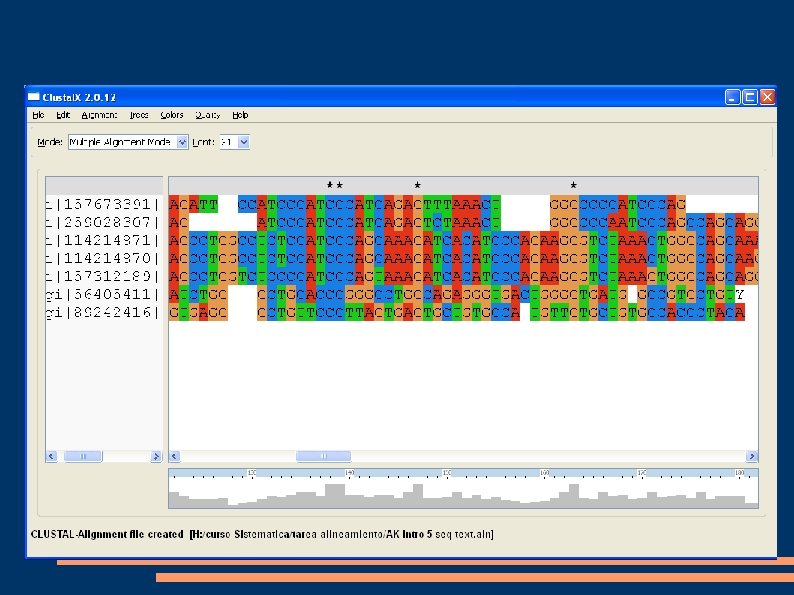
Ejercicios de alineamiento de secuencias: CLUSTALW insertar secuencias de FASTA
Pedir alineamiento múltiple
Analizar resultado
Regiones conservadas y variables en proteinas
Codones y aminoácidos
The 20 amino acids have overlapping properties Small change big change
c n e u q e fr n o ti tu ti s b u s e v Relati y Relationship between physico-chemical difference and relative substitution frequency Minor changes are more frequent Drastic changes are infrequent e c n re fe if d l a ic m e h -c o ic s Phy Kimura (1983) The neutral theory of molecular evolution.
Pseudogenes as a paradigm of neutral evolution Pseudogenes show an extremely high rate of nucleotide substitution. Li, Gojobori and Nei (1981) Nature 292: 237 -239
Conservation in a ‘typical’ gene Splice sites Start of translation Start of transcription Polyadenylation site On the basis of 3, 165 human-mouse pairs MGSC Nature (2002) 420 520 -562
Degeneracy of the Genetic Code nonsynonymous Each of the 61 sense codons can mutate in 9 different ways of the 549 possible changes are synonymous Colors represent amino acids 134
Synonymous changes can be neutral mutations • If most DNA changes were due to adaptive evolution than one would imagine that most changes would occur in the first and second codon positions. • If DNA divergence includes neutral mutations, then the third position should change more rapidly because synonymous mutations are more likely to be neutral. King, J. L. , and Jukes, T. H. 1969. Non-Darwinian evolution, Science 164, 788 -798.
Preponderance of changes in the 3 rd position The first 220 nucleotides of human and mouse renin binding protein The third position of all codons are marked Of the 31 changes: 4 - 1 st position 4 - 2 nd position 23 - 3 rd position
Estimating separately the rate of synonymous change and non-synonymous change • KS = number of Synonymous substitutions per synonymous site • KA = number of non-synonymous (Altering) substitutions per non-synonymous site One way of estimating Ks and Ka would be to examine each change individually and check if it is synonymous or not. In the following we present a method for doing this in a systematic manner.
Nucleotide sites can be classified into 3 types of degenerate sites 2 -fold Degenerate changes of this nucleotide relate to pairs of codons for the same AA 4 -fold degenerate – changes of this nucleotide relate to 4 codons for the same AA (AA = amino acids) Synonymous - Altering 0 -fold degenerate no change at this nucleotide leaves coding for the same AA
4 -fold degenerate sites are found in 32 of the 3 rd position of 61 codon sites
2 -fold degenerate sites are found in 25 of the 3 rd positions and 8 of the 1 st position
0 -fold degenerate sites are found in 2 nd position sites of all codons (61) and in of 53 of the 1 st position sites
Classify each site in a sequence according to the degeneracy of the sites. 002 002 004 004 202 002 002 204 004 202 000 002 204 004 002 002 004 004 - - - 002 004 004 - - - 002 202 004 004 000 002 202 002
Classify each site in a sequence according to the degeneracy of the sites. 000002002002204002004000002002004004004002002204002004004004 000002002002204002004000002002004004002002002204002004004002 Counting the number of 4 -, 2 -, 0 -fold sites (taking the average between the two sequences) L 0= (45+45)/2 = 45 L 2= (13+15)/2 = 14 L 4= (10+8)/2 = 9
Classify the differences with another sequence as a. transition (S) or transversion (V) b. degeneracy (0, 2, 4) 0 -fold 2 -fold 4 -fold transition S 0 S 2 S 4 transversion V 0 V 2 V 4
The key simplification is the special relationship between transition/transversion and degeneracy: Synonymous mutations 0 -fold 2 -fold 4 -fold transition S 0 S 2 S 4 transversion V 0 V 2 V 4 Non-synonymous mutations (Exceptions: 1 st position of arginine (CGA, CGG, AGA, AGG), last position of isoleucine (AUU, AUC, AUA)).
We distinguish between transitions and transversions according to the Kimura model A G = transitions = transversions C T
Use Kimura’s 2 -parameter model to estimate the numbers of transitions (Ai) and transversions (Bi) per i-th type site. Calculate the proportions of transitional and transversional differences: Pi = Si/Li (12/70) Qi = Vi/Li (3/70) Kimura model is used to correct for multiple hits: The Kimura model is similar to the Jukes-Cantor model (from the previous lecture) but also takes into consideration that transitions and transversions occur at different frequencies Ai = (1/2) ln (1/(1 - 2 Pi – Qi)) – (1/4) ln (1/(1 - 2 Qi)) Bi = (1/2) ln (1/(1 - 2 Qi)) (~6 times more transitions than transversions) (0. 242) (0. 045)
The Molecular Clock of Viral Evolution Different rates Relationship between the number of nucleotide substitutions and the difference in the year of isolation for the H 3 hemagglutinin gene of human influenza A viruses. All sequence comparisons were made with the strain isolated in 1968. Gojobori et al. 1990 PNAS 87 10015 -10018