
Eivind Almaas Microbial Systems Division Introduction to Biological
Eivind Almaas Microbial Systems Division Introduction to Biological Networks UC Davis, May 18 th 2006
Biological network examples • Gene-regulation • Protein interaction • Metabolism • Cell signaling • Cytoskeleton • … • Neural network • Lymphatic node system • Circulatory system
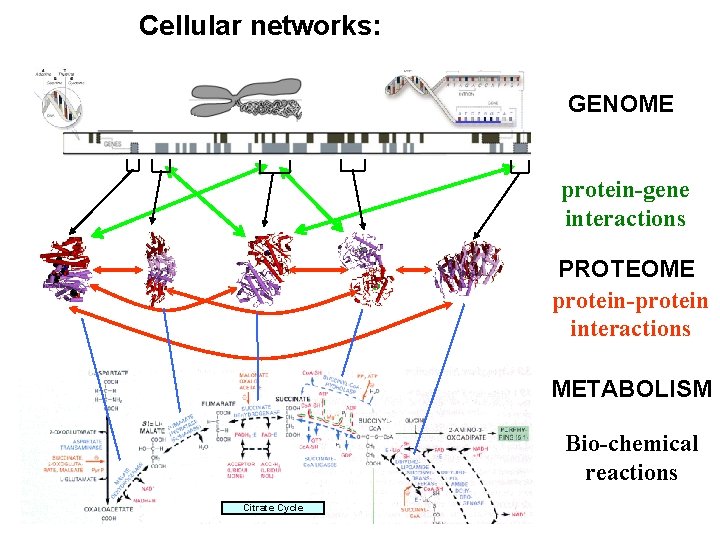
Cellular networks: GENOME protein-gene interactions PROTEOME protein-protein interactions METABOLISM Bio-chemical reactions Citrate Cycle
Protein Interaction Networks (PIN)
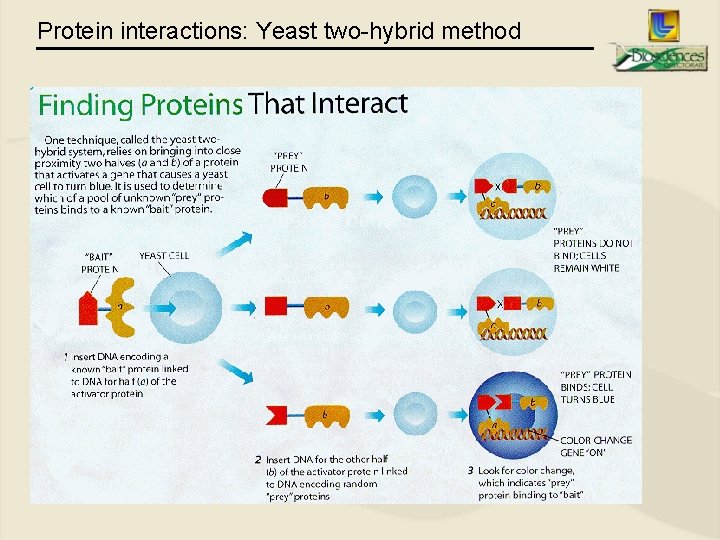
Protein interactions: Yeast two-hybrid method
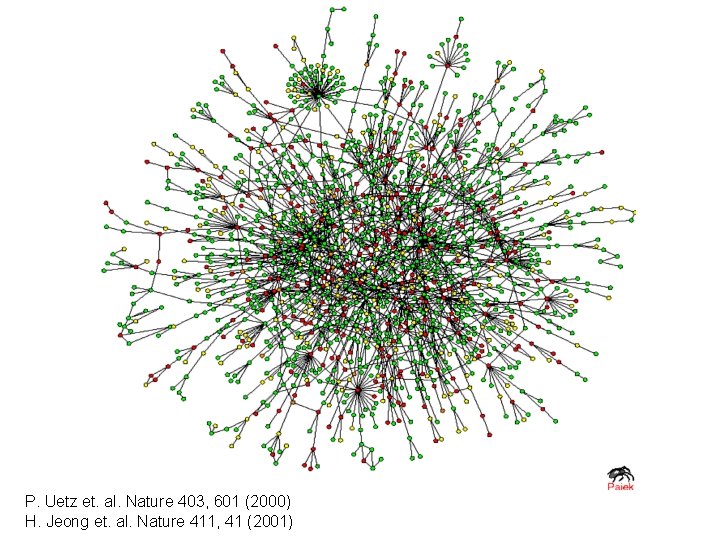
P. Uetz et. al. Nature 403, 601 (2000) H. Jeong et. al. Nature 411, 41 (2001)
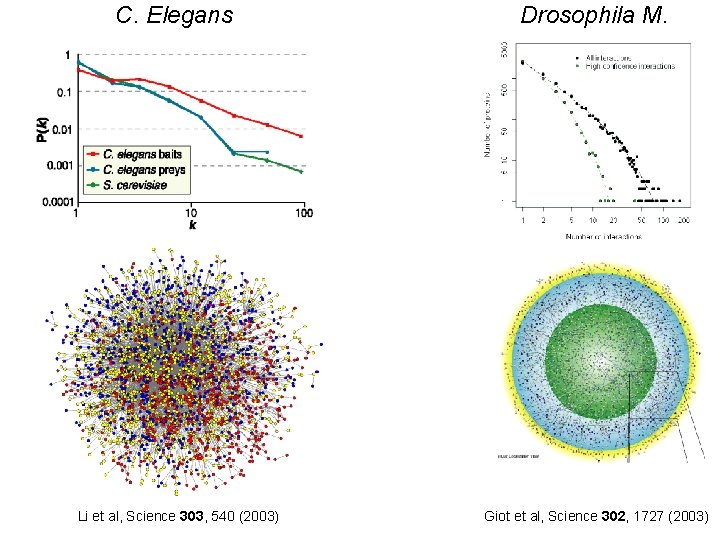
C. Elegans Li et al, Science 303, 540 (2003) Drosophila M. Giot et al, Science 302, 1727 (2003)
PINs are scale-free… Protein interaction networks are scale-free. • is this because of preferential attachment? • another mechanism? • how can we determine the cause?
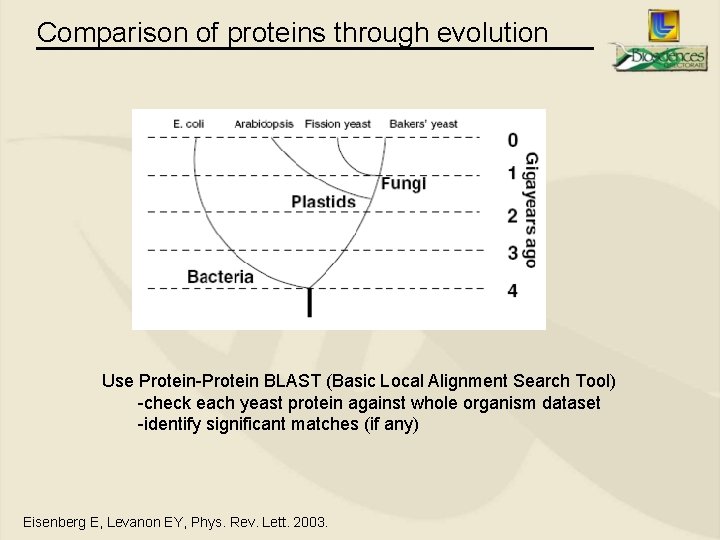
Comparison of proteins through evolution Use Protein-Protein BLAST (Basic Local Alignment Search Tool) -check each yeast protein against whole organism dataset -identify significant matches (if any) Eisenberg E, Levanon EY, Phys. Rev. Lett. 2003.
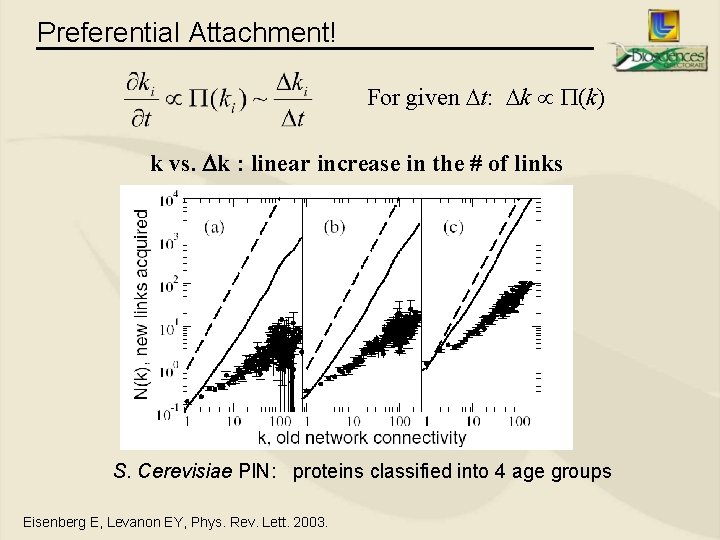
Preferential Attachment! For given t: k (k) k vs. k : linear increase in the # of links S. Cerevisiae PIN: proteins classified into 4 age groups Eisenberg E, Levanon EY, Phys. Rev. Lett. 2003.
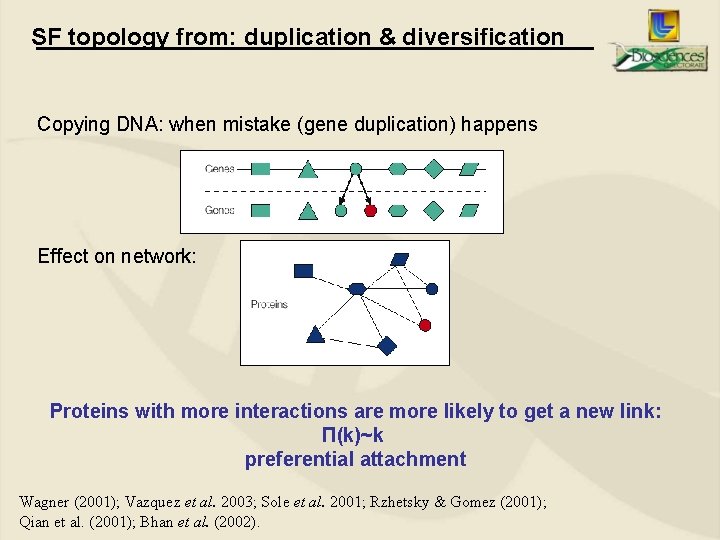
SF topology from: duplication & diversification Copying DNA: when mistake (gene duplication) happens Effect on network: Proteins with more interactions are more likely to get a new link: Π(k)~k preferential attachment Wagner (2001); Vazquez et al. 2003; Sole et al. 2001; Rzhetsky & Gomez (2001); Qian et al. (2001); Bhan et al. (2002).
How can we dissect the PIN?

Network motifs Definition: A motif is a recurrent network module Examples: • Can think of networks as constructed by combining these “basic” building blocks • Do these motifs have special properties?
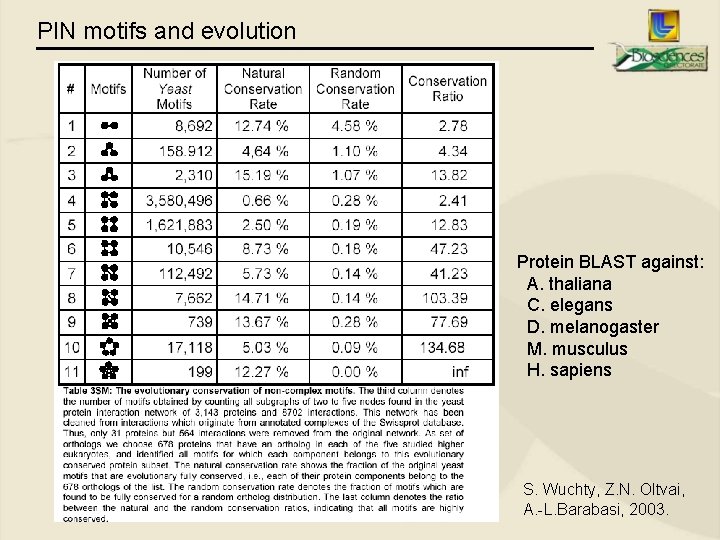
PIN motifs and evolution Protein BLAST against: A. thaliana C. elegans D. melanogaster M. musculus H. sapiens S. Wuchty, Z. N. Oltvai, A. -L. Barabasi, 2003.
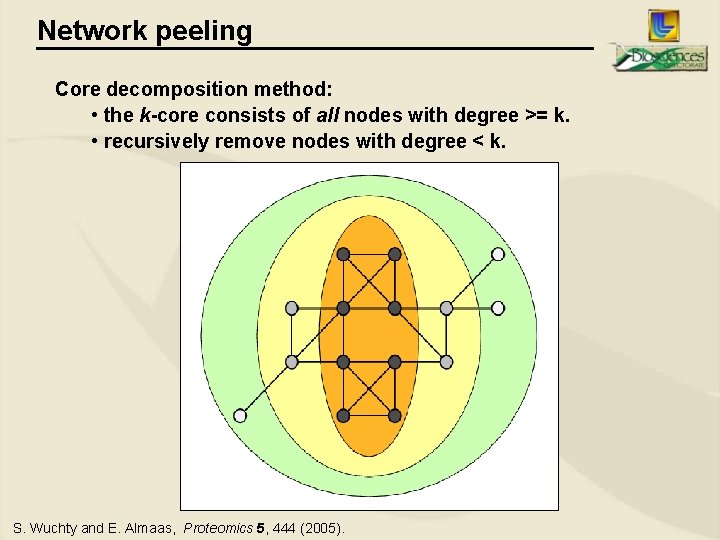
Network peeling Core decomposition method: • the k-core consists of all nodes with degree >= k. • recursively remove nodes with degree < k. S. Wuchty and E. Almaas, Proteomics 5, 444 (2005).
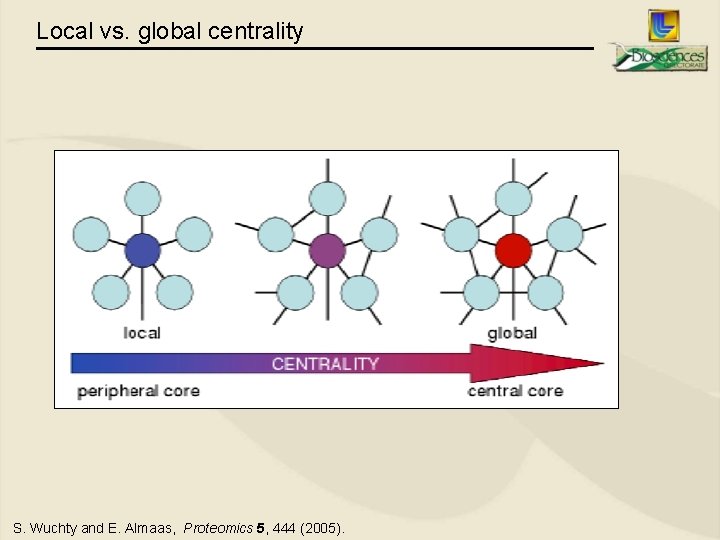
Local vs. global centrality S. Wuchty and E. Almaas, Proteomics 5, 444 (2005).
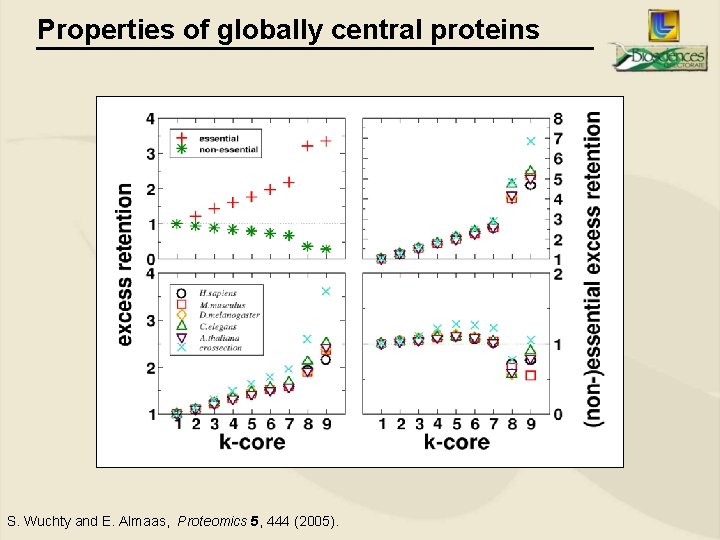
Properties of globally central proteins S. Wuchty and E. Almaas, Proteomics 5, 444 (2005).

Metabolic Networks
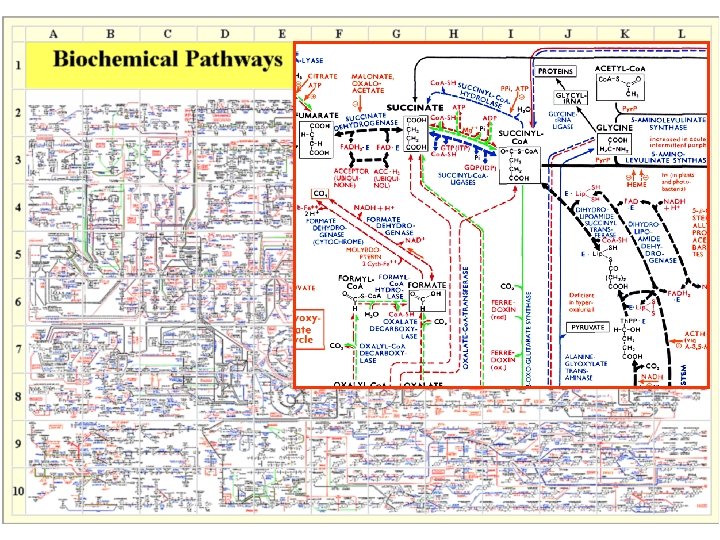
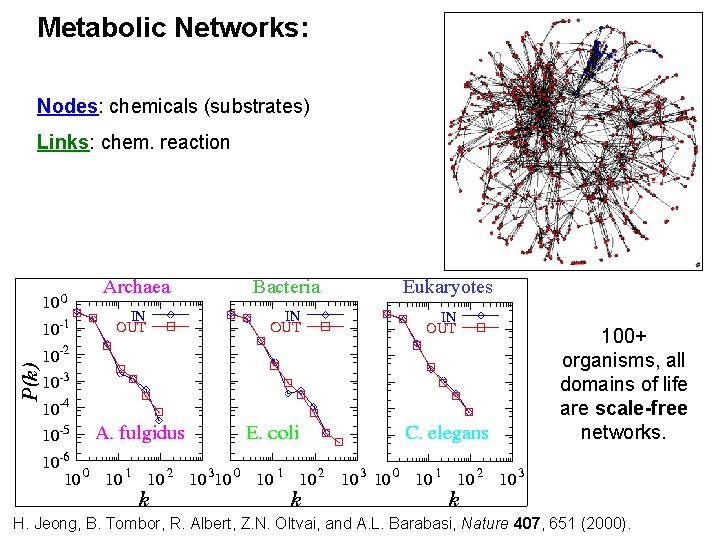
Metabolic Networks: Nodes: chemicals (substrates) Links: chem. reaction Archaea Bacteria Eukaryotes 100+ organisms, all domains of life are scale-free networks. H. Jeong, B. Tombor, R. Albert, Z. N. Oltvai, and A. L. Barabasi, Nature 407, 651 (2000).
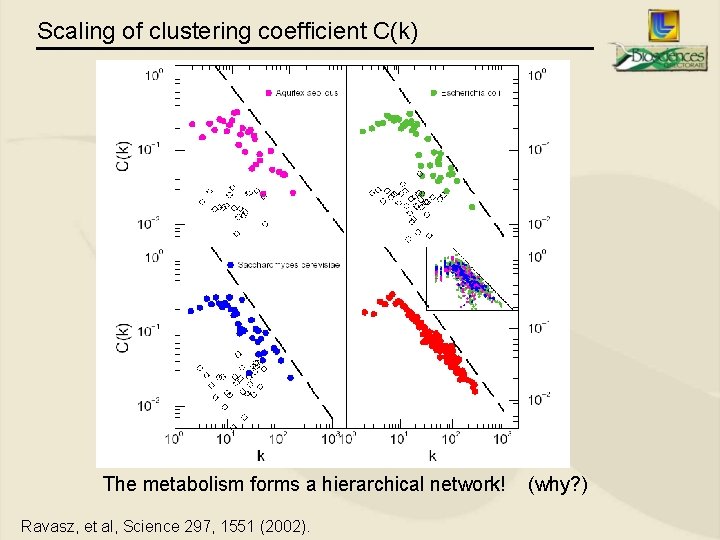
Scaling of clustering coefficient C(k) The metabolism forms a hierarchical network! Ravasz, et al, Science 297, 1551 (2002). (why? )
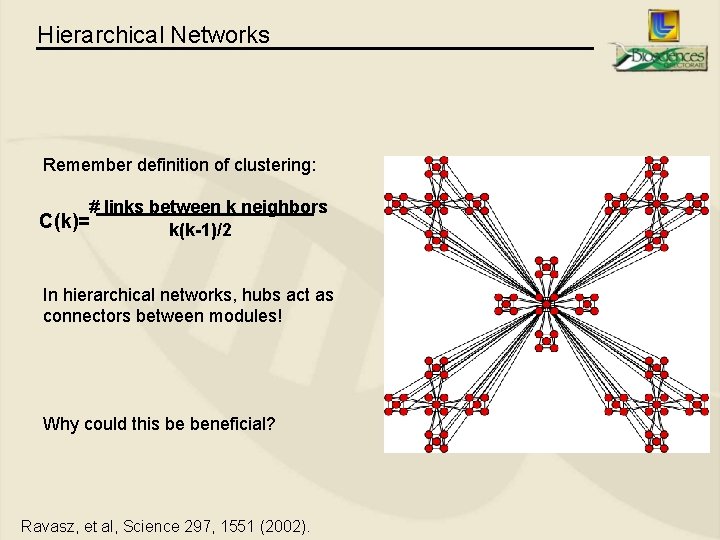
Hierarchical Networks Remember definition of clustering: # links between k neighbors C(k)= k(k-1)/2 In hierarchical networks, hubs act as connectors between modules! Why could this be beneficial? Ravasz, et al, Science 297, 1551 (2002).

How does metabolic network structure influence function?
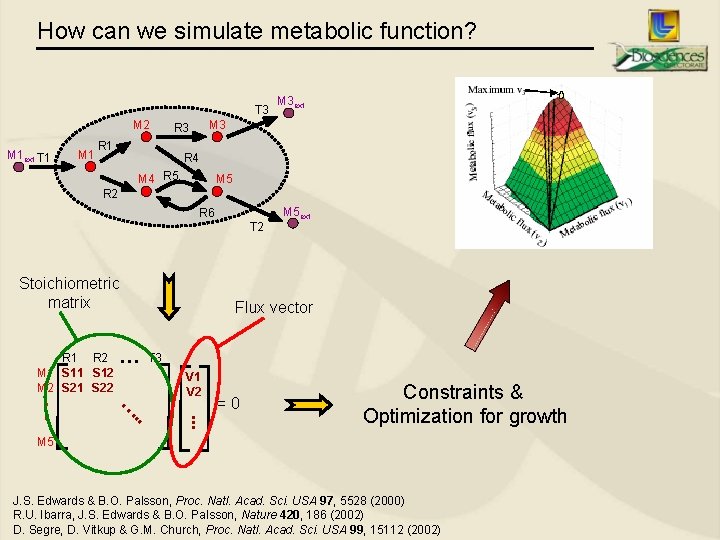
How can we simulate metabolic function? T 3 M 2 M 1 ext T 1 M 3 R 1 M 3 ext R 4 M 4 R 5 M 5 R 2 M 5 ext R 6 T 2 Stoichiometric matrix … T 3 V 1 V 2 . . … … . . . R 1 R 2 M 1 S 12 M 2 S 21 S 22 Flux vector =0 Constraints & Optimization for growth M 5 J. S. Edwards & B. O. Palsson, Proc. Natl. Acad. Sci. USA 97, 5528 (2000) R. U. Ibarra, J. S. Edwards & B. O. Palsson, Nature 420, 186 (2002) D. Segre, D. Vitkup & G. M. Church, Proc. Natl. Acad. Sci. USA 99, 15112 (2002)
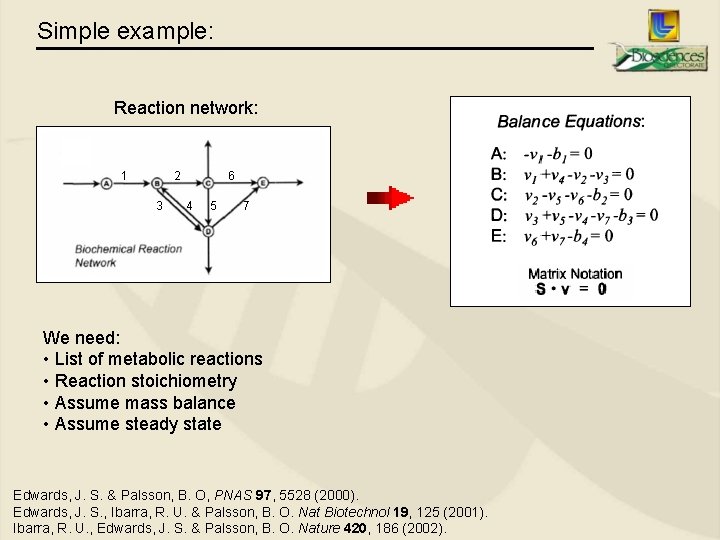
Simple example: Reaction network: 1 2 3 6 4 5 7 We need: • List of metabolic reactions • Reaction stoichiometry • Assume mass balance • Assume steady state Edwards, J. S. & Palsson, B. O, PNAS 97, 5528 (2000). Edwards, J. S. , Ibarra, R. U. & Palsson, B. O. Nat Biotechnol 19, 125 (2001). Ibarra, R. U. , Edwards, J. S. & Palsson, B. O. Nature 420, 186 (2002).
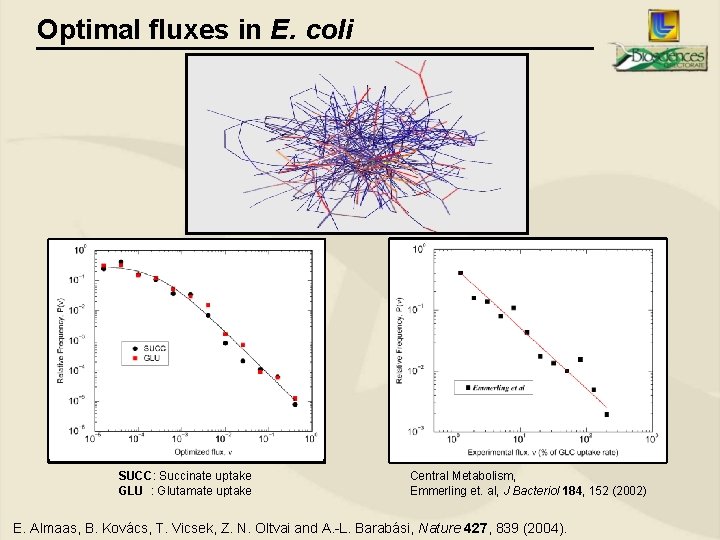
Optimal fluxes in E. coli SUCC: Succinate uptake GLU : Glutamate uptake Central Metabolism, Emmerling et. al, J Bacteriol 184, 152 (2002) E. Almaas, B. Kovács, T. Vicsek, Z. N. Oltvai and A. -L. Barabási, Nature 427, 839 (2004).
How are metabolic fluxes correlated with network topology?
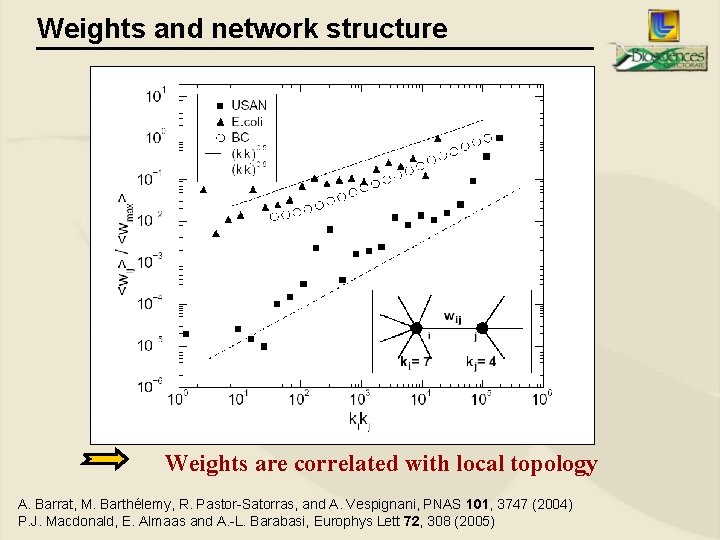
Weights and network structure Weights are correlated with local topology A. Barrat, M. Barthélemy, R. Pastor-Satorras, and A. Vespignani, PNAS 101, 3747 (2004) P. J. Macdonald, E. Almaas and A. -L. Barabasi, Europhys Lett 72, 308 (2005)
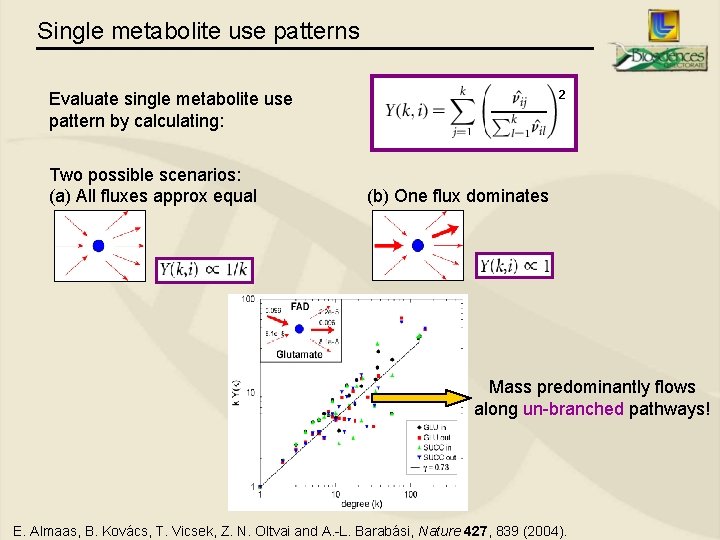
Single metabolite use patterns 2 Evaluate single metabolite use pattern by calculating: Two possible scenarios: (a) All fluxes approx equal (b) One flux dominates Mass predominantly flows along un-branched pathways! E. Almaas, B. Kovács, T. Vicsek, Z. N. Oltvai and A. -L. Barabási, Nature 427, 839 (2004).
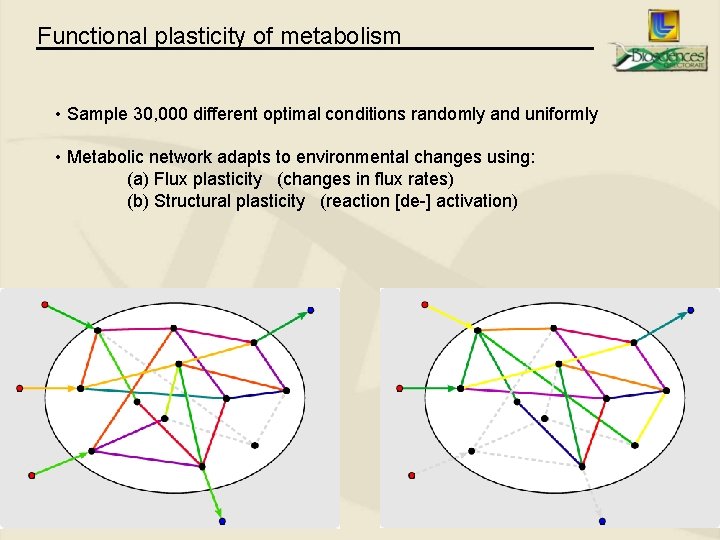
Functional plasticity of metabolism • Sample 30, 000 different optimal conditions randomly and uniformly • Metabolic network adapts to environmental changes using: (a) Flux plasticity (changes in flux rates) (b) Structural plasticity (reaction [de-] activation)
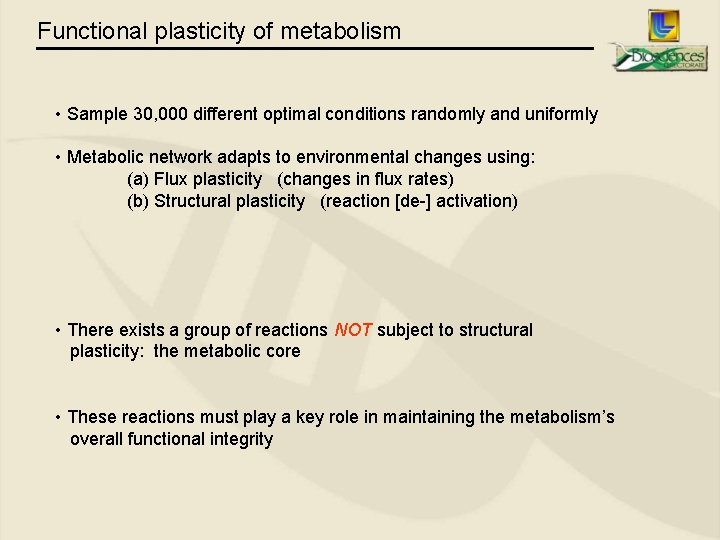
Functional plasticity of metabolism • Sample 30, 000 different optimal conditions randomly and uniformly • Metabolic network adapts to environmental changes using: (a) Flux plasticity (changes in flux rates) (b) Structural plasticity (reaction [de-] activation) • There exists a group of reactions NOT subject to structural plasticity: the metabolic core • These reactions must play a key role in maintaining the metabolism’s overall functional integrity
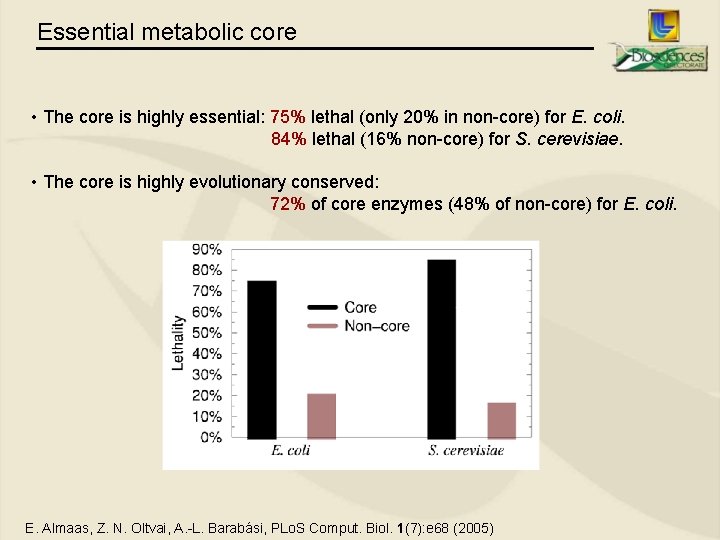
Essential metabolic core • The core is highly essential: 75% lethal (only 20% in non-core) for E. coli. 84% lethal (16% non-core) for S. cerevisiae. • The core is highly evolutionary conserved: 72% of core enzymes (48% of non-core) for E. coli. E. Almaas, Z. N. Oltvai, A. -L. Barabási, PLo. S Comput. Biol. 1(7): e 68 (2005)
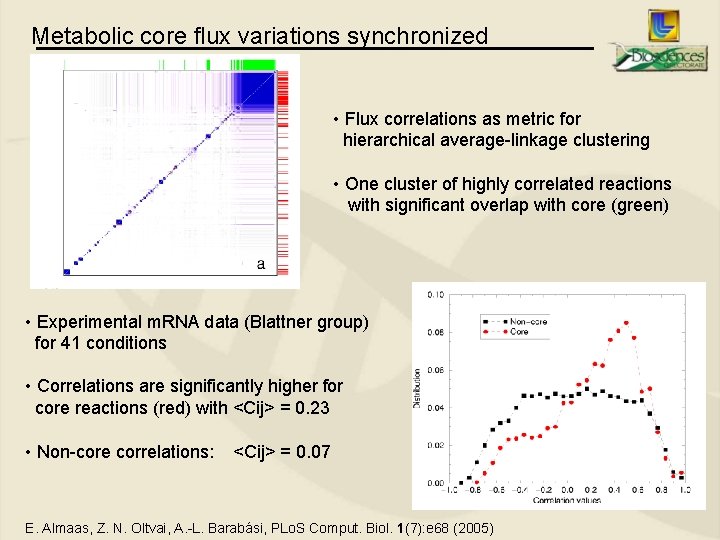
Metabolic core flux variations synchronized • Flux correlations as metric for hierarchical average-linkage clustering • One cluster of highly correlated reactions with significant overlap with core (green) • Experimental m. RNA data (Blattner group) for 41 conditions • Correlations are significantly higher for core reactions (red) with <Cij> = 0. 23 • Non-core correlations: <Cij> = 0. 07 E. Almaas, Z. N. Oltvai, A. -L. Barabási, PLo. S Comput. Biol. 1(7): e 68 (2005)
Summary • Cellular networks are predominantly scale-free • Network structure constrains dynamics • Protein interaction network from preferential attachment • Networks motifs and k-core decomposition • Metabolic fluxes are scale-free • Metabolic fluxes correlate with the network topology • Fluxes predominantly flow along metabolic super-highways • Synchronized & essential metabolic core
- Slides: 36