
EIT Author Gay Robertson 2021 What is a
© EIT, Author Gay Robertson, 2021
What is a chart? • A display of data in graphic form • Easier to read and understand the data from the worksheet • Examples on what a chart can be used for: • Visually analyse data to show comparisons • Visually analyse data to show trends • Visually analyse data to show proportions • Charts are best understood when they are approximately 1/3 rd of a page in size (7. 62 Height x 12. 7 Width) Note: this is the
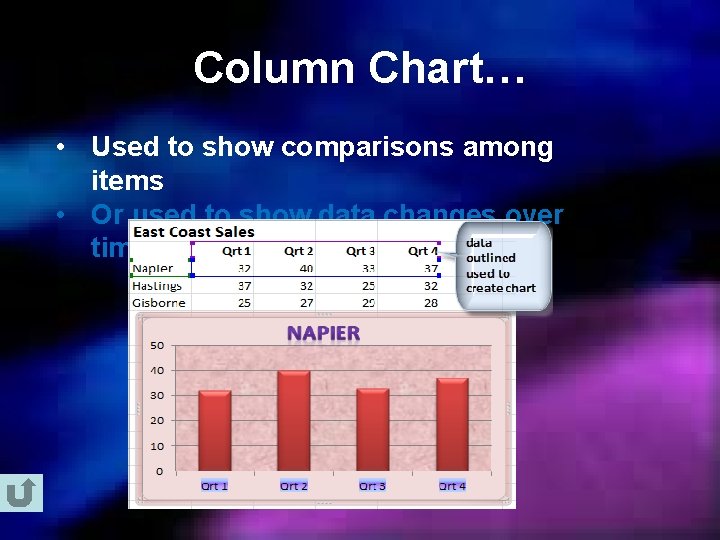
Column Chart… • Used to show comparisons among items • Or used to show data changes over time
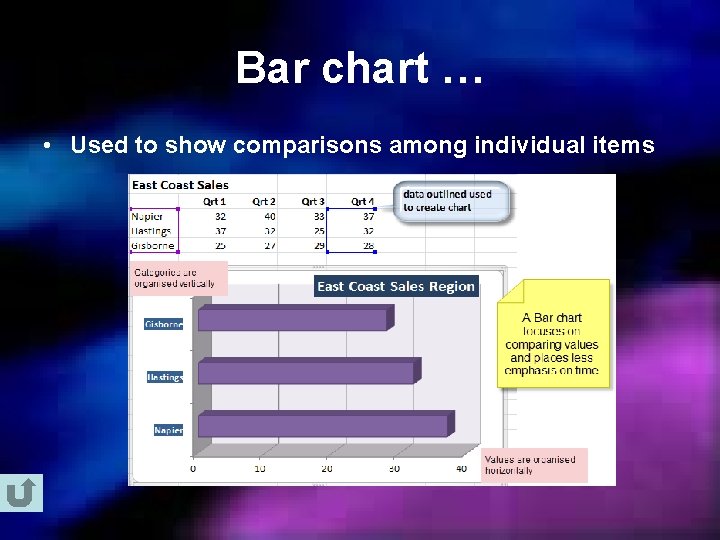
Bar chart … • Used to show comparisons among individual items
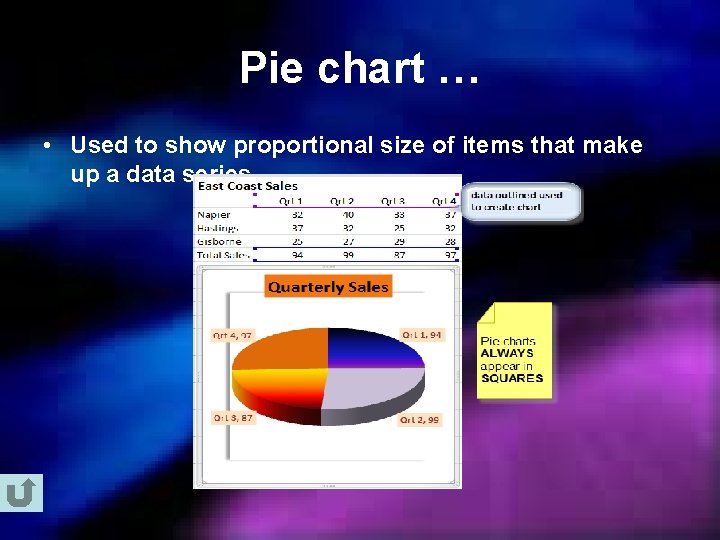
Pie chart … • Used to show proportional size of items that make up a data series
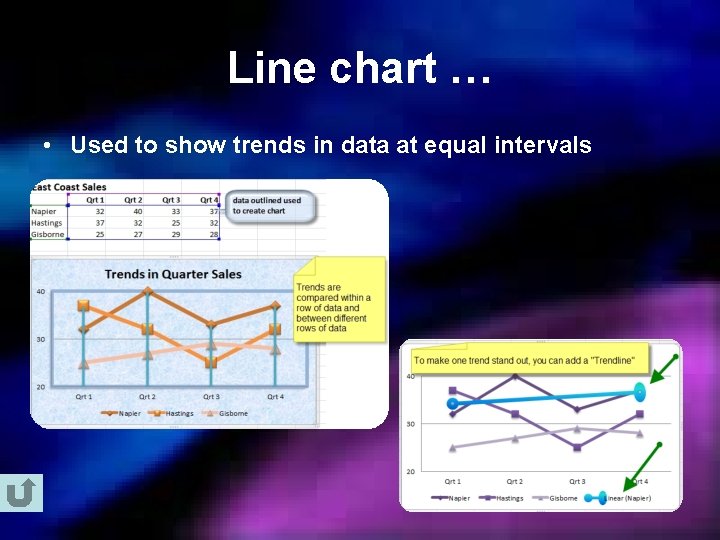
Line chart … • Used to show trends in data at equal intervals
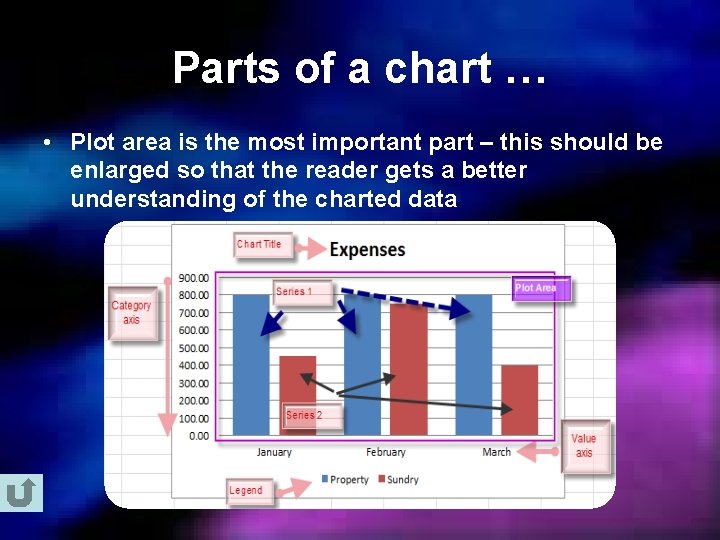
Parts of a chart … • Plot area is the most important part – this should be enlarged so that the reader gets a better understanding of the charted data
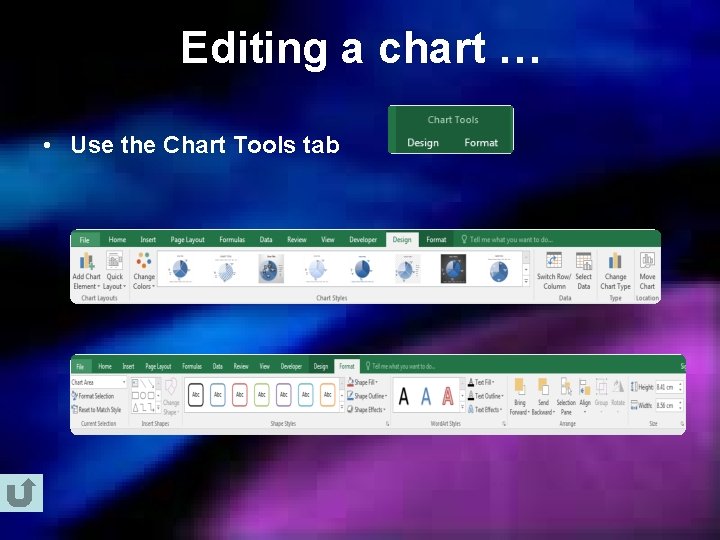
Editing a chart … • Use the Chart Tools tab
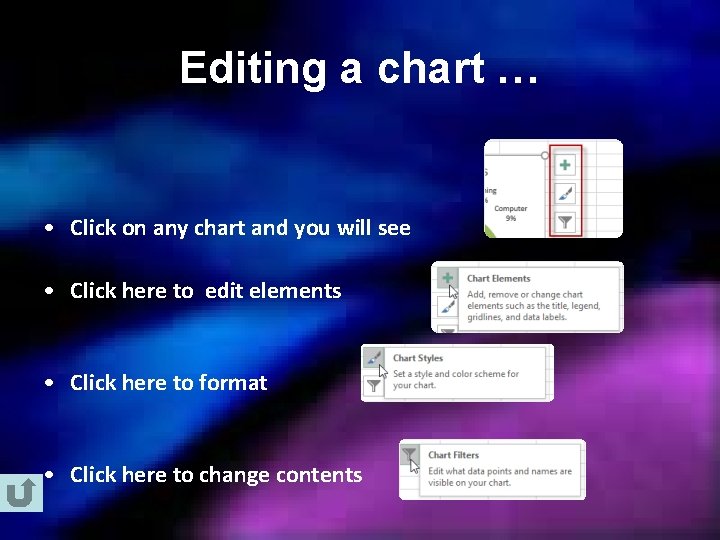
Editing a chart … • Click on any chart and you will see • Click here to edit elements • Click here to format • Click here to change contents
Let’s hope that helped! But, if it didn’t make much sense – I can go through this again!
Why would I use a chart? • In business, your workbooks will be generally a lot more complex and a lot larger than the little exercises you are working with and the data will be more difficult to analyse
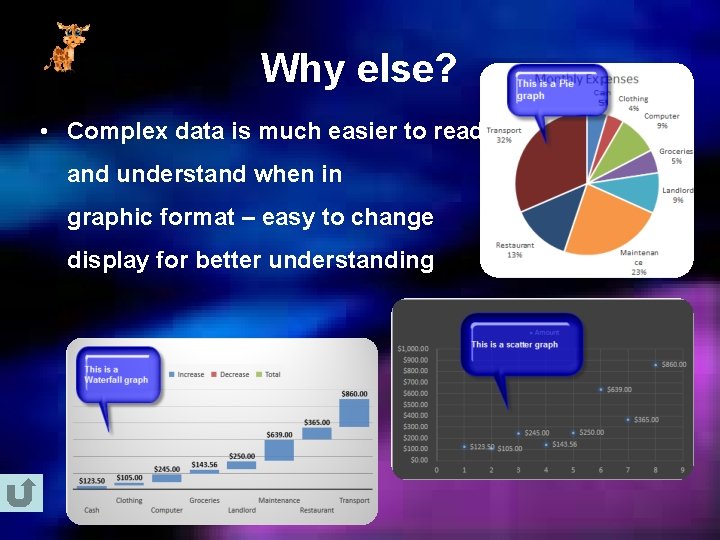
Why else? • Complex data is much easier to read and understand when in graphic format – easy to change display for better understanding
- Slides: 12