EGS Introduction What is EGS Shouldnt that be

EGS Introduction What is EGS? Shouldn’t that be What Are? ? ?

EGS Introduction Environmental and Geophysical Science So the class is a mixture of the Earth Sciences and Physical Sciences with applications to environmental issues.

EGS Introduction Earth Science l l Geology- study of the earth Oceanography- study of the oceans Meteorology- study of weather and climate Astronomy- study of the universe

EGS Introduction Physical Sciences l l Chemistry- the study of matter and how forms of matter interact with each other Physics- the study of the relationship between matter and energy

EGS Introduction Environmental Science l A study of the earth and its resources, both living and nonliving, with an emphasis on how humans use and affect those resources.

What is Science? The study of the structure and behavior of the physical and natural world through observation and experimentation. Science is never finished. It is constantly being refined and knowledge is continually being expanded. Science is uncertain, unbiased, open to falsification, and must be shared.

“Science is a history of corrected mistakes. ” - Karl Popper “That fellow Einstein…every year retracts what he wrote the year before. ”- Albert Einstien “Question everything”- Maria Mitchell

Non-science Can be very logical and even true, but does not meet the characteristics of science. The arts, philosophy, mythology, religious beliefs, mathematics, personal opinions

Protoscience An emerging study that currently is not considered a science but eventually may meet the requirements to be considered a science. l Psychoanalysis, Mental Telepathy Many current sciences were once a protoscience. l Plate Tectonics, Genetics, Electricity

Pseudoscience Studies that position themselves as science without meeting the requirements for science. Lacking evidence, contradictory, exaggerated claims that can’t be tested, lack of openness to evaluation, absolutes Astrology, alchemy, many occults, many weight loss pills or herbal remedies

Scientific Method Who uses it? What is it? Why should I care?

The scientific method follows a systematic process for investigating problems. Following the steps of the scientific method ensures that a study meets the requirements of science.

It is a way to solve problems. Do you have any problems to solve? Any big or any small ones?

Any of these sound familiar? Where are My Shoes? What should I have for lunch? What class do I have next? Did I do my homework for that class? What is the cure for cancer? Which deodorant works the longest?
 steps to the Scientific Method. 1. Problem 2. Information")
There are six (? ) steps to the Scientific Method. 1. Problem 2. Information 3. Hypothesis 4. Experiment 5. Observations 6. Conclusion

By following these steps in order you will learn about your question. Notice the IN ORDER part. It is very important.

Problem *This is the question that you are trying to answer or problem that you are trying to solve. *Try to narrow it down and be very specific.

Information gather data about your question. books magazines reports experts your past experiences

Information Inference l l A logical interpretation of an event that is based on observations and prior knowledge May lead to the formation of a hypothesis

Hypothesis -an educated guess -a prediction based on data -what you think the answer is based upon your gathered information Written as an “if---, then---” statement

Experiment When conducting an experiment, change only one factor at a time and keep everything else the same A factor that is changed is a variable The factors that stay the same are the controls
 variable- the “If” portion of your hypothesis. This is the factor")
Experiment Independent (manipulated) variable- the “If” portion of your hypothesis. This is the factor that you change at the start of your experiment Dependent (responding) variable- the “Then” portion of your hypothesis. This the factor that occurs because of the change that you changed at the start of your experiment
 Quantitative")
Observations Collection of information and data from the experiment. l l Qualitative (quality) Quantitative (quantity) It may be charts, graphs, or written work. This is WHAT HAPPENED!!!!!

Conclusion What did you find the answer to the question was? It is OK if it turns out that your hypothesis was not correct. You learned!!!!!

Conclusion Theory l l A logical, time-tested explanation that is consistent with observations, can be tested, and is the simplest explanation Theories can never really be proven, only disproven as new information is obtained

Conclusion Report your findings!!!!!! One of the most important parts of the scientific method is to report to others your findings. You will help others learn.

Measurements

Measurements Metric System l l l First unified system of measurement 1795 - Metric system adopted in France 1866 - U. S. Congress legalized use of the metric system 1957 - U. S. armed forces adopted the metric system 1965 - Great Britain begins using the metric system

Measurements The SI System is an improved version of the metric system that is based on units of ten SI uses base units l l l Length- meter (m) Mass- gram (g) Time- second (s)

Measurements There are four other SI base units, including temperature All other measurements can be derived from these base units, such as the liter (L) which is used to measure volume Base units can increase or decrease in size by using prefixes

Measurements Common Metric Prefix kilohectodeca. Base unit decicentimilli- Unit Multiples 1, 000 10 ---1/100 1/1, 000

Scientific Models are used to represent objects or concepts in science. l l Physical Conceptual Mathematical Graphical

Scientific Models Physical models are 3 -D models that closely resemble something that is much smaller or much larger. Conceptual models demonstrate how a system is organized (flow charts, timelines)

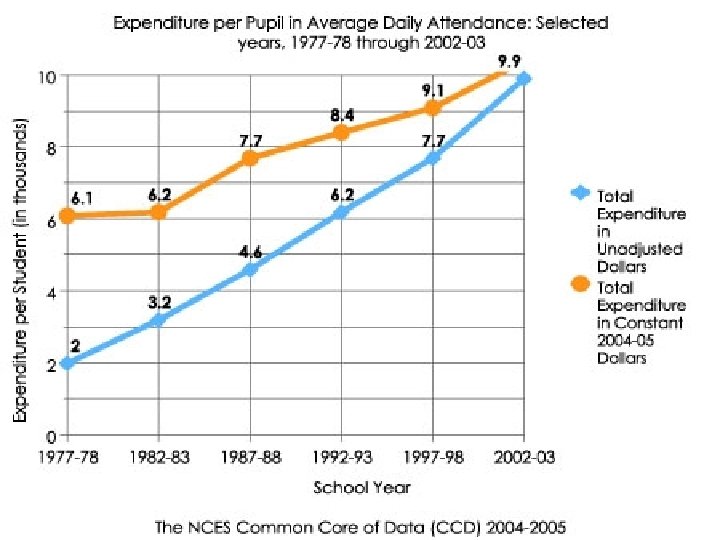
Scientific Models Mathematical models are equations that represent and help explain the things observed in nature. Graphical models can be either charts, tables, maps, or graphs.

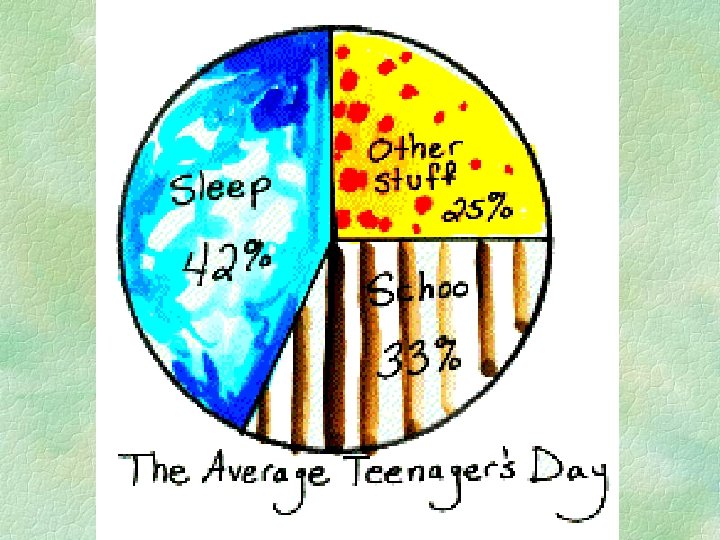
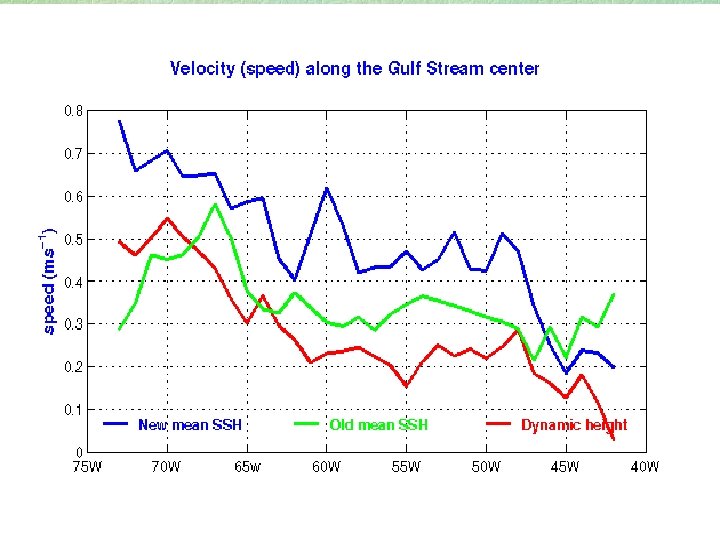
Graphing Graphs are a way of displaying data and information Three main types l l l Circle (pie) graph- percentages Bar graph- counted amounts Line graph- trends
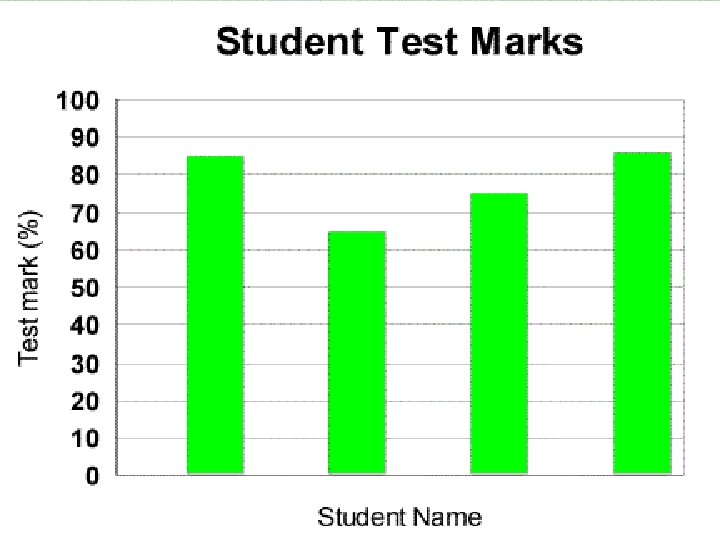

Graphing What makes a good graph? l l Title Each axis is labeled with what was measured and in what units • X-axis = independent variable • Y-axis = dependent variable l Each axis is scaled so that data uses most of the space available
- Slides: 41