EG 5503 GIS Earth Observation Earth Interactions Dr

EG 5503: GIS & Earth Observation Earth Interactions Dr Mark Cresswell

Topics l l l l Land surfaces Temperature and radiance Albedo NDVI Fires and volcanoes SST and Oceans Algal blooms and pollution

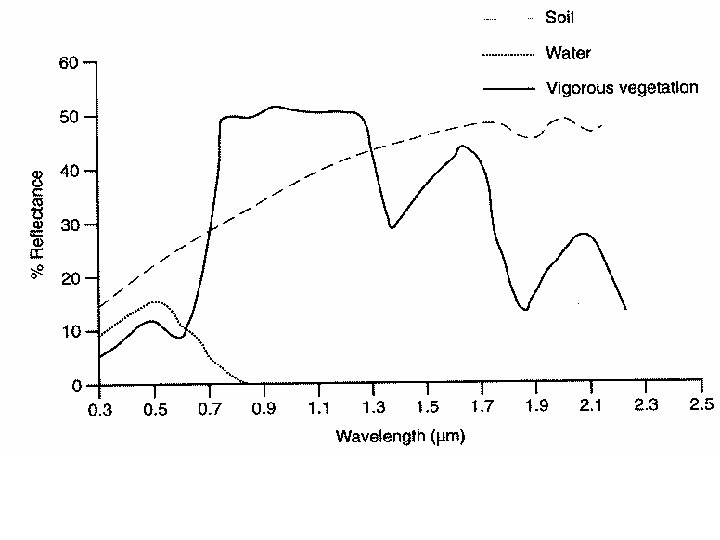
Land Surfaces l l Remote sensing provides a proxy for the nature of land surfaces We are interested in land cover rather than land use Different materials (land cover classes) absorb and reflect electromagnetic radiation differently We can infer land surface conditions from remotely sensed images

Temperature and Radiance l l l Infrared radiation is the key A region of the electromagnetic spectrum sandwiched between the red visible and microwave portions of the spectrum IR radiation is invisible 3 – 14µm is TIR (0. 7 – 1. 3µm is NIR, 1. 3 – 3µm is MIR) Quantity of IR is related to radiance Radiance intensity is related to temperature

Temperature and Radiance l l l Different materials in nature absorb and emit thermal energy differently Differences are due to thermal capacity and ability to conduct as well as environmental parameters Water often has a high thermal capacity compared with bare soil – so both materials are easily distinguished from one another

Raw Meteosat Dekad composite Radiance image

Albedo l Albedo is simply the ratio of incoming radiation to reflected outgoing radiation expressed as %

Albedo l l l Materials such as clouds and fresh snow have a HIGH albedo (they reflect much of the incident solar radiation back to space) Forests and soil have a low albedo (they absorb much of the incident radiation) We can classify materials according to their albedo


VISIBLE • Albedo • Weather Fcst.

NDVI l l Normalised Difference Vegetation Index NDVI provides a good assessment of photosynthesising vegetation – but caution must be exercised with this type of index as other factors can affect the NDVI other than leaf reflectance: Viewing angle, Soil background, Atmospheric degradation and Leaf orientation

Red edge
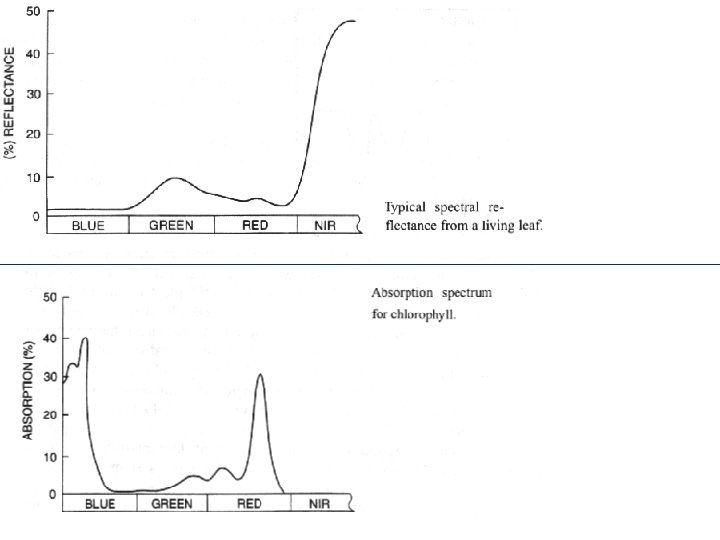
 Uses differential reflectance")
NDVI l l Often derived from NOAA-AVHRR satellite system (polar orbiter) Uses differential reflectance of visible and IR

Fires and Volcanoes l l l Because of their thermal anomaly, fires and active volcanoes can be identified from space Acquisition of thermal infrared images allows fires to be detected automatically Time-series of images can show a trend in temperature beneath and surrounding a volcano that might allow a prediction of eruption to be made
 instrument on board the")
Volcanoes l l l The moderate resolution imaging spectroradiometer (MODIS) instrument on board the NASA EOS platform, Terra gives global coverage every 1 -2 days at 250, 500 and 1000 metre resolutions Spectral data measured at 4µm and 12µm System examines scenes for high temperature volcanic thermal anomalies

Volcanoes l l Once identified, details such as location, emitted spectral radiance and other parameters are transferred via the internet to the Hawaii Institute of Geophysics and Planetology Algorithms appear to be robust at detecting both permanent and sporadically active volcanic systems. See Wright et al. 2002

Forest Fires A fire detection and management system should have the following aims: • • A measure of the geographical limits of the fire-front An estimate of fire intensity Monitoring of burnt area to look for latent fires Mapping of burnt areas to aid restoration (Barducci et al. 2002)
 NASA Earth Observatory, 2005")
Boreneo Fires (Sep 18 th 2005) NASA Earth Observatory, 2005
 l l l SSTs are carefully monitored on a global")
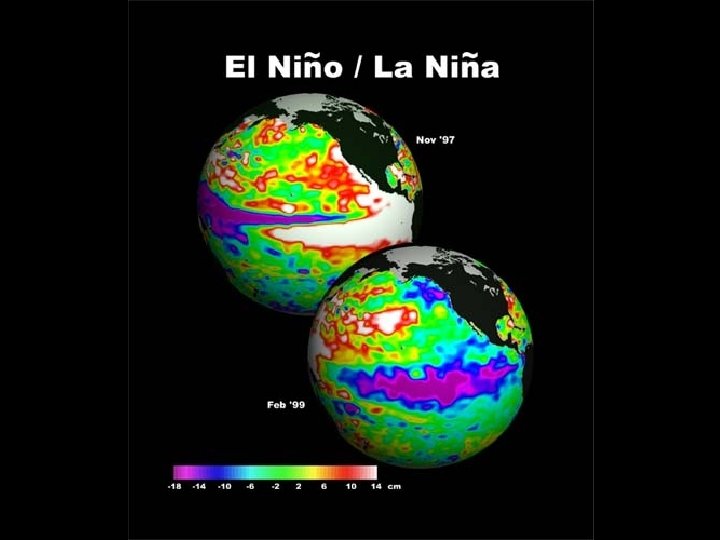
Sea Surface Temperature (SST) l l l SSTs are carefully monitored on a global basis SST anomalies (deviation from mean) are often the sole source of long-range climate prediction SST may also indicate either industrial pollution events, natural climate fluctuations (El Niño) and geothermal vents
 l l l SST can be measured directly from thermal")
Sea Surface Temperature (SST) l l l SST can be measured directly from thermal infrared (e. g. by NOAA-AVHRR) Large-scale global sea temperature conditions are measured by altimetric satellites such as TOPEX-Poseidon and JASON SST based on TIR uses radiance which may be transformed into temperature

TOPEX/Poseidon Launched in 1992 TOPEX 1336 km above ocean Determined wave height Resolution of <1 inch 10 -day return time Return time of microwave pulse used to ascertain ocean surface topography SEA SURFACE

Ocean Monitoring for Disaster Management Tsunami Like coastal flooding, Tsunami events may be modelled and within a GIS. Complex computational fluid dynamics (CFD) requires very detailed bathymetric and topographic data retrieved from remote sensing missions. Earthquakes and landslides that contribute to tsunami formation can be assessed by different remote sensing techniques.

Quick. Bird used extensively throughout Asian Tsunami Disaster Of December 2004

Quick. Bird used extensively throughout Asian Tsunami Disaster

Quick. Bird used extensively throughout Asian Tsunami Disaster

Quick. Bird used extensively throughout Asian Tsunami Disaster

Quick. Bird used extensively throughout Asian Tsunami Disaster

Quick. Bird used extensively throughout Asian Tsunami Disaster

Algal Blooms l l l During summer months certain species of algae in warm ocean water can grow and proliferate extremely quickly Results in available dissolved oxygen being removed from the water – as well as nutrients which kills fish and other marine life Algal ‘mats’ also blocks sunlight from penetrating surface of water killing marine flora

Algal Blooms l l l Species such as Cochlodinium polykrikoides are often responsible for ‘red tides’ that kill fish stocks affecting food supply and economy of people living in Asia Main satellite system used in monitoring ocean algal blooms is Sea. WIFS Launched in 1997 Sun-synchronous orbit (705 km above Earth) 1 day revisit interval
 OCS is normally")
Algal Blooms l l Product is an ocean colour scene (OCS) OCS is normally blue A green OCS suggests high chlorophyll concentration due to algae Higher the green reflectance the greater the algal (chlorophyll) concentration

Washington coast and Vancouver Island October 1 st 2004 Thriving ocean plants form clouds of green in the waters a large bloom of Pseudonitzschia, a toxic algae, off the Strait of Juan de Fuca, the channel of water that separates Vancouver Island in the north from Washington State in the south Source: NASA Earth Observatory 2005

Pollution Monitoring l l l Satellites can clearly distinguish toxic algae as well as thermal pollution Oil slicks, chemical spills and dumping of waste can also be identified Differential spectral response of seawater compared to chemical species (such as fuel, oil or chemicals)

A fuel spill plume on the surface of the water identified from nearultraviolet imagery Aerial sensor.
- Slides: 37