
EFPIA Patient W A I T Indicator 2018
- Slides: 32
EFPIA Patient W. A. I. T. Indicator 2018 survey February 2019 Copyright © 2017 IQVIA. All rights reserved.
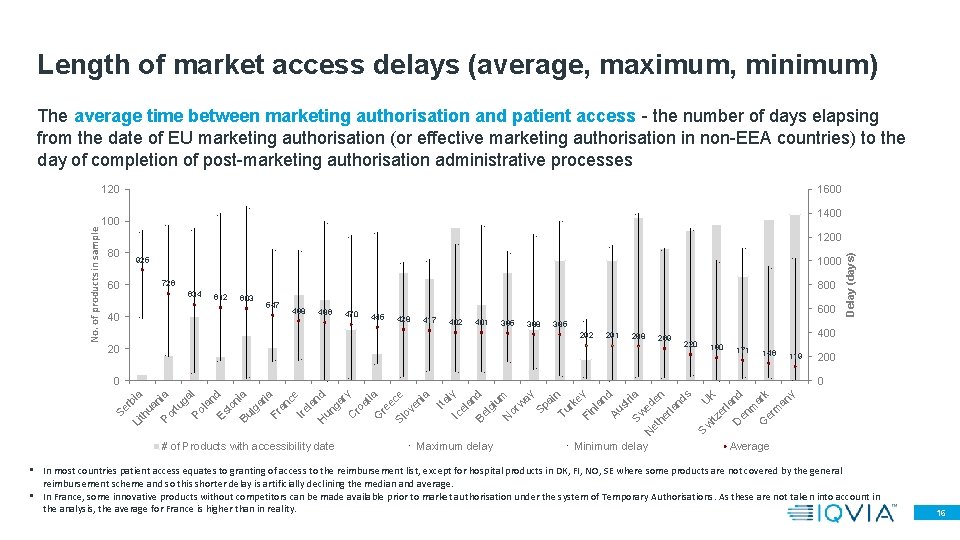
Introduction (1) • “Patients W. A. I. T. ” stands for Patients Waiting to Access Innovative Therapies. The INDICATOR provides a benchmark of the rate of availability and waiting times in European countries. • The Patients W. A. I. T. Indicator shows, for new medicines (i. e. medicines including a substance that has not been previously available in Europe) within a (rolling) 3, or 4 year cohort: 1. The rate of availability, measured by the number of medicines available to patients in European countries. For most countries this is the point at which the product gains access to the reimbursement list 2. The average time between marketing authorisation and patient access, measured by the number of days elapsing from the date of EU marketing authorisation (or effective marketing authorisation in non-EEA countries) to the day of completion of post-marketing authorisation administrative processes • Source of information: EFPIA member associations, who either refer to information available from official sources or gather this information directly from member companies 1
Introduction (2) • The Patients W. A. I. T. Indicator gives a snapshot of the 2 parameters at a cut-off date (19 th December 2018) – data from medicines cohorts dropping out of the reference period are not included. • Waiting times reflected in the Patients W. A. I. T. Indicator include any delay, whether attributable to companies or to competent authorities. • Rate of availability in a country does not necessarily indicate medicine uptake. Some medicines may be available in a market with no uptake (sales or volume). • The Patients W. A. I. T. Indicator is not a measurement of the delays as defined in the “Transparency” Directive (directive 89/105/EEC). Delays under the “Transparency” Directive reflect the number of days that national competent authorities need to make their decisions regarding price and inclusion of medicines in the positive list, where applicable. These delays do not include the time needed to prepare submissions under relevant national regulations, which may also include clock-stops for supply of additional information during the process; neither do “Transparency” Directive delays include time required to complete other formalities before a new medicine can be made available in a given country. 2
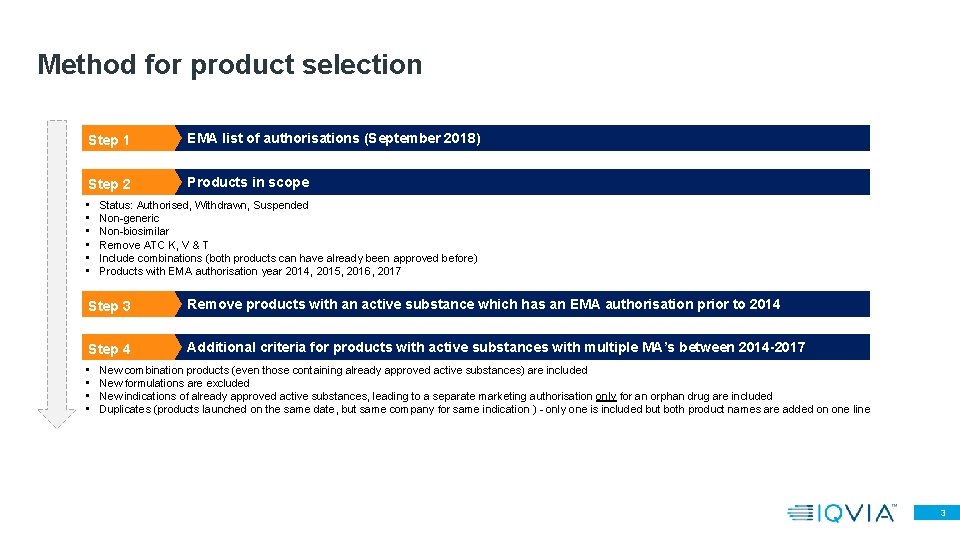
Method for product selection Step 1 EMA list of authorisations (September 2018) Step 2 Products in scope • • • Status: Authorised, Withdrawn, Suspended Non-generic Non-biosimilar Remove ATC K, V & T Include combinations (both products can have already been approved before) Products with EMA authorisation year 2014, 2015, 2016, 2017 Step 3 Remove products with an active substance which has an EMA authorisation prior to 2014 Step 4 Additional criteria for products with active substances with multiple MA’s between 2014 -2017 • • New combination products (even those containing already approved active substances) are included New formulations are excluded New indications of already approved active substances, leading to a separate marketing authorisation only for an orphan drug are included Duplicates (products launched on the same date, but same company for same indication ) - only one is included but both product names are added on one line 3
Study scope • 121 products approved by EMA between 1 st January 2015 to 31 st December 2017 (excluding 4 products which were withdrawn between 2015 -2017) • The 2018 study provides an analysis of products approved between 2015 -2016 -2017, for the following datasets: a) All 121 products: 45 in 2015, 38 in 2016, 38 in 2017 b) 38 Orphan products: 13 in 2015, 13 in 2016, 12 in 2017 c) 31 Oncology products: 10 in 2015, 12 in 2016, 9 in 2017 • Definitions: - Orphan status from EMA (September 2018) - Oncology products flagged using IQVIA MIDAS Oncology market definition* • The date of availability cut off point is 19 th December 2018 (except for Estonia and Iceland, which had a few products with a reimbursement decision on 1 st January 2019) • 27 countries included in the study * L 1&L 2&V 3 C&Revlimid&Xgeva&Proleukin&Pomalyst 4
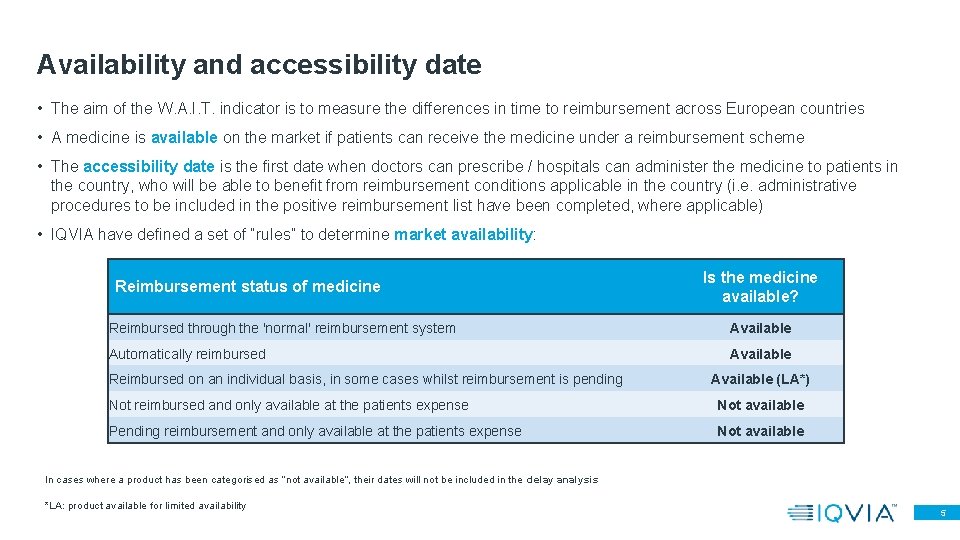
Availability and accessibility date • The aim of the W. A. I. T. indicator is to measure the differences in time to reimbursement across European countries • A medicine is available on the market if patients can receive the medicine under a reimbursement scheme • The accessibility date is the first date when doctors can prescribe / hospitals can administer the medicine to patients in the country, who will be able to benefit from reimbursement conditions applicable in the country (i. e. administrative procedures to be included in the positive reimbursement list have been completed, where applicable) • IQVIA have defined a set of “rules” to determine market availability: Reimbursement status of medicine Is the medicine available? Reimbursed through the 'normal' reimbursement system Available Automatically reimbursed Available Reimbursed on an individual basis, in some cases whilst reimbursement is pending Available (LA*) Not reimbursed and only available at the patients expense Not available Pending reimbursement and only available at the patients expense Not available In cases where a product has been categorised as “not available”, their dates will not be included in the delay analysis *LA: product available for limited availability 5
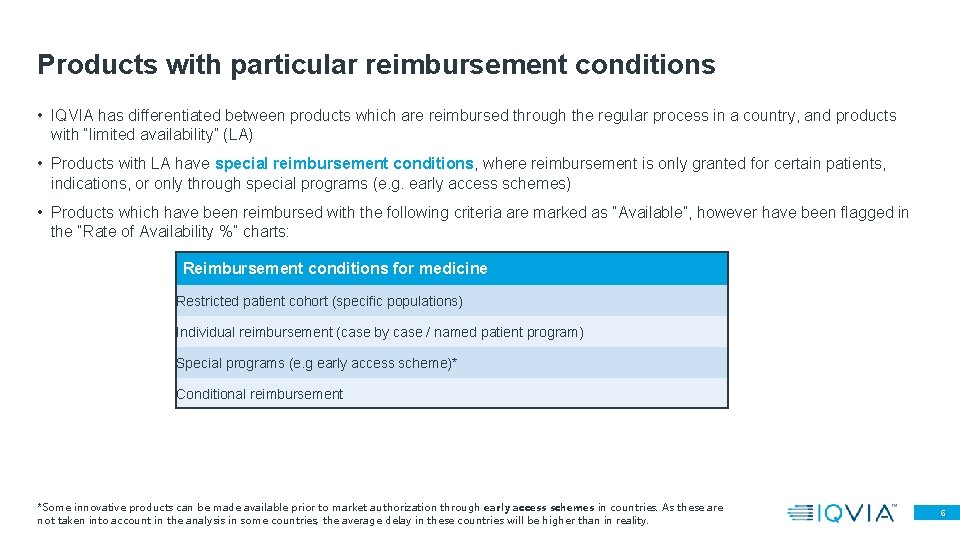
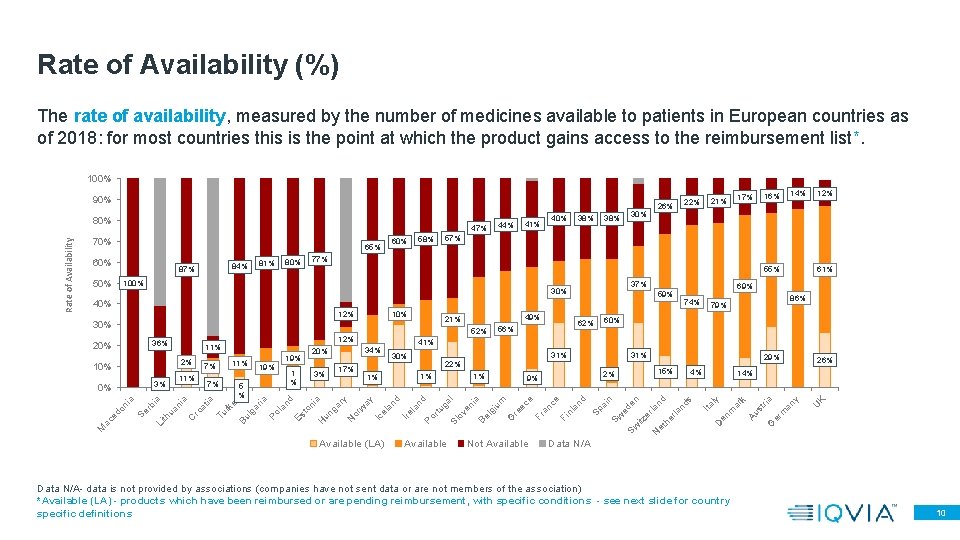
Products with particular reimbursement conditions • IQVIA has differentiated between products which are reimbursed through the regular process in a country, and products with “limited availability” (LA) • Products with LA have special reimbursement conditions, where reimbursement is only granted for certain patients, indications, or only through special programs (e. g. early access schemes) • Products which have been reimbursed with the following criteria are marked as “Available”, however have been flagged in the “Rate of Availability %” charts: Reimbursement conditions for medicine Restricted patient cohort (specific populations) Individual reimbursement (case by case / named patient program) Special programs (e. g early access scheme)* Conditional reimbursement *Some innovative products can be made available prior to market authorization through early access schemes in countries. As these are not taken into account in the analysis in some countries, the average delay in these countries will be higher than in reality. 6
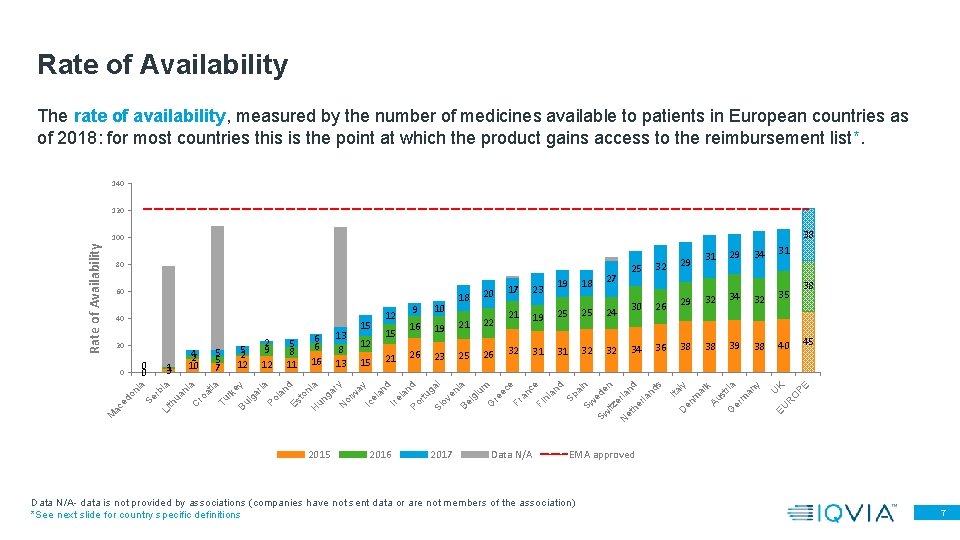
Rate of Availability The rate of availability, measured by the number of medicines available to patients in European countries as of 2018: for most countries this is the point at which the product gains access to the reimbursement list*. 140 120 38 23 26 32 31 31 32 32 2015 2016 2017 Data N/A 39 38 40 30 26 29 34 36 38 38 38 45 PE 21 25 26 35 K 15 15 19 32 O 12 22 24 34 R 13 8 13 21 25 rb ia Li th ua ni a C ro at ia Tu rk e Bu y lg ar ia Po la n Es d to ni a H un ga ry N or w ay Ic el an d Ire la n Po d rtu ga Sl l ov en Be ia lg iu m G re ec e Fr an ce Fi nl an d Sp a Sw in Sw ede n itz er N la et nd he rla nd s a 5 2 12 6 6 16 19 25 31 32 Se ni ac ed o M 1 3 5 5 7 5 8 11 16 21 18 19 34 U 0 0 0 4 2 10 2 9 12 10 23 29 EU 20 15 9 17 32 31 ly m ar k Au st ri G er a m an y 40 12 18 20 25 Ita 60 27 29 en 80 D Rate of Availability 100 EMA approved Data N/A- data is not provided by associations (companies have not sent data or are not members of the association) *See next slide for country specific definitions 7
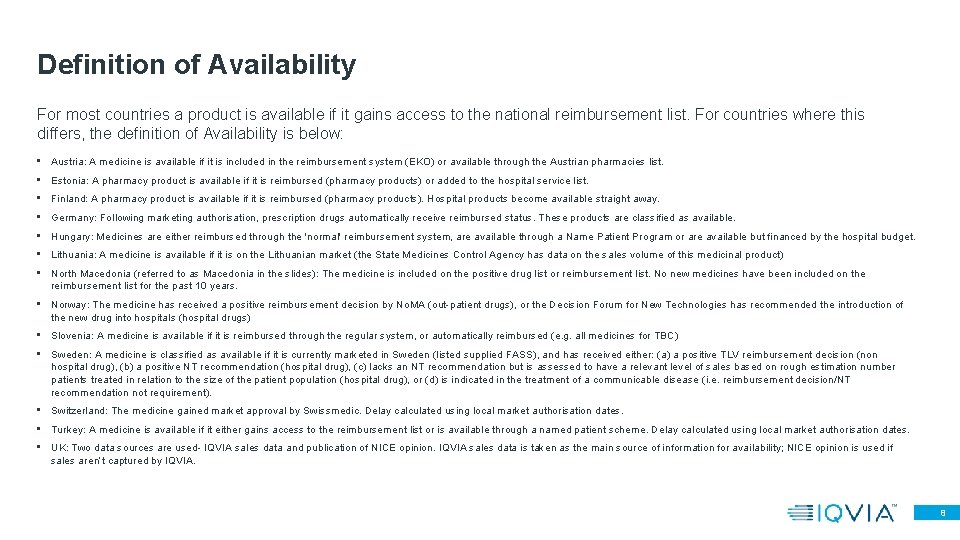
Definition of Availability For most countries a product is available if it gains access to the national reimbursement list. For countries where this differs, the definition of Availability is below: • Austria: A medicine is available if it is included in the reimbursement system (EKO) or available through the Austrian pharmacies list. • Estonia: A pharmacy product is available if it is reimbursed (pharmacy products) or added to the hospital service list. • Finland: A pharmacy product is available if it is reimbursed (pharmacy products). Hospital products become available straight away. • Germany: Following marketing authorisation, prescription drugs automatically receive reimbursed status. These products are classified as available. • Hungary: Medicines are either reimbursed through the 'normal' reimbursement system, are available through a Name Patient Program or are available but financed by the hospital budget. • Lithuania: A medicine is available if it is on the Lithuanian market (the State Medicines Control Agency has data on the sales volume of this medicinal product) • North Macedonia (referred to as Macedonia in the slides): The medicine is included on the positive drug list or reimbursement list. No new medicines have been included on the reimbursement list for the past 10 years. • Norway: The medicine has received a positive reimbursement decision by No. MA (out-patient drugs), or the Decision Forum for New Technologies has recommended the introduction of the new drug into hospitals (hospital drugs) • Slovenia: A medicine is available if it is reimbursed through the regular system, or automatically reimbursed (e. g. all medicines for TBC) • Sweden: A medicine is classified as available if it is currently marketed in Sweden (listed supplied FASS), and has received either: (a) a positive TLV reimbursement decision (non hospital drug), (b) a positive NT recommendation (hospital drug), (c) lacks an NT recommendation but is assessed to have a relevant level of sales based on rough estimation number patients treated in relation to the size of the patient population (hospital drug), or (d) is indicated in the treatment of a communicable disease (i. e. reimbursement decision/NT recommendation not requirement). • Switzerland: The medicine gained market approval by Swissmedic. Delay calculated using local market authorisation dates. • Turkey: A medicine is available if it either gains access to the reimbursement list or is available through a named patient scheme. Delay calculated using local market authorisation dates. • UK: Two data sources are used- IQVIA sales data and publication of NICE opinion. IQVIA sales data is taken as the main source of information for availability; NICE opinion is used if sales aren’t captured by IQVIA. 8
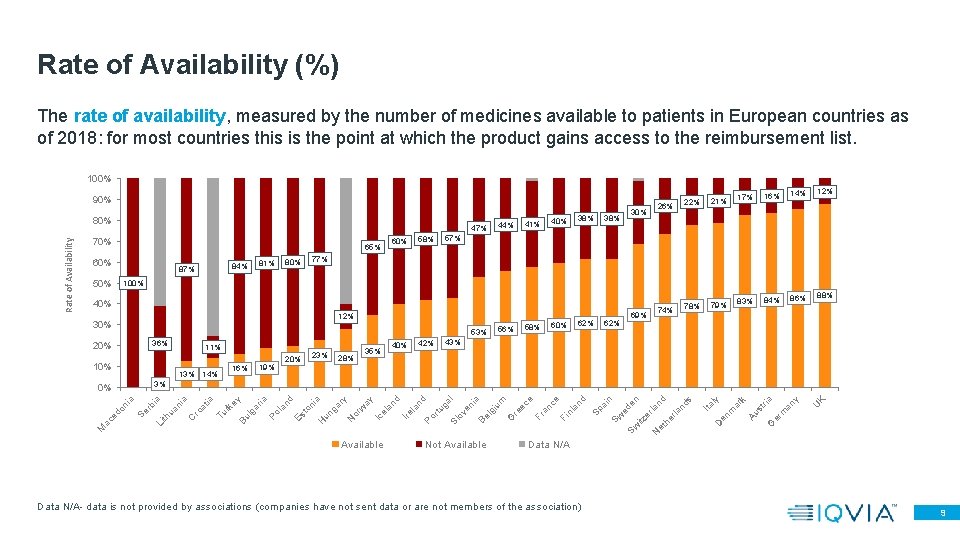
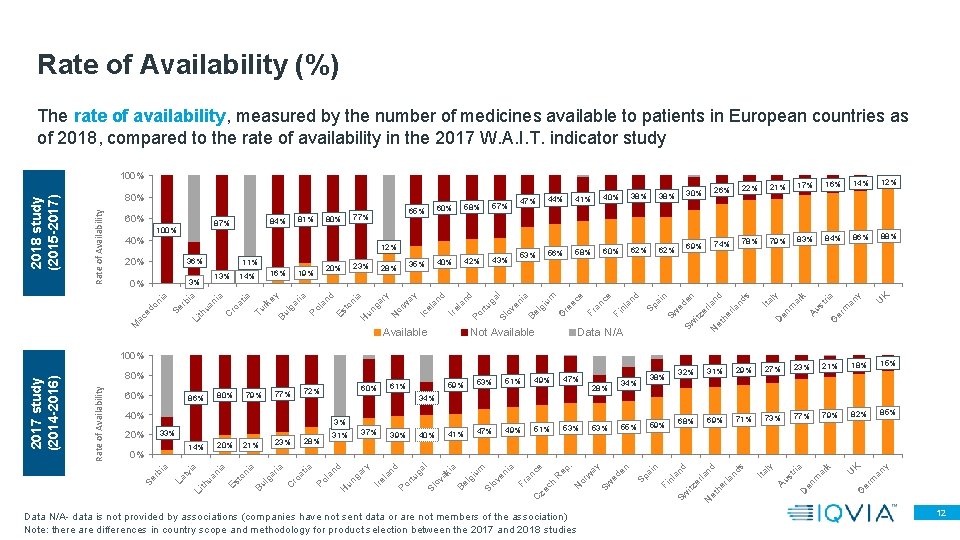
Rate of Availability (%) The rate of availability, measured by the number of medicines available to patients in European countries as of 2018: for most countries this is the point at which the product gains access to the reimbursement list. 100% 90% 47% 70% 65% 60% 84% 87% 50% 81% 60% 58% 44% 41% 38% 30% 78% 79% 17% 16% 14% 12% 83% 84% 86% 88% 57% 100% 40% 12% 30% 53% 36% 20% 11% 16% 13% 14% 20% 19% 23% 35% 28% 40% 42% 56% 58% 60% 62% 69% 74% 43% Available Not Available U K y an m ria G er k ar Au st en m Ita ly D Po rtu ga l Sl ov en ia Be lg iu m G re ec e Fr an ce Fi nl an d Sp ai n Sw e Sw den itz er la N nd et he rla nd s la nd Ire an d ay Ic el ry or w a un ga H on i d Es t an Po l ga ria y rk e Bu l Tu tia ro a C ua ni a ia Li th Se rb on i ac ed a 3% 0% M 26% 21% 77% N Rate of Availability 80% 40% 22% Data N/A- data is not provided by associations (companies have not sent data or are not members of the association) 9
Rate of Availability (%) The rate of availability, measured by the number of medicines available to patients in European countries as of 2018: for most countries this is the point at which the product gains access to the reimbursement list*. 100% 90% 47% 70% 65% 38% 30% 55% 37% 59% 40% 10% 31% 4% Available Not Available 26% U K y an m ria 14% er 2% 9% 15% G 1% 29% k 31% la nd Ire an d ay 60% 22% 1% Ic el ry or w 86% 79% 41% 30% 1% Available (LA) 62% 56% 74% Po rtu ga l Sl ov en ia Be lg iu m G re ec e Fr an ce Fi nl an d Sp ai n Sw e Sw den itz er la N nd et he rla nd s 17% un ga H on i a 3% Es t Po l an d 1 % 34% 20% N 19% ga ria rk e y 5 % Tu tia 7% ro a C ua ni a ia Li th Se rb on i ac ed M 11% a 3% 0% 11% 7% 52% 12% Bu l 2% 10% 49% 21% 69% ar 12% 30% 11% 12% 77% 30% 36% 14% 57% 100% 20% 16% Au st 50% 81% 40% en m 84% 87% 58% 41% 17% 21% Ita ly 60% 44% 22% D Rate of Availability 80% 26% Data N/A- data is not provided by associations (companies have not sent data or are not members of the association) *Available (LA) - products which have been reimbursed or are pending reimbursement, with specific conditions - see next slide for country specific definitions 10
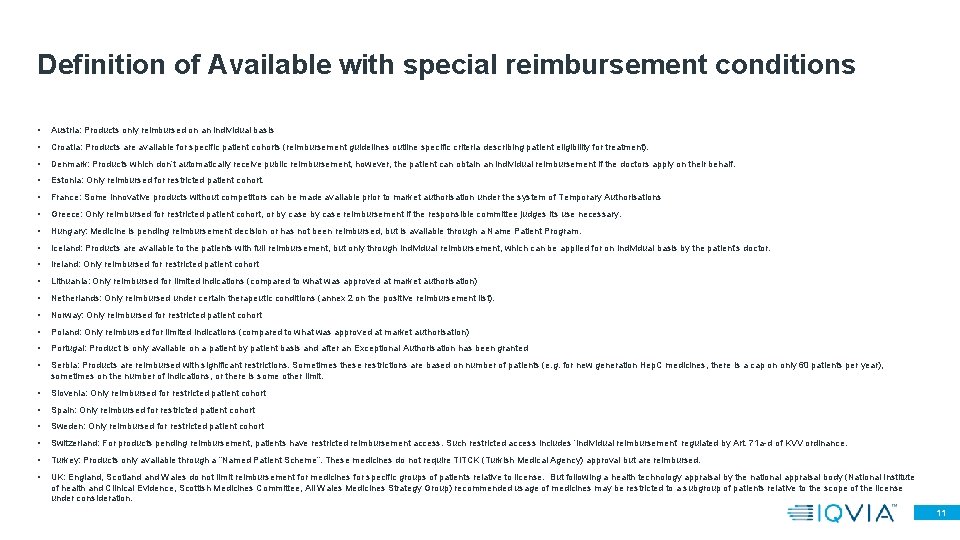
Definition of Available with special reimbursement conditions • Austria: Products only reimbursed on an individual basis • Croatia: Products are available for specific patient cohorts (reimbursement guidelines outline specific criteria describing patient eligibility for treatment). • Denmark: Products which don’t automatically receive public reimbursement, however, the patient can obtain an individual reimbursement if the doctors apply on their behalf. • Estonia: Only reimbursed for restricted patient cohort. • France: Some innovative products without competitors can be made available prior to market authorisation under the system of Temporary Authorisations • Greece: Only reimbursed for restricted patient cohort, or by case reimbursement if the responsible committee judges its use necessary. • Hungary: Medicine is pending reimbursement decision or has not been reimbursed, but is available through a Name Patient Program. • Iceland: Products are available to the patients with full reimbursement, but only through individual reimbursement, which can be applied for on individual basis by the patient’s doctor. • Ireland: Only reimbursed for restricted patient cohort • Lithuania: Only reimbursed for limited indications (compared to what was approved at market authorisation) • Netherlands: Only reimbursed under certain therapeutic conditions (annex 2 on the positive reimbursement list). • Norway: Only reimbursed for restricted patient cohort • Poland: Only reimbursed for limited indications (compared to what was approved at market authorisation) • Portugal: Product is only available on a patient by patient basis and after an Exceptional Authorisation has been granted • Serbia: Products are reimbursed with significant restrictions. Sometimes these restrictions are based on number of patients (e. g. for new generation Hep. C medicines, there is a cap on only 60 patients per year), sometimes on the number of indications, or there is some other limit. • Slovenia: Only reimbursed for restricted patient cohort • Spain: Only reimbursed for restricted patient cohort • Sweden: Only reimbursed for restricted patient cohort • Switzerland: For products pending reimbursement, patients have restricted reimbursement access. Such restricted access includes ‘individual reimbursement’ regulated by Art. 71 a-d of KVV ordinance. • Turkey: Products only available through a “Named Patient Scheme”. These medicines do not require TITCK (Turkish Medical Agency) approval but are reimbursed. • UK: England, Scotland Wales do not limit reimbursement for medicines for specific groups of patients relative to license. But following a health technology appraisal by the national appraisal body (National Institute of health and Clinical Evidence, Scottish Medicines Committee, All Wales Medicines Strategy Group) recommended usage of medicines may be restricted to a subgroup of patients relative to the scope of the license under consideration. 11
Rate of Availability (%) The rate of availability, measured by the number of medicines available to patients in European countries as of 2018, compared to the rate of availability in the 2017 W. A. I. T. indicator study 62% Not Available y Data N/A 38% 34% 29% 27% 23% 21% 18% 15% 68% 69% 71% 73% 77% 79% 82% 85% Data N/A- data is not provided by associations (companies have not sent data or are not members of the association) Note: there are differences in country scope and methodology for product selection between the 2017 and 2018 studies y an m er k ar U K G D en m ria Au st Ita ly s 59% 55% nd 53% er la 51% et h 49% er la 47% N 41% Po rtu ga l Sl ov ak ia Be lg iu m Sl ov en ia Fr an ce C ze ch R ep. N or w ay Sw ed en 40% la nd Ire un ga H 39% an d 37% ry d an Po l tia ro a C Bu l ga ria a 31% 28% 23% 21% Es t ua ni a a tv i Li th La Se rb 20% on i 14% 0% 28% nl 3% 33% 47% 31% 34% 40% 20% 49% 32% Sw itz 77% 51% Fi 79% 80% 53% ai n 86% 59% 61% 60% 72% Sp 60% ia Rate of Availability 2017 study (2014 -2016) 100% 80% U K 88% an 62% 60% 84% m 58% 83% ria 56% 79% er 53% 78% G 43% 74% 86% 69% la nd Po rtu ga l Sl ov en ia Be lg iu m G re ec e Fr an ce Fi nl an d Sp ai n Sw e Sw den itz er la N nd et he rla nd s Available 42% 40% Ire an d ay Ic el N or w un ga H 40% 35% 28% ry a 23% on i d an Po l ga ria y Tu ro a rk e tia a C Li th ua ni ia a Se rb on i ac ed M 20% 19% 16% 14% Bu l 13% 3% 0% 11% Es t 36% 20% 41% 12% k 12% 44% 16% Au st 40% 47% 17% ar 77% 57% 22% en m 80% 81% 84% 87% 100% 58% 26% 14% 30% 21% 38% D 60% 65% 38% Ita ly 80% Rate of Availability 2018 study (2015 -2017) 100% 12
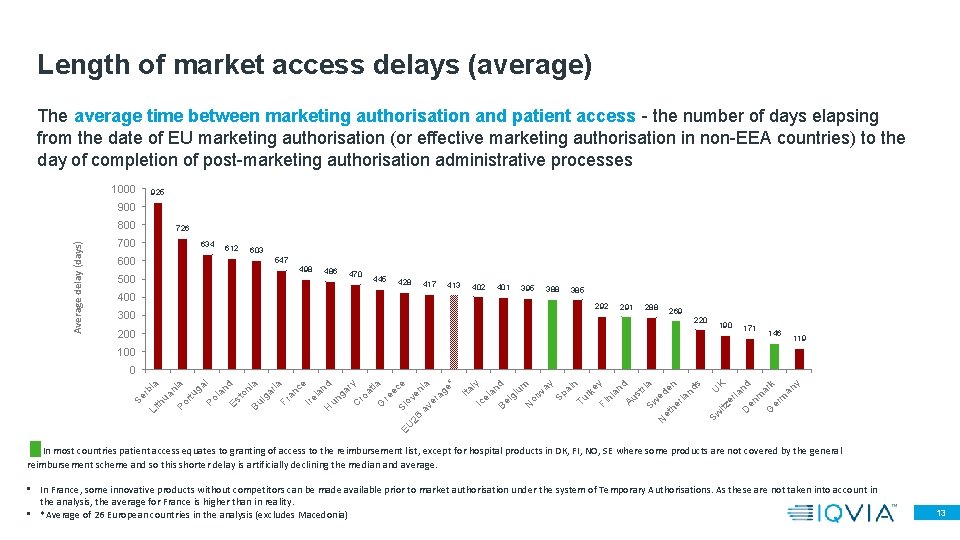
Length of market access delays (average) The average time between marketing authorisation and patient access - the number of days elapsing from the date of EU marketing authorisation (or effective marketing authorisation in non-EEA countries) to the day of completion of post-marketing authorisation administrative processes 1000 925 900 Average delay (days) 800 726 700 634 612 603 600 547 498 500 486 470 445 428 400 417 413 402 401 395 388 385 292 300 291 288 269 220 190 171 146 119 100 ec e o 26 ve av nia er ag e* Ita l Ic y el an Be d lg iu m N or w ay Sp ai n Tu rk e Fi y nl an d Au st r Sw ia ed N et he en rla nd s Sw U K itz er la n D en d m G ark er m an y ia EU Sl re at G ry ro C ga nd H un la ce Ire an a ria Fr ga ni to Bu l l nd Es la ga Po a rtu ni Po ua th Li Se rb ia 0 In most countries patient access equates to granting of access to the reimbursement list, except for hospital products in DK, FI, NO, SE where some products are not covered by the general reimbursement scheme and so this shorter delay is artificially declining the median and average. • In France, some innovative products without competitors can be made available prior to market authorisation under the system of Temporary Authorisations. As these are not taken into account in the analysis, the average for France is higher than in reality. • *Average of 26 European countries in the analysis (excludes Macedonia) 13
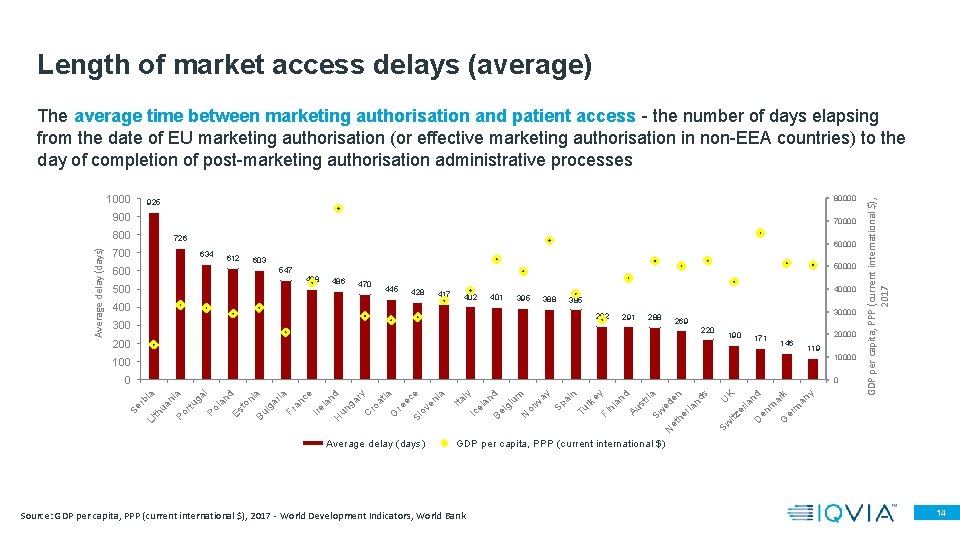
Length of market access delays (average) 1000 80000 925 900 70000 Average delay (days) 800 726 60000 700 634 612 603 600 50000 547 498 500 486 470 445 428 417 402 401 40000 395 400 388 385 292 300 291 288 269 30000 220 190 200 171 146 20000 119 10000 100 0 Average delay (days) y er m an k ar m G en D Sw itz er la nd K U d Au st ri Sw a ed N et en he rla nd s an nl ey Fi rk n Tu ai Sp ay N or w iu m d lg an Be ly Ic el Ita en ia e ov Sl re ec ia at G ro ry C ga nd H un la ce Ire an a ria Fr ga to ni Bu l la nd Es l Po ga a rtu ni Po ua th Li Se rb ia 0 GDP per capita, PPP (current international $), 2017 The average time between marketing authorisation and patient access - the number of days elapsing from the date of EU marketing authorisation (or effective marketing authorisation in non-EEA countries) to the day of completion of post-marketing authorisation administrative processes GDP per capita, PPP (current international $) Source: GDP per capita, PPP (current international $), 2017 - World Development Indicators, World Bank 14
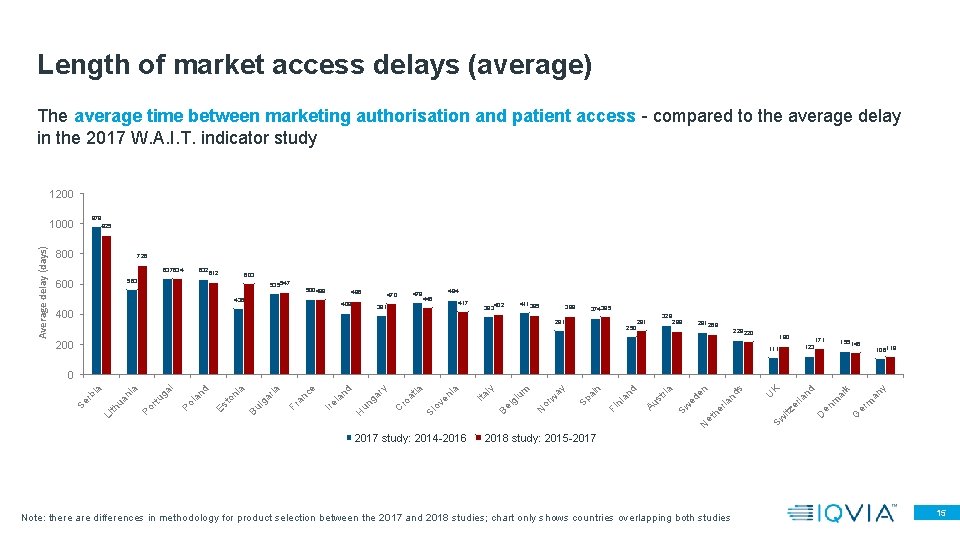
Length of market access delays (average) The average time between marketing authorisation and patient access - compared to the average delay in the 2017 W. A. I. T. indicator study 1200 979 Average delay (days) 1000 925 800 726 637634 632 612 603 563 600 535547 500498 486 436 479 470 408 494 445 417 391 400 411395 383402 388 374385 291 250 291 329 288 281269 228220 200 190 171 155146 123 111 106119 2017 study: 2014 -2016 y an k m er G en D er itz Sw m la ar nd K U s nd N et he rla ed en a Sw Au st ri Fi nl an d n ai Sp ay w or N lg iu m ly Ita Be ov en ia ia Sl at ro un H C ga ry nd la Ire ce an Fr a ria ga Bu l ni to Es l nd la Po rtu ga a Po ni ua th Li Se rb ia 0 2018 study: 2015 -2017 Note: there are differences in methodology for product selection between the 2017 and 2018 studies; chart only shows countries overlapping both studies 15
Length of market access delays (average, maximum, minimum) The average time between marketing authorisation and patient access - the number of days elapsing from the date of EU marketing authorisation (or effective marketing authorisation in non-EEA countries) to the day of completion of post-marketing authorisation administrative processes 1600 1400 1200 80 1000 925 726 60 634 40 800 612 603 547 498 486 470 445 428 600 417 402 401 395 388 385 292 291 288 20 269 Delay (days) No. of products in sample 120 400 220 190 171 146 119 ga Po l la n Es d to n Bu ia lg ar ia Fr an ce Ire la H nd un ga r C y ro at i G a re e Sl ce ov en ia Ita l Ic y el an Be d lg iu m N or w ay Sp ai n Tu rk e Fi y nl an d Au st r Sw ia ed N et he en rla nd s Sw U itz K er la n D en d m G ark er m an y rtu Po ua n rb i th Li Se ia 0 200 # of Products with accessibility date Maximum delay Minimum delay Average • In most countries patient access equates to granting of access to the reimbursement list, except for hospital products in DK, FI, NO, SE where some products are not covered by the general reimbursement scheme and so this shorter delay is artificially declining the median and average. • In France, some innovative products without competitors can be made available prior to market authorisation under the system of Temporary Authorisations. As these are not taken into account in the analysis, the average for France is higher than in reality. 16
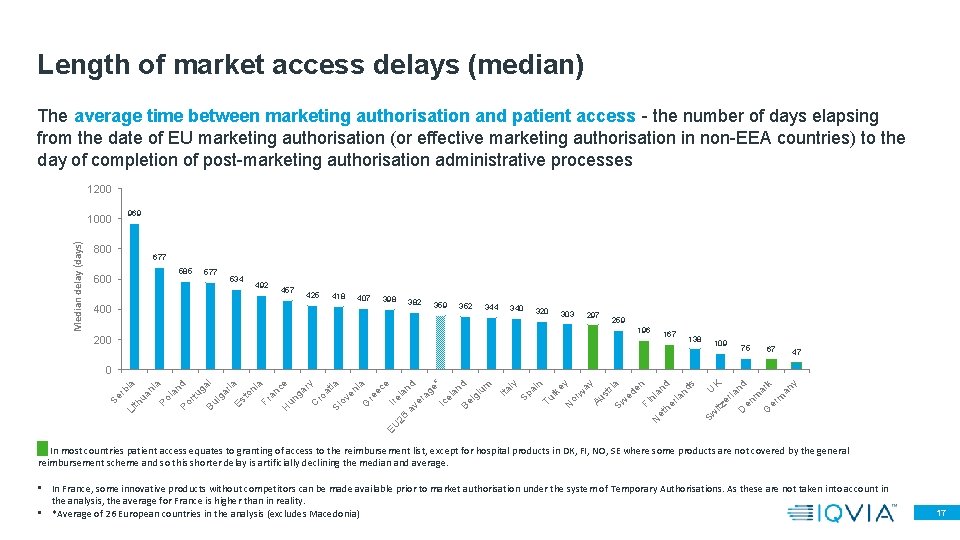
Length of market access delays (median) The average time between marketing authorisation and patient access - the number of days elapsing from the date of EU marketing authorisation (or effective marketing authorisation in non-EEA countries) to the day of completion of post-marketing authorisation administrative processes 1200 969 Median delay (days) 1000 800 677 585 600 577 534 492 457 425 418 407 400 398 382 359 352 344 340 320 303 297 259 196 200 167 138 109 75 67 47 y er m an k ar m G en D Sw itz er la nd K U ay Au st r Sw ia ed en Fi n N et land he rla nd s w ey or N rk n ai Tu ly Sp Ita iu m d lg an Be el e* Ic ag EU 26 av er la nd e Ire ec re G en ia ia ov at Sl ro ry C ga ce un an H a ni Fr to ria Es l ga ga Bu l rtu nd la Po a ni Po ua th Li Se rb ia 0 In most countries patient access equates to granting of access to the reimbursement list, except for hospital products in DK, FI, NO, SE where some products are not covered by the general reimbursement scheme and so this shorter delay is artificially declining the median and average. • In France, some innovative products without competitors can be made available prior to market authorisation under the system of Temporary Authorisations. As these are not taken into account in the analysis, the average for France is higher than in reality. • *Average of 26 European countries in the analysis (excludes Macedonia) 17
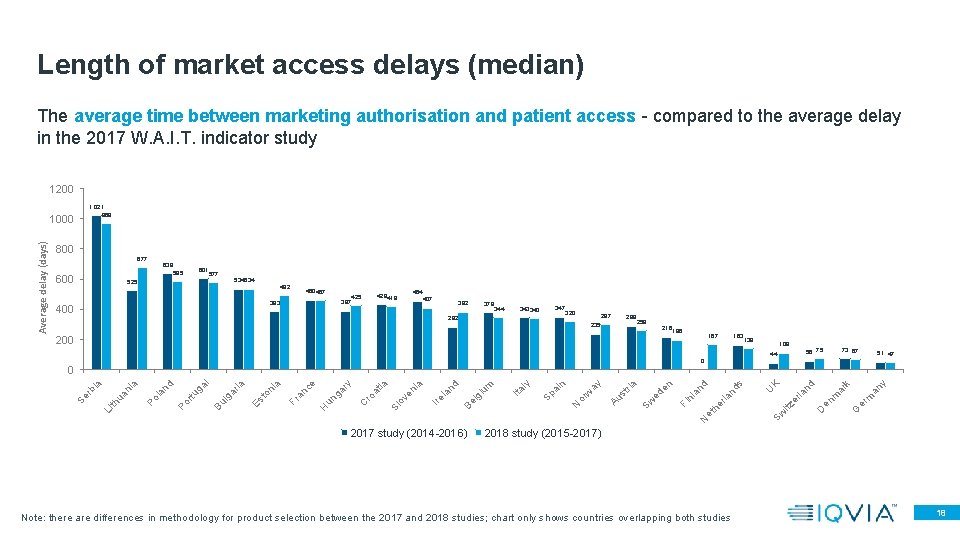
Length of market access delays (median) The average time between marketing authorisation and patient access - compared to the average delay in the 2017 W. A. I. T. indicator study 1200 1, 021 969 288 259 216 200 196 167 163 nd s d an N et he nl Fi ed en a Sw w or N Au st ri ay n ai ly Ita Sp Be lg iu m nd la Ire ov en ia ia Sl at ro C un ga ry ce H an Fr a ni to Es ria ga l Bu l rtu ga nd la Po Po Li th ua ni a ia rb Se 2017 study (2014 -2016) 109 56 75 44 0 0 138 73 67 51 47 y 297 235 an 320 m 347 343340 er 344 282 k 378 G 382 ar 407 m 400 454 429418 425 en 387 D 460457 383 nd 492 la 534534 er 577 525 K 601 585 600 itz 638 U 677 Sw 800 rla Average delay (days) 1000 2018 study (2015 -2017) Note: there are differences in methodology for product selection between the 2017 and 2018 studies; chart only shows countries overlapping both studies 18
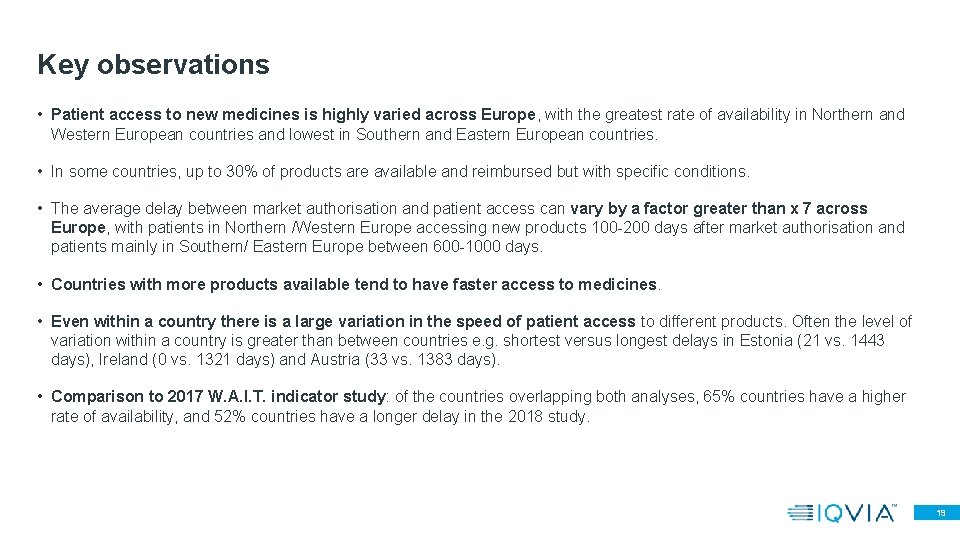
Key observations • Patient access to new medicines is highly varied across Europe, with the greatest rate of availability in Northern and Western European countries and lowest in Southern and Eastern European countries. • In some countries, up to 30% of products are available and reimbursed but with specific conditions. • The average delay between market authorisation and patient access can vary by a factor greater than x 7 across Europe, with patients in Northern /Western Europe accessing new products 100 -200 days after market authorisation and patients mainly in Southern/ Eastern Europe between 600 -1000 days. • Countries with more products available tend to have faster access to medicines. • Even within a country there is a large variation in the speed of patient access to different products. Often the level of variation within a country is greater than between countries e. g. shortest versus longest delays in Estonia (21 vs. 1443 days), Ireland (0 vs. 1321 days) and Austria (33 vs. 1383 days). • Comparison to 2017 W. A. I. T. indicator study: of the countries overlapping both analyses, 65% countries have a higher rate of availability, and 52% countries have a longer delay in the 2018 study. 19
Orphans 20
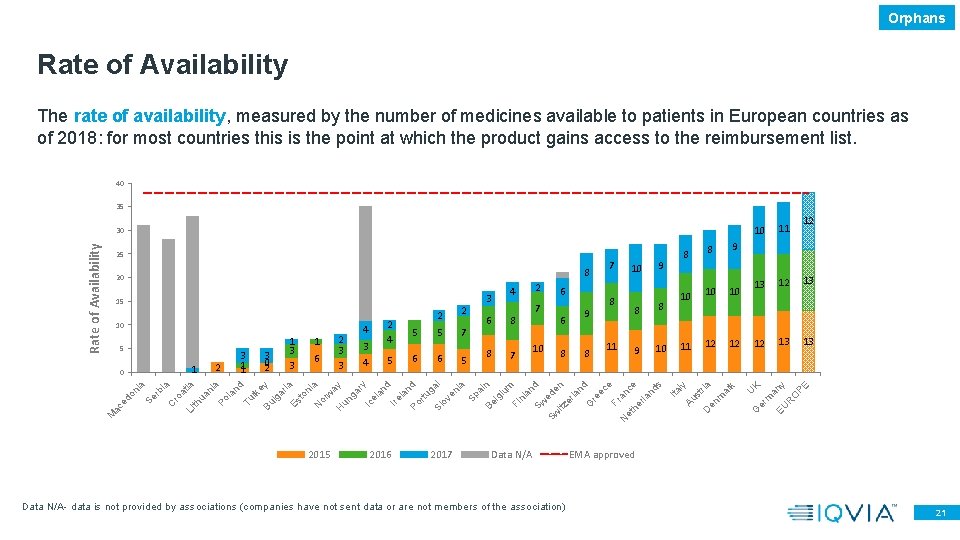
Orphans Rate of Availability The rate of availability, measured by the number of medicines available to patients in European countries as of 2018: for most countries this is the point at which the product gains access to the reimbursement list. 40 35 2016 2017 Data N/A- data is not provided by associations (companies have not sent data or are not members of the association) 12 12 12 13 13 PE rb 2015 11 O 10 R 9 an y 11 EU 8 13 K 8 12 m 5 10 13 U 6 7 11 er 6 8 12 10 G 5 7 k 4 5 9 10 m ar 3 5 6 8 ia ro at ia Li th ua ni a Po la nd Tu rk e Bu y lg ar ia Es to ni a N or w ay H un ga ry Ic el an d Ire la n Po d rtu ga Sl l ov en ia Sp a Be in lg iu m Fi nl an Sw d Sw ede n itz er la nd G re ec e Fr a N nc et e he rla nd s 6 4 8 8 C a Se ni ac ed o M 2 3 0 2 2 3 3 6 8 10 ria 1 0 3 1 1 1 2 7 10 en 5 1 3 3 2 4 3 9 9 st 10 2 6 10 8 ly 15 2 4 7 Ita 8 20 8 D 25 Au Rate of Availability 30 EMA approved 21
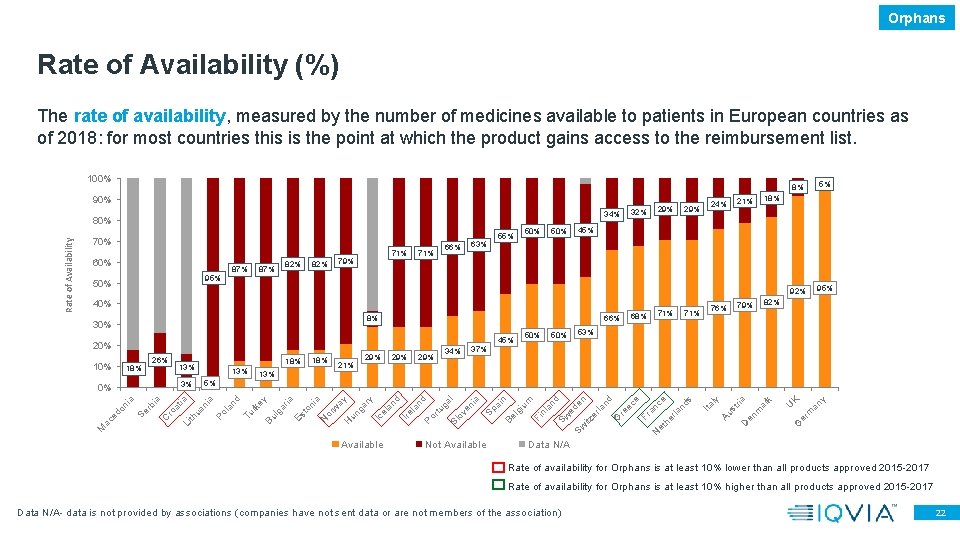
Orphans Rate of Availability (%) The rate of availability, measured by the number of medicines available to patients in European countries as of 2018: for most countries this is the point at which the product gains access to the reimbursement list. 100% 90% 34% 70% 60% 87% 95% 82% 79% 82% 71% 66% 55% 50% 66% 8% 20% 13% 21% 13% 29% 29% 34% 50% 68% 71% 95% 76% 82% 79% 53% Not Available y an m U K er G k ar ria en m H Available D ay un ga ry Ic el an d Ire la nd Po rtu ga l Sl ov en ia Sp ai n Be lg iu m Fi nl an d Sw en itz er la nd G re ec e Fr an N ce et he rla nd s a or w N on i Es t y ga ria Bu l rk e d Tu ua ni tia Li th ro a a ia C Se rb on i ac ed M 18% 45% 92% 18% 21% 5% a 3% 0% 13% an 18% Po l 10% 26% 37% 24% 5% 40% 30% 29% Au st 50% 87% 71% 63% 29% Ita ly Rate of Availability 80% 32% 8% Data N/A Rate of availability for Orphans is at least 10% lower than all products approved 2015 -2017 Rate of availability for Orphans is at least 10% higher than all products approved 2015 -2017 Data N/A- data is not provided by associations (companies have not sent data or are not members of the association) 22
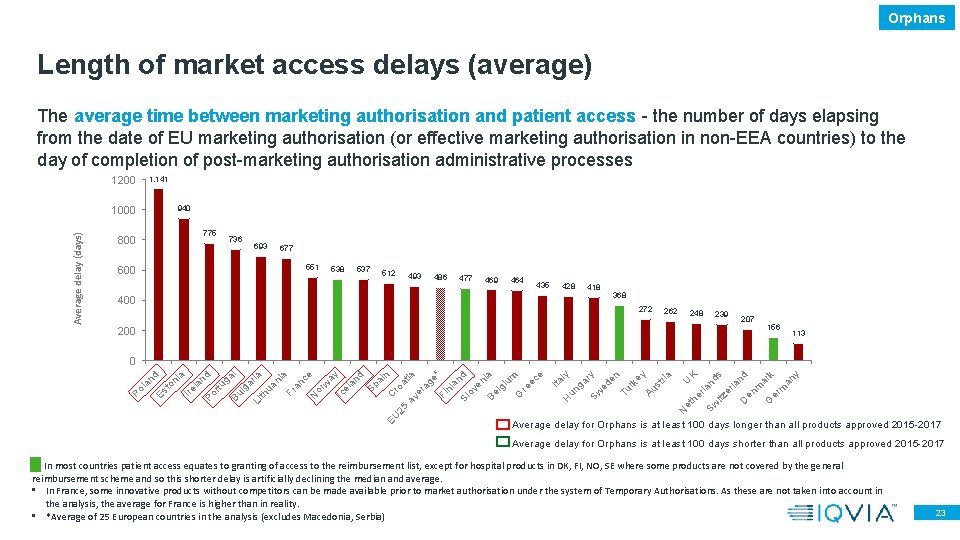
Orphans Length of market access delays (average) The average time between marketing authorisation and patient access - the number of days elapsing from the date of EU marketing authorisation (or effective marketing authorisation in non-EEA countries) to the day of completion of post-marketing authorisation administrative processes 1200 1, 141 Average delay (days) 1000 940 775 800 736 693 677 551 600 538 537 512 493 486 477 469 464 435 428 400 418 368 272 262 248 239 207 156 200 113 y an k m er G en m ar nd la er itz Sw D nd s K rla U et he ga Sw ry ed en Tu rk ey Au st ria ly un Ita H e re ec m iu lg Be en ia d ov an nl Sl Fi G N 25 av er ag at ro C EU e* ia n ai d Sp an el ay Ic w ce or an a ni Fr N Li th ua ria l ga ga Bu l rtu nd la Po a Ire ni to Es Po la nd 0 Average delay for Orphans is at least 100 days longer than all products approved 2015 -2017 Average delay for Orphans is at least 100 days shorter than all products approved 2015 -2017 In most countries patient access equates to granting of access to the reimbursement list, except for hospital products in DK, FI, NO, SE where some products are not covered by the general reimbursement scheme and so this shorter delay is artificially declining the median and average. • In France, some innovative products without competitors can be made available prior to market authorisation under the system of Temporary Authorisations. As these are not taken into account in the analysis, the average for France is higher than in reality. • *Average of 25 European countries in the analysis (excludes Macedonia, Serbia) 23
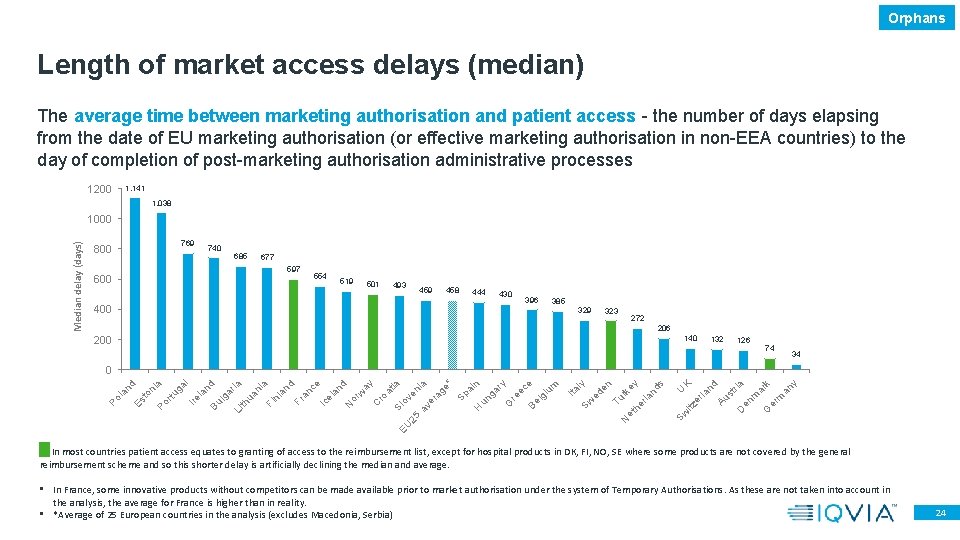
Orphans Length of market access delays (median) The average time between marketing authorisation and patient access - the number of days elapsing from the date of EU marketing authorisation (or effective marketing authorisation in non-EEA countries) to the day of completion of post-marketing authorisation administrative processes 1200 1, 141 1, 038 Median delay (days) 1000 769 800 740 685 677 597 600 554 519 501 493 459 458 444 430 400 396 385 329 323 272 206 200 140 132 126 74 34 nd Au st ria D en m ar G k er m an y Sw itz er la K U s nd rla ey rk he N et Tu en ly ed Ita Sw iu m e lg ec Be re G ga ry n ai un H Sp e* EU 25 av er ag en ia ia ov at Sl ro ay w or N C d an el ce Ic an d Fr an nl Fi ua ni a ria th ga Li nd la Bu l Ire ga l a rtu ni Po to Es Po la nd 0 In most countries patient access equates to granting of access to the reimbursement list, except for hospital products in DK, FI, NO, SE where some products are not covered by the general reimbursement scheme and so this shorter delay is artificially declining the median and average. • In France, some innovative products without competitors can be made available prior to market authorisation under the system of Temporary Authorisations. As these are not taken into account in the analysis, the average for France is higher than in reality. • *Average of 25 European countries in the analysis (excludes Macedonia, Serbia) 24
Oncology 25
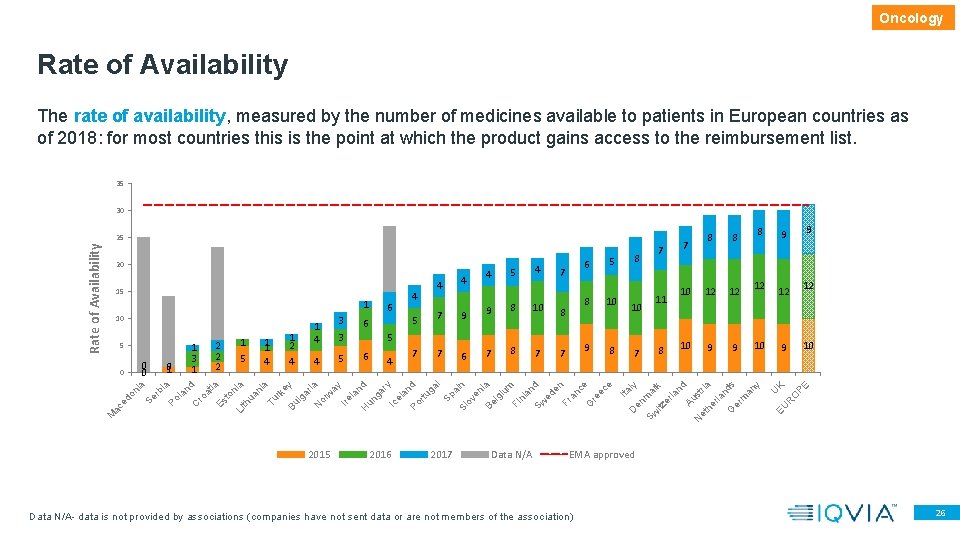
Oncology Rate of Availability The rate of availability, measured by the number of medicines available to patients in European countries as of 2018: for most countries this is the point at which the product gains access to the reimbursement list. 35 30 4 7 7 7 9 8 2015 2016 2017 Data N/A 10 7 8 10 9 9 12 12 12 10 10 9 PE 6 10 12 K 8 5 8 12 O 7 8 10 9 9 R 6 10 11 7 8 U 4 7 8 rk e Bu y lg ar ia N or w ay Ire la nd H un ga ry Ic el an Po d rtu ga l Sp ai n Sl ov en Be ia lg iu m Fi nl an Sw d ed en Fr an ce G re ec e ia 4 3 5 5 6 9 Tu th u an ia 5 to n ia Es ro at la nd ia Po rb a Se ni 1 2 1 1 4 3 9 M ac ed o 0 1 C 0 0 0 1 2 2 2 1 3 1 Li 5 1 4 7 5 8 EU 10 6 4 6 7 7 8 ly m Sw a itz rk er la nd Au N st et r he ia rla nd G er s m an y 1 4 4 4 5 Ita 15 4 en 20 8 D Rate of Availability 25 EMA approved Data N/A- data is not provided by associations (companies have not sent data or are not members of the association) 26
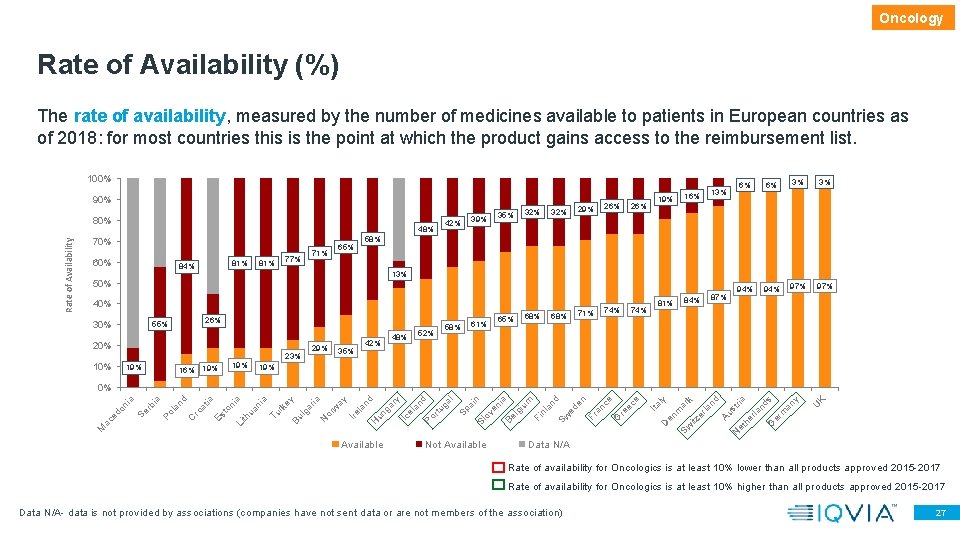
Oncology Rate of Availability (%) The rate of availability, measured by the number of medicines available to patients in European countries as of 2018: for most countries this is the point at which the product gains access to the reimbursement list. 100% 90% Rate of Availability 80% 48% 70% 60% 81% 84% 81% 77% 65% 71% 35% 39% 42% 32% 26% 55% 20% 23% 19% 26% 19% 81% 84% 87% 6% 6% 3% 3% 94% 97% 13% 40% 10% 26% 13% 58% 50% 30% 29% 16% 19% 29% 35% 42% 48% 52% 65% 61% 58% 68% 71% 74% 19% Available Not Available U K ar Sw k itz er la nd Au st N ria et he rla nd s G er m an y en m Ita ly D ni a Be lg iu m Fi nl an d Sw ed en Fr an ce G re ec e ov e l ai n Sl Sp Po rtu ga an d ry Ic el H un ga la nd ay Ire or w N ga ria y rk e Bu l Tu a a ua ni on i Es t ro a tia d C an ia Po l Se rb Li th M ac ed on i a 0% Data N/A Rate of availability for Oncologics is at least 10% lower than all products approved 2015 -2017 Rate of availability for Oncologics is at least 10% higher than all products approved 2015 -2017 Data N/A- data is not provided by associations (companies have not sent data or are not members of the association) 27
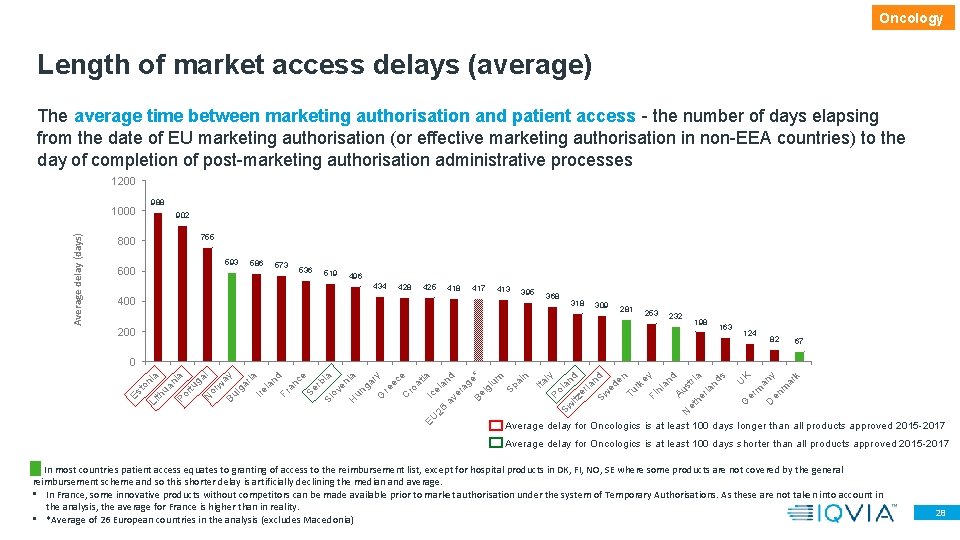
Oncology Length of market access delays (average) The average time between marketing authorisation and patient access - the number of days elapsing from the date of EU marketing authorisation (or effective marketing authorisation in non-EEA countries) to the day of completion of post-marketing authorisation administrative processes 1200 988 Average delay (days) 1000 902 755 800 593 600 586 573 536 519 496 434 400 200 428 425 418 417 413 395 368 318 309 281 253 232 198 163 124 82 67 ar k y m an en D K m U er G l Bu ay lg ar ia Ire la nd Fr an ce Se rb ia Sl ov en ia H un ga r G y re ec C e ro at i EU Ic a 26 ela av nd er ag Be e* lg iu m Sp ai n Ita l Po y Sw la itz nd er la n Sw d ed en Tu rk e Fi y nl an d Au N s t et he ria rla nd s w or ga N a rtu ni Po ua th Li Es to ni a 0 Average delay for Oncologics is at least 100 days longer than all products approved 2015 -2017 Average delay for Oncologics is at least 100 days shorter than all products approved 2015 -2017 In most countries patient access equates to granting of access to the reimbursement list, except for hospital products in DK, FI, NO, SE where some products are not covered by the general reimbursement scheme and so this shorter delay is artificially declining the median and average. • In France, some innovative products without competitors can be made available prior to market authorisation under the system of Temporary Authorisations. As these are not taken into account in the analysis, the average for France is higher than in reality. • *Average of 26 European countries in the analysis (excludes Macedonia) 28
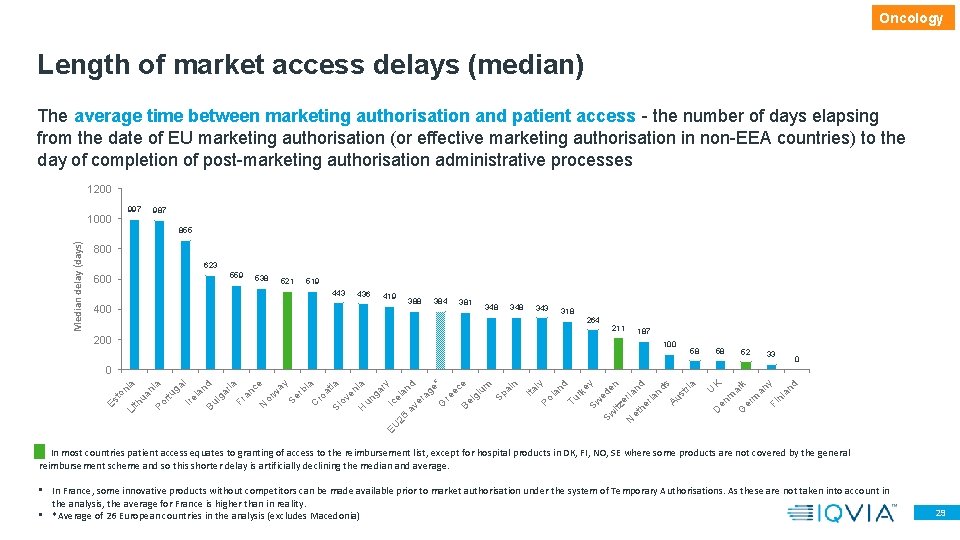
Oncology Length of market access delays (median) The average time between marketing authorisation and patient access - the number of days elapsing from the date of EU marketing authorisation (or effective marketing authorisation in non-EEA countries) to the day of completion of post-marketing authorisation administrative processes 1200 997 1000 987 Median delay (days) 855 800 623 559 600 538 521 519 443 436 419 388 400 384 381 348 343 318 264 211 187 200 100 58 58 52 33 0 an d y nl an m er G Fi k ar K m U en D a s Au st ri nd nd rla la he er et N Sw itz ed en ey rk Sw nd Tu la ly Po Ita n m ai Sp iu lg ec e Be re G ag e* d EU 26 av er an ry el Ic H un ga en ia ia Sl ov at ia ro rb C ay Se or w ce N an ria Fr ga l nd Bu l la ga Ire a rtu ni Po ua th Li Es to ni a 0 In most countries patient access equates to granting of access to the reimbursement list, except for hospital products in DK, FI, NO, SE where some products are not covered by the general reimbursement scheme and so this shorter delay is artificially declining the median and average. • In France, some innovative products without competitors can be made available prior to market authorisation under the system of Temporary Authorisations. As these are not taken into account in the analysis, the average for France is higher than in reality. • *Average of 26 European countries in the analysis (excludes Macedonia) 29
Key observations: Orphan and Oncology drugs • Patient access to new Orphan and Oncology medicines is highly varied across Europe, with the greatest rate of availability in Northern and Western European countries. • Orphan drugs - In 78% of the countries, the rate of availability is lower for Orphan drugs compared to all products approved between 2015 -2017 - 80% of the countries have a longer average delay to EMA authorisation for Orphan drugs compared to all products approved 2015 -2017 - The average delay between market authorisation and patient access for Orphan drugs is between 4 months to 3 years • Oncology drugs - In 78% of the countries, the rate of availability is higher for Oncology products compared to all products approved between 2015 -2017 - The average delay between market authorisation and patient access for Oncology products is between 2 months to over 2. 5 years 30
Appendix - Products approved between 2014 -2015 -2016 -2017 (165 products) - Products approved between 2014 -2015 -2016 (127 products) 38