Efficient Data Presentation Cezmi A Akdis EditorinChief How


- Slides: 33
Efficient Data Presentation Cezmi A. Akdis Editor-in-Chief
How to present your data in a talk in an article
Number of slides § 1 slide per minute excluding the title and acknowledgements slides § 10 -minute presentation should have max 12 slides
Design Keep a consistent design throughout the whole presentation § Select Slide Master before you start preparing your presentation, then stick to it § Changing styles distracts attention § Select a modest design only if you really need one
Amount of text § Do not include large amounts of text on the slide § Maximum 30 words per slide, max 6 lines § Do not show complete sentences on the screen and then simply read them
Text size § Recommended 24 -32 points § Not smaller than 18 points even in graphs § Title up to 54 points
Fonts Keep consistent font style throughout the whole presentation § Use common easy-reading fonts Calibri Times New Roman Arial § Avoid sophisticated fonts Trattatello. Embassy BT Giddyup § Use bold text instead of CAPITAL LETTERS
Animations § Use where necessary § Animate bulleted points to appear one at a time and then speak to each point in turn § Once you move on to the next point, the previous point should fade to a less prominent color if you leave it on screen
Animations Too fancy animations or slide transitions should be avoided, unless they serve a specific purpose Text from the left Text from the right Swiveling text
Colours § Avoid strong primary colours § Consider colour-blindness green almost impossible to read text if some these combinations are used red
Logos § Although some institutions insist on showing their logos on every slide… § …corporate logos should be restricted to first and last slides, if possible
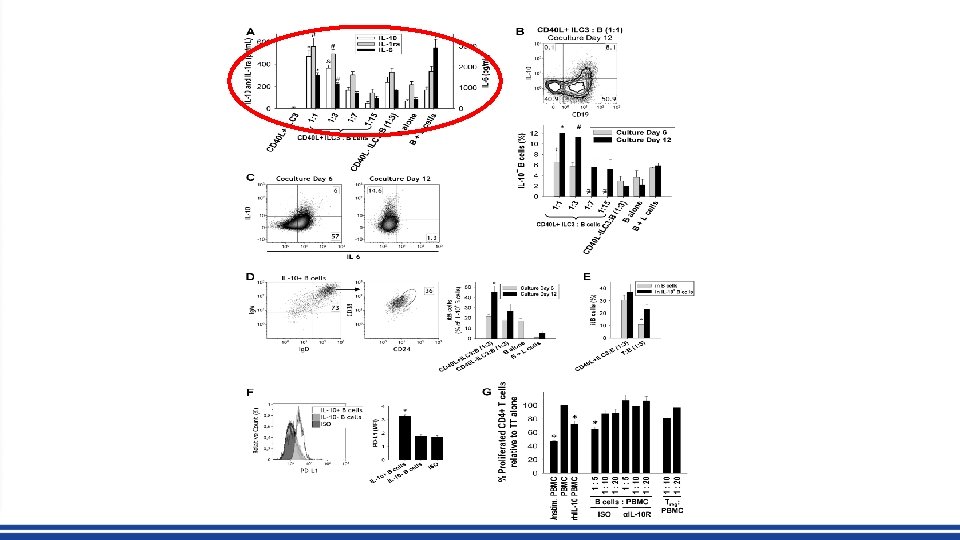
Too busy slides Good for a publication, not for a presentation
Use a descriptive title
Blurred images
How to present your data in a talk in an article
Title § Always use descriptive title with a message such as “Increased Bronchial Epthelial Cell Metabolic Activity in Asthma Exacerbations” instead of “Epithelial Cell Metabolic Activity in Asthma” § Avoid abbreviations if possible
Data demonstration § Try to demonstrate original data, as original as possible § Use novel imaging and video techniques § Always ask your friends, fellows, students their impressions before publicly trying new visualization techniques
Data demonstration § Avoid bar graphs if possible § Instead try to use dotted graphs § Show time kinetics and dose response § Show statistics
Data demonstration § Do not show too many panels § Do not show unnecessary data
Consider print size Calculate that the figure will be shrinked to 1/4, 1/8 of a page when printed
Use readable font size
Get rid of dead space
Data visualisation Tan et al. Allergy. 2019; 74: 294– 307
How to present your data
Developing standardized Making illustrations based and uniform style on the authors’ drafts of Allergy graphics GRAPHICS EDITOR Designing Covers Improving graphical Communicating graphical abstracts and algorithms requirements to the authors submitted by the authors
Graphics Collection
Graphics Collection
Graphical Abstracts
New Illustrations
New Illustrations
New Illustrations
New Algorithms