
Efficiency Ratio Analysis HL Unit 3 6 Source


- Slides: 9
Efficiency Ratio Analysis HL Unit 3. 6 Source: BM Textbook by Paul Hoang
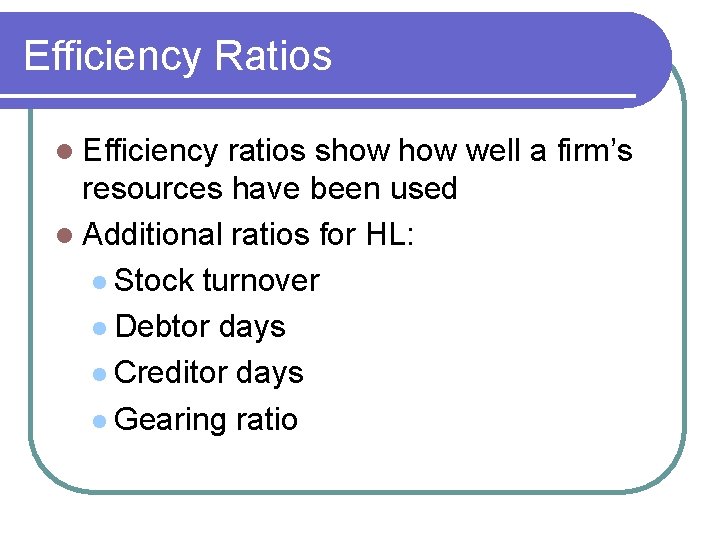
Efficiency Ratios l Efficiency ratios show well a firm’s resources have been used l Additional ratios for HL: l Stock turnover l Debtor days l Creditor days l Gearing ratio
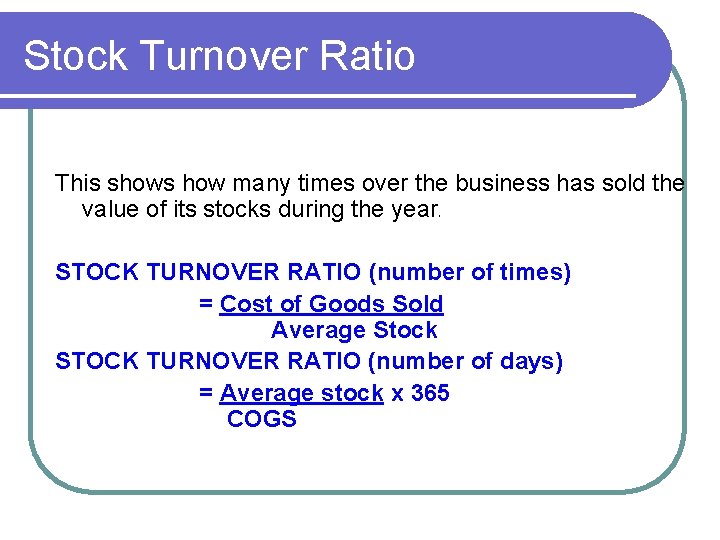
Stock Turnover Ratio This shows how many times over the business has sold the value of its stocks during the year. STOCK TURNOVER RATIO (number of times) = Cost of Goods Sold Average Stock STOCK TURNOVER RATIO (number of days) = Average stock x 365 COGS
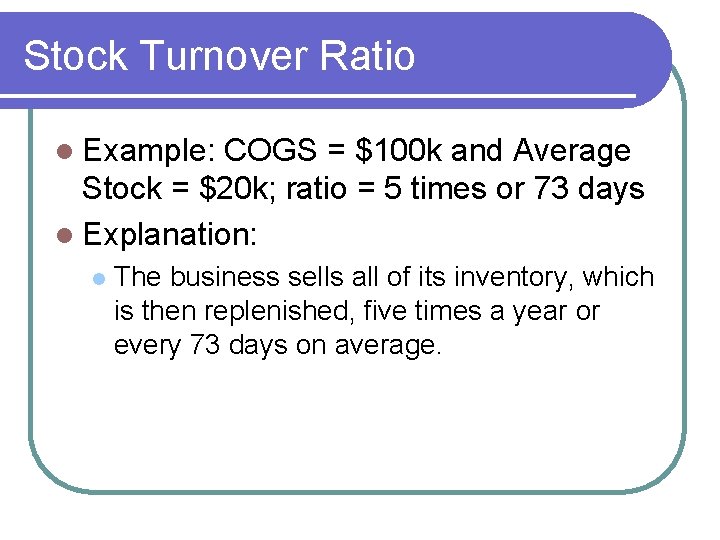
Stock Turnover Ratio l Example: COGS = $100 k and Average Stock = $20 k; ratio = 5 times or 73 days l Explanation: l The business sells all of its inventory, which is then replenished, five times a year or every 73 days on average.
Stock Turnover Ratio l The higher the stock turnover the better, because money is then tied up for less time in stocks. A quicker stock turnover also means that the firm gets to make its profit on the stock quicker, and so the firm should be more competitive. l However, it will vary between industries and so it is important to compare within an industry, as well as from year to year.
Debtor Days Ratio l Measures the number of days it takes a firm to collect money from its debtors. Trade Debtor Collection Period = Debtors X 365 Sales Revenue A low value means that the firm is managing its debtors well. A higher value indicates that debtors are taking longer to pay. The firm would need to investigate this further.
Creditor Days Ratio l Measures the number of days it takes, on average, for a business to pay its trade creditors. l Trade Creditors Payment Period = Creditors x 365 COGS A longer period means that it is taking the business longer to pay its debts to its creditors. This could be an advantage (ie free credit) or indicate a problem (lack of money to make payments!). It can also prove disastrous as it may force suppliers into bankruptcy.
Gearing Ratio l Is used to assess a firm’s long-term liquidity position. l Gearing Ratio = Loan capital X 100 Total Capital employed A higher % means that the firm must pay more interest on profits each year. Failure to do so could lead to insolvency. A lower % is preferable since shareholders will only be paid a dividend out of profits if the directors feel that the firm can afford it.
Gearing Ratio l Example: LT liabilities = $5 million while its capital employed = $15 million; gearing ratio = 33. 3% l This means that 1/3 of the firm’s sources of finance comes from external interestbearing sources while the other 2/3 represents internal sources of finance. l A firm is said to be highly geared if it has a gearing ratio of 50% and above.