Effects of Low Fertility and Population Aging on


 find that population aging")
 and")


")


 becomes the following empirically testable equation: 20")

")
")


 26")
 ü Population")
 ü Future")
")


")

")
")


- Slides: 42
Effects of Low Fertility and Population Aging on Economic Growth October, 2017 Hyun-Hoon Lee (Kangwon National University) Kwanho Shin (Korea University) OECD-UNFPA-MOHW-KIHASA Joint Conference on Low Fertility, Challenges and Responses in the Era of Ageing Population, October 19 -2 -, 2017. 1
1. Introduction l During the past few decades, most countries in the world have experienced a rapid demographic transition from high fertility and mortality to low fertility and mortality. l This transition has resulted in a pronounced increase in the share of old population in many countries, particularly in high-income countries such as Japan and Korea. l Such a demographic transition is expected to have a negative impact on aggregate economic growth. l However, previous empirical studies examining the direct impact of population aging on economic growth have reported mixed results. 2
1. Introduction l For example, using a panel dataset for the period 1960 – 2005, Bloom, Canning and Fink (2008) find that the effect of old age on growth is negative in the short run, but insignificant in the long run. l The authors argue that much of the negative effect of aging may have been mitigated by behavioral responses such as higher savings for retirement, greater labor force participation, and increased immigration of workers from developing countries. l This line of argument can also be found in Bloom, Canning and Fink (2011) and Bloom, Canning and Finlay (2008). 3
1. Introduction l Similarly, using the partial adjustment model in a panel framework and a dataset of 80 countries in 1960 – 2005, Lee et al (2013) find that unlike the share of the youth in population, the share of the elderly in total population or relative to the working age population, does not appear to hold back economic growth. l Acemoglu and Restrepo (2017) argue that during 1990 -2015, countries experiencing more rapid aging have grown more rapidly because of their more rapid adoption of automation technologies. However, their empirical specification is rather simple, not controlling a number of growth variables. 4
1. Introduction l However, some other studies that examine the link between population aging and economic growth have found detrimental growth effects of population aging. l For example, using a sample of over 100 countries, Park and Shin (2012) also find that population aging has a negative impact on labor force participation, total factor productivity (TFP) growth, and the savings rate, even though it does not affect capital accumulation. 5
1. Introduction l More recently, Lee, Shin, and Park (2017) find that population aging hampers economic growth in both short run and long run for 142 countries over the period from 1960 to 2014. l They also find that elderly participation in the labor force has a positive influence on economic growth, which suggests that the harmful effect of aging can be mitigated by more active participation of the elderly in the labor force. l Unlike previous studies, they use the Penn World Table 9. 0’s newly available national-accounts growth rates (RGDPNA), which is recommended by PWT for studies comparing growth rates across countries. Lee, Hyun-Hoon, Kwanho Shin, and Donghyun Park (2017), “Population Aging and Its Impact on Economic Growth: Implications for Korea” , Keizai-Bunseki (Economic Analysis), Vol. 195, Economic and Social research Institute. 6
1. Introduction We report the major findings of Lee, Shin, and Park (2017) and also some additional results obtained from the same data set. o 1. We assess whether population aging hampers economic growth, expressed in constant local currencies. 2. We test if such a negative impact of population aging is stronger in the group of aged countries. 3. We investigate if greater participation of women and the elderly in the workforce mitigates the negative impact of population aging on economic growth, especially in the group of aged countries. 4. We investigate the implication of low fertility on economic growth, using the lead variable of youth age population. 7
1. Introduction o Contents of presentation 1. Introduction 2. Data and descriptive Statistics 3. Empirical specification 4. Empirical results 5. Projection for Korea and China’s future growth 6. Summary and concluding remarks 8
2. Data and descriptive statistics Population aging o ü Data on age structures are collected from World Bank’s World Development Indicators online data base. ü 1960 -2014 9
Trend of youth-age vs. old-age share
Trend of youth-dependency vs. old dependency
Source: Lee, Park and Shin (2017)
2. Data and descriptive statistics Population aging o ü Appendix Table 1 ranks 171 countries according to old age population share during 2010 -2014. ü Japan ranked top with the old age share of 24. 3%, followed by Italy, Germany, Greece, and Portugal. ü Korea and China ranked 48 th and 60 th, respectively, with an old age share of 11. 86% and 8. 69%, respectively, during 2010 -2014. ü Japan stands out as the fastest aging country. Its old age population share increased by 1. 84% every five years between 1960 and 2014. Korea ranked 25 th, with an increase of 0. 82% in its old age population share every five years. 13
Trend of youth-dependency vs. old dependency
2. Data and descriptive statistics GDP per capita growth rates o ü Penn World Table version 9. 0, released on June 9, 2016 ü Covers 192 countries up to 2014. ü Among the five types of real GDP, we use real GDP using national-accounts growth rates (RGDPNA), which is recommended by PWT for studies comparing growth rates across countries. ü We also use growth rates of output-based GDP at chained PPPs (rgdpo), for the sake of comparison. ü 1960 -2014 15
Trend of GDP per capita annual growth rates
3. Empirical Specification
3. Empirical Specification
3. Empirical Specification ü We use a panel data set of 142 countries for the period 1960 -2014 ü In order to minimize the yearly fluctuations due to business cycles, we use five-year averages of variables for eleven sub-periods of (1960 -1964), (1965 -1969), (1970 -1974), (1975 -1979), (1980 -1984), (1985 -1989), (1990 -1994), (1995 -1999), (2000 -2004), (2005 -2009), and (2010 -2014). ü We then calculate the growth rates of GDP per capita for 5 year interval (i. e. 1 period interval) and 10 year interval (i. e. 2 period interval). ü We control for country-fixed effects. We also include period dummies to take account of factors such as the global business cycle, global capital market shocks, and so forth. ü We assume that the productivity of the economy, ln(A), is a function of trade openness and time-invariant country fixed effects.
ü Then (4) becomes the following empirically testable equation: 20
4. Empirical results Table 1: Effects of population aging on economic growth (5 year interval) Table 2: Effects of population aging on economic growth (10 -year interval) 21
Source: Lee, Shin, and Park (2017)
Source: Lee, Shin, and Park (2017)
o Effects of population aging on economic growth ü Population aging has a negative impact on economic growth not only in the short run but also in the long run. ü In fact, population aging has a bigger negative impact on economic growth than the share of youth in the population. ü Specifically, a 10 percentage point increase in the old age share will decrease the 10 -year economic growth rate by 0. 41 points (or 41 percentage points) in the long run, leading to a lower steady state income per capita. ü If the change in the old-age share increases by one percentage point over a 10 year period, the 10 e-year economic growth rate will decrease by 0. 046 point (or 4. 6 percentage points). 24
o Effects of population aging on economic growth Implications: ü A 10 percentage point increase in the old age share will decrease the 10 -year economic growth rate by 41 percentage points. ü A 10 percentage point increase in the old age share will decrease about 3. 5 percentage points in annual GDP growth rates) ü Japan’s Economic slowdown since the early 1990 s and Europe’s slowdown in recent years are largely due to population aging. ü As the world’s population is aging rapidly, the world’s economic slowdown is inevitable. 25
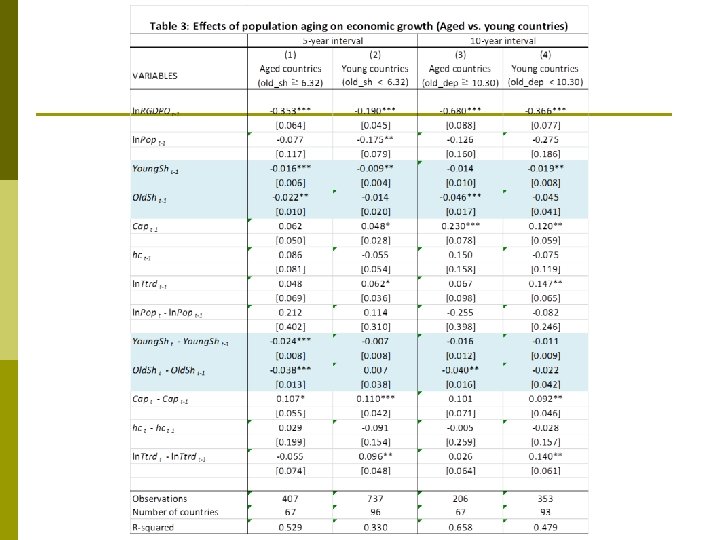
Table 3: Effects of population aging on economic growth (Aged vs. young countries) 26
o Effects of population aging on economic growth (Aged vs. young countries) ü Population aging carries significant negative coefficients both in level and change only in the group of aged countries, thus suggesting that population aging harms economic growth only after it reaches a certain high level. ü Why? ü As population aging has reached an advanced stage, business firms and consumers alike become more pessimistic about future growth prospects, adversely affecting investment and consumption. 28
Table 4: Effects of “future” population aging on economic growth (five-year interval) ü Future demographic structure can be predicted with reasonable accuracy. ü If population aging is expected to reach a high level in the foreseeable future, business firms and consumers alike become more pessimistic about future growth prospects, adversely affecting investment and consumption. ü Low fertility rate today means low young shares in the following 15 years. ü Therefore we test if tomorrow’s demographic structure affects economic growth today by re-running the regressions with inclusion of the lead variables of young and old shares (and dependency ratios). 29
Source: Lee, Shin, and Park (2017)
o Effects of “future” population aging on economic growth ü We find that the future level of population aging, not just the past level, has a detrimental effect on economic growth. ü In contrast, future population share of the young has a positive effect on current growth. The prospects of more future workers and consumers boosts confidence and economic activity today. ü This finding implies that low fertility rate (and hence lower future level of young population) has a detrimental effect on economic growth. 31
Table 5: Effects of population aging and labor participation on economic growth 32
o Effects of population aging and labor participation on economic growth ü Labor force participation rate of the elderly has a positive impact on economic growth in both short- and long-run. ü Labor participation rate of women is also found to influence economic growth positively in the short run. 34
5. Projection for Korea and China’s future growth ü We examine Korea’s future aging trajectory and its impact on Korea’s future growth prospects, and compare them with Japan’s past experiences. ü Figure 5 places future projections (2016 -2036) for Korea’s old dependency ratio, young dependency ratio, and working-age population ratio in parallel with Japan’s (1996 -2016), with a twentyyear-lag. ü The figures confirm that the three pairs of old dependency ratio, young dependency ratio and working-age population ratio are almost identical. ü If anything, aging is even more rapidly progressing in Korea. 35
Source: Lee, Park and Shin (2017)
The model predicts Japan’s performance well ü Figure 6 shows Japan’s actual and fitted growth rates. ü The model explains the movements of Japan’s growth rates quite successfully except for the recent few years. ü The model actually predicts lower than actual growth rates in the most recent years. ü ü The predicted growth rate in 2013 is -1. 6% while the actual growth rate is 0. 4%. The possibility that Japanese policies not captured by the model helped mitigate the effect of aging on growth. 37
Source: Lee, Shin, and Park (2017)
Source: Lee, Shin, and Park (2017)
5. Projection for Korea’s future growth ü Figure 7 shows the actual, fitted and future projections of Korea’s growth rates. ü The future predicted values of demographical variables such as population and young and old dependency ratios were collected from Statistics Korea. ü We also assumed that there is no further change in human capital, but that openness and capital changes at the same rate as the average of the past 10 years. ü The fitted growth rates also mimic Korea’s actual growth rates quite well. ü The projected growth rates decline continuously, to reach -2. 7% in 2034, implying that Korea’s growth rate in 2034 will be even lower than Japan’s fitted growth rate from 20 years ago (2014). ü This reflects that aging is progressing even more rapidly in Korea than it did in 40 Japan.
6. Summary and Concluding Remarks ü Our empirical evidence confirms the harmful effect of population aging on economic growth, and the evidence is strongest for the “aged” countries at advanced stages of the demographic transition. ü The negative impact of aging can be mitigated to a certain degree by boosting female labor participation in the sense that it has a positive effect on economic growth, at least in the short run. ü This finding resonates strongly for Japan and Korea, which have two of the lowest female labor force participation rates in OECD. ü We also find that the effect of elderly labor force participation has an ambiguous effect on economic performance. 41
6. Summary and Concluding Remarks ü Lastly, we find that the future level of population aging, not just the past level, has a detrimental effect on economic growth. ü In contrast, future population share of the young has a positive effect on current growth. The prospects of more future workers and consumers boosts confidence and economic activity today. ü This finding implies that low fertility rate (and hence lower future level of young population) has a detrimental effect on economic growth. 42